
6.2: Trophic Webs Teacher's Preparation Notes
- Page ID
- 25203
Overview
In this activity, students analyze the production and utilization of organic molecules in ecosystems. Students construct a food web for Yellowstone National Park, including producers, primary consumers, secondary consumers, decomposers, and trophic omnivores. Then, students analyze a trophic cascade that resulted when wolves were reintroduced to Yellowstone.
Students learn how carbon atoms and energy move in ecosystems as a result of the trophic relationships in food webs, photosynthesis, biosynthesis, and cellular respiration. This provides the basis for understanding carbon cycles and energy flow through ecosystems. In the final section, students use these concepts and quantitative reasoning to understand trophic pyramids.
Learning Goals
Learning Goals Related to Next Generation Science Standards
Students will gain an understanding of Disciplinary Core Idea LS2.B, Cycles of Matter and Energy Transfer in Ecosystems:
“Food webs are models that demonstrate how matter and energy are transferred between producers, consumers, and decomposers as the three groups interact within an ecosystem.”
“Plants or algae form the lowest level of the food web. At each link upward in a food web, only a small fraction of the matter consumed at the lower level is transferred upward, to produce growth and release energy in cellular respiration at the higher level. Given this inefficiency, there are generally fewer organisms at higher levels of a food web. Some matter reacts to release energy for life functions, some matter is stored in newly made structures, and much is discarded. The chemical elements that make up the molecules of organisms pass through food webs and into and out of the atmosphere and soil, and they are combined and recombined in different ways. At each link in an ecosystem, matter and energy are conserved.”
“Photosynthesis and cellular respiration are important components of the carbon cycle, in which carbon is exchanged among the biosphere, atmosphere, oceans, and geosphere through chemical, physical, geological, and biological processes.”
Students will engage in several Scientific Practices:
- “Constructing explanations” (sections I-V)
- “Developing and using models” (sections II-V)
- “Analyzing and interpreting data” (sections II and V)
- “Using mathematics and computational thinking” (section V)
The Crosscutting Concept, “Energy and Matter: Flows, Cycles, and Conservation” is the central theme of sections III-V of this activity.
This activity helps to prepare students for the Performance Expectations:
- MS-LS2-3. “Develop a model to describe the cycling of matter and flow of energy among living and nonliving parts of an ecosystem.”
- HS-LS2-4. “Use a mathematical representation to support claims for the cycling of matter and flow of energy among organisms in an ecosystem.”
- HS-LS2-5. “Develop a model to illustrate the role of photosynthesis and cellular respiration in the cycling of carbon among the biosphere, atmosphere, hydrosphere and geosphere.”
Specific Content Learning Goals
- A producer is an organism that produces all of its own organic molecules from small inorganic molecules, whereas a consumer is an organism that consumes organic molecules produced by other organisms.
- Consumers can be subdivided into primary consumers (herbivores) which eat producers, decomposers which consume dead organic matter, secondary consumers which consume primary consumers or decomposers, tertiary consumers which consume secondary consumers, and trophic omnivores which consume organisms at more than one trophic level.
- In a trophic relationship, one organism consumes organic molecules from another organism (or a decomposer consumes organic molecules from dead organic matter). A food chain shows a simple sequence of trophic relationships (e.g. producer → primary consumer → secondary consumer). A food web shows the multiple complex trophic relationships among the organisms in an ecosystem.
- A food web typically includes both a green food web that begins with producers and a brown food web that begins with dead organic matter. Some organisms at higher trophic levels belong to both the green and brown food webs. Decomposers and brown food webs are crucial to prevent excessive accumulation of dead organic matter.
- Understanding a food web can help us to understand how changes in the population size of one organism can influence the population size of another organism in an ecosystem. For example, a trophic cascade can occur when an increase in a predator population results in a decrease in an herbivore population which in turn results in increased plant growth.
- Several processes contribute to the movement of carbon atoms and energy in ecosystems. Organic molecules contain both carbon atoms and chemical energy, so carbon atoms and energy move together when a consumer eats organic molecules or when an organism dies and becomes dead organic matter.
- Photosynthesis, cellular respiration, and biosynthesis also contribute to the movement of carbon atoms and energy transformations in ecosystems. For example, during photosynthesis, light energy is used to incorporate carbon atoms from CO2 into organic molecules which have high chemical energy.
- Photosynthesis, cellular respiration, and biosynthesis, like all biological processes, follow these general principles.
- The atoms in molecules can be rearranged into other molecules, but atoms cannot be created or destroyed.
- Energy is neither created nor destroyed by biological processes.
- Energy can be transformed from one type to another (e.g. the energy in sunlight can be transformed to chemical energy in glucose).
- All types of energy transformation are inefficient, so some of the input energy is transformed to heat energy.
- The carbon cycle results from the processes of:
- Photosynthesis, which moves carbon atoms from CO2 in the air to organic molecules in plants (and biosynthesis, which produces the complex organic molecules in an organism)
- Consumption which moves carbon in organic molecules from one organism to another (and death and defecation which move carbon in organic molecules to dead organic matter)
- Cellular respiration which moves carbon atoms from organic molecules to CO2 in the air.
- Energy cannot cycle in ecosystems because all energy transformations are inefficient, so some of the input energy is transformed to heat which cannot be used as the input energy for photosynthesis. Therefore, energy flows through ecosystems from sunlight → chemical energy in organic molecules → heat energy which is radiated out to space. Thus, ecosystems with living organisms depend on the constant input of light energy from the sun. In contrast, the earth does not receive a significant inflow of carbon atoms and this is not a problem because carbon atoms are constantly recycled.
- The biomass of an organism is the mass of the organic molecules in the organism. The rate of production of biomass is highest for the producers in an ecosystem and smaller for each higher trophic level in the ecosystem. A major reason is that much of the biomass eaten by consumers is used for cellular respiration, so carbon atoms are lost as CO2 is released to the environment. This reduction in the rate of biomass production at each trophic level results in a trophic pyramid. One practical implication is that it takes about ten times as much land to produce an equivalent biomass of meat from a primary consumer compared to a similar biomass of plant food.
Supplies for Section II. Food Chains and Food Webs
- 24 cards for a simplified partial Yellowstone food web (to be reused in each class, so you will need a deck of cards for each group of 2-4 students in your largest class)
- (Pages 14-17 of these Teacher Preparation Notes have the images for these cards. We recommend that you print the cards on card stock or laminate these cards for durability. A PDF file suitable for professional printing and cutting of cards is available on the comments page of http://serendip.brynmawr.edu/sci_edu/waldron/#ecolfoodw eb.)
- A lab table or other surface ~2.5 ft.² (~76 cm2) which students can write on with chalk or dry erase marker as they create their food web or a large piece of paper (e.g. from an easel pad) or poster board (a minimum of 2.3 ft.² (70 cm2)) (for each student group)
- If students are writing on lab tables, a dry erase marker or chalk to draw boxes and arrows as directed on page 3 of the Student Handout (one for each student group in your largest class)
- Ruler (one for each student group in your largest class)
- 1 piece of paper for each student to draw the food web to answer question 6 (The paper should be used in landscape orientation. You may want to use the template shown on the last page of these Teacher Preparation Notes or you may want to use a larger piece of paper, e.g. legal size)
Instructional Suggestions and Background Information
As background for this activity, students should have a basic understanding of cellular respiration and photosynthesis. For this purpose, we recommend “How do biological organisms use energy?” (http://serendip.brynmawr.edu/exchange/bioactivities/energy) and “Using Models to Understand Photosynthesis” (http://serendip.brynmawr.edu/exch ange/bioactivities/modelphoto).
We estimate that the first two sections of this activity will require one 50-minute period. (Depending on your students, you may want to complete page 1 of the Student Handout the day before making the food web or page 4 the day after making the food web.) We estimate that sections III-V will require another 50-minute period. Depending on your learning goals, you can use just sections I-II or sections I-IV.
In the Student Handout, numbers in bold indicate questions for the students to answer.
A key for this activity is available upon request to Ingrid Waldron (iwaldron@sas.upenn.edu). The following paragraphs provide additional instructional suggestions and background biology information – some for inclusion in your class discussions and some to provide you with relevant background that may be useful for your understanding and/or for responding to student questions.
I. Introduction
The first section of the Student Handout introduces some useful terminology. We introduce the term producer (but not the equivalent term autotroph) for organisms that use energy from sunlight to make all of their organic molecules. We also introduce the term consumer (but not the equivalent term heterotroph) for organisms that consume organic molecules produced by other organisms. If you want, you can easily include the terms autotroph and heterotroph.
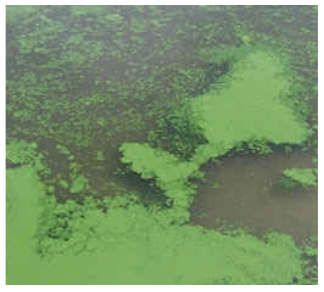
Producers include not only plants (which are mentioned in the Student Handout), but also other photosynthesizing organisms such as algae and cyanobacteria.
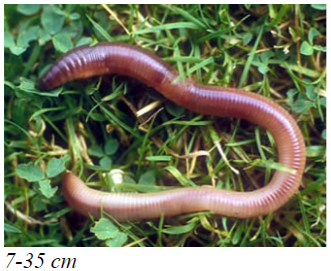
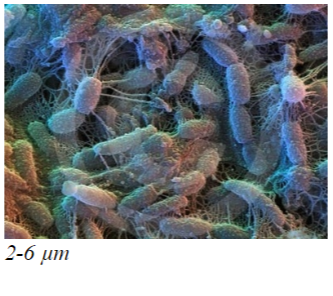
Decomposers such as bacteria and fungi release enzymes into dead organic matter; these enzymes digest complex organic molecules into smaller soluble molecules that are absorbed by the decomposers. Detritivores such as earthworms ingest dead organic matter, extract nutrition and excrete smaller particles that decomposers can act on. Other animals such as coyotes feed on carrion such as the remains of an elk killed by a wolf pack.
An entertaining and informative brief video, “Dead Stuff: the Secret Ingredient in Our Food Chain” (https://www.youtube.com/watch?v=KI7u_pcfAQE), summarizes some of the information in this section and introduces food chains and food webs. You may want to show this video at the end of this introductory section or near the beginning of section II, Food Chains and Food Webs.
II. Food Chains and Food Webs
For the discussion of food chains and food webs, your students should understand that the arrows point from the organism that is consumed to the organism that consumes. In other words, the arrows show the direction of flow of nutrition.
The trophic omnivore category includes the more familiar category of omnivores (animals that eat both producers and primary consumers), but the trophic omnivore category also includes other organisms that consume organisms at more than one trophic level (e.g. a carnivore that consumes both primary and secondary consumers). Notice how similar vocabulary is used differently in different contexts. Another example would be a person who considers himself a vegetarian because he does not eat meat, even though he does eat milk and eggs; according to scientific definitions, he is not an herbivore, but instead is an omnivore.
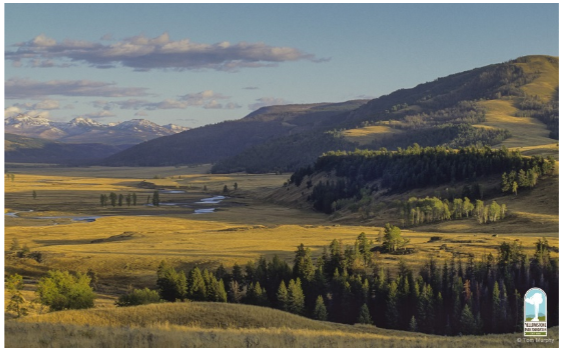
Yellowstone National Park includes ~3500 square miles, mainly in Wyoming. The park includes a variety of habitats, including forests, grasslands, and aquatic habitats.
The Latin names for the animals and plants included in the Yellowstone National Park food web are as follows:
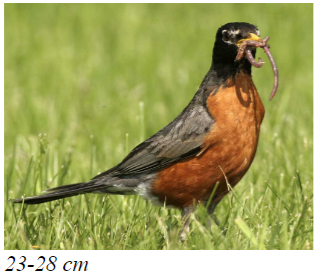
American Robin – Turdus migratorius
Aspen – Populus tremuloides
Beaver – Castor canadensis
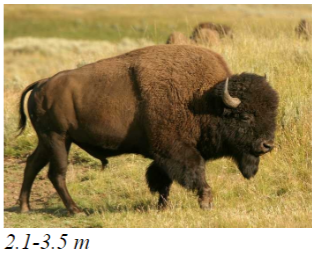
Bison – Bison bison
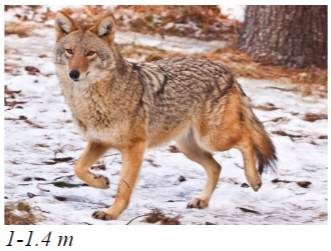
Coyote – Canis latrans
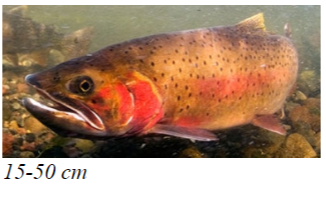
Cutthroat trout – Oncorhynchus clarkii
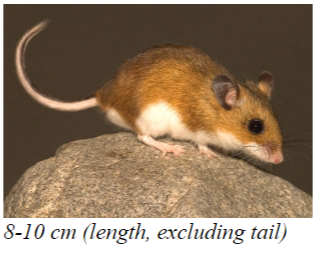
Deer mice – Peromyscus maniculatus
Earthworm – Lumbricina
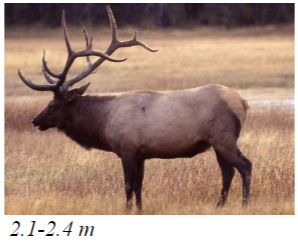
Elk – Cervus elaphus
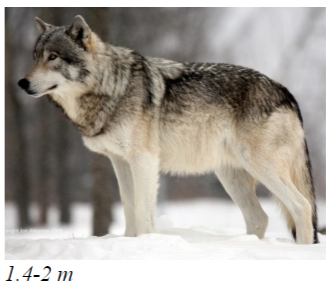
Gray Wolf – Canis lupus
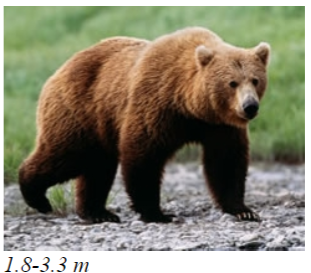
Grizzly bear – Ursus arctos
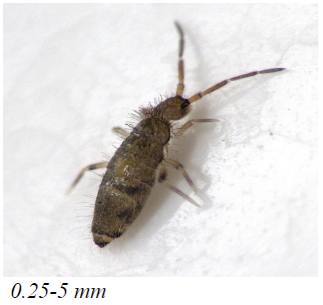
Springtails – Collembola
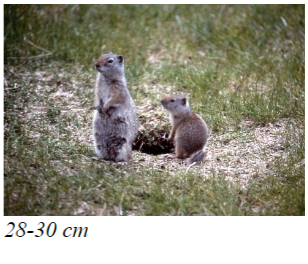
Uinta ground squirrel – Spermophilus armatus
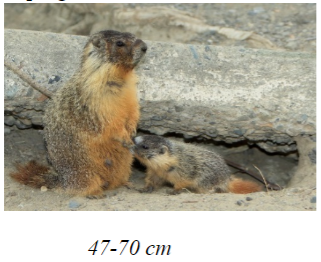
Yellow-bellied marmot – Marmota flaviventris
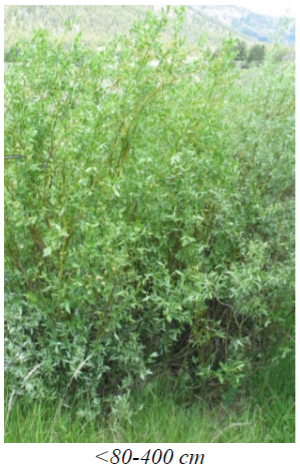
Willow – Salix spp.
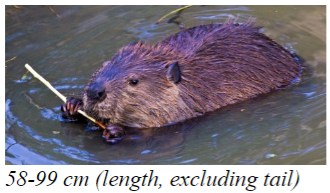
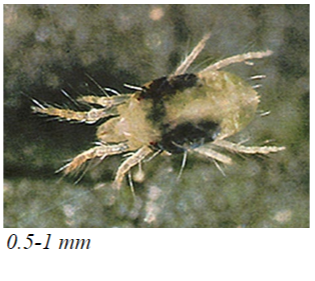
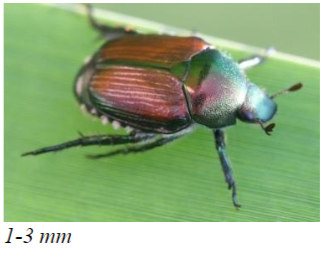
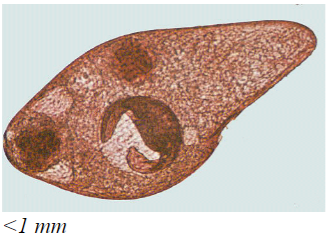
As you distribute the Yellowstone food web cards, you will probably want to point out that most of these cards include a general estimate of the size range (length) for the organism. Your students should notice the tiny size of most of the decomposers and other organisms in the brown food web. Also, we have used the more familiar term “eat” for most of the cards but for bacteria and fungi, we have used the term “consume” since these organisms do not ingest dead organic matter, but rather secrete enzymes into the environment and then absorb digested nutrient molecules.
After your students have made their initial attempt to create the Yellowstone food web, if there are discrepancies between their food web and the food web shown in the key (available upon request to iwaldron@sas.upenn.edu), you may want to provide hints to help the students create a more accurate food web; for example, you may want to tell them the numbers of organisms in each category (4 producers, 6 primary consumers, 2 decomposers, 2 secondary consumers, and 9 trophic omnivores).
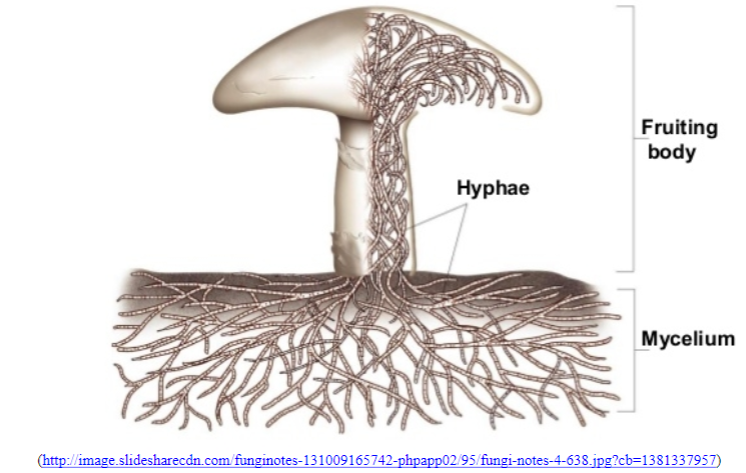
If your students are not familiar with fungi, you may want to introduce them to the basic structure of an above-ground fruiting body that produces spores (e.g. a mushroom), and the mycelium, a vast network of hyphae in the soil, dung, rotting log or other organic matter. The hyphae in the mycelium secrete digestive enzymes and absorb nutrients.
To make a manageable food web for the students to construct, we have omitted most of the types of organisms found in Yellowstone National Park and omitted many of the trophic relationships for the organisms we have included. Even this partial, simplified food web suggests some of the complexity of real biological food webs.
Additional complexities that we have omitted include:
- We have not distinguished between more important and less important trophic relationships. For example, ~90% of wolf kills in Yellowstone are elk, so elk are by far the most important prey for gray wolves in Yellowstone.
- Many types of animals consume different types of food at different times of the year and/or at different life stages.
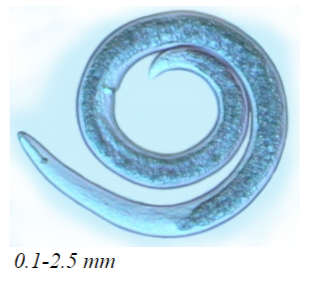
- We have not distinguished between the many different types of fungi, Protista, nematodes, mites, springtails, grasses, and other flowering plants in Yellowstone. We have omitted mention of the different trophic relationships for different species within each of these groups.
- None of the many parasites present in any biological community have been included.
- The Yellowstone food web consists of sub-webs in different habitats such as lakes, streams, soil, and above-ground grassland and forest.
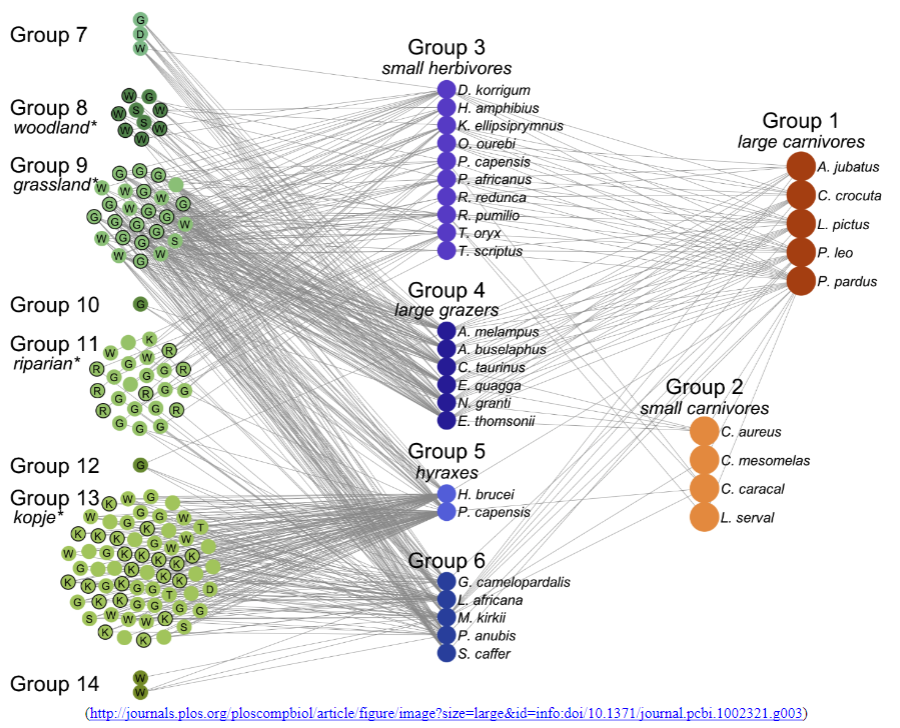
It should be pointed out that, for practical reasons, all or almost all published food webs are partial, since it is virtually impossible to research and describe all the many species and trophic relationships in real biological food webs. For example, one analysis of a plant-mammal food web for the Serengeti ecosystem included 129 species of plants and 32 species of mammals but excluded many other mammals, reptiles, amphibians, birds, invertebrates and decomposers. The
Serengeti food web (shown in the figure on the next page) shows one way to organize complex food web data by grouping species according to similarities in spatial location and trophic relationships. The left column shows the groups of plants, the middle column shows the groups of herbivores, and the groups of carnivores are shown on the right.
The trophic cascade discussed on page 4 of the Student Handout is an example of top-down control of population size. The trends in elk population size were influenced by additional factors, including the very severe winter of 1996-97 when ice over snow prevented access to winter forage for elk; this resulted in high elk mortality. This is an example of bottom-up control, another important type of control of population size.
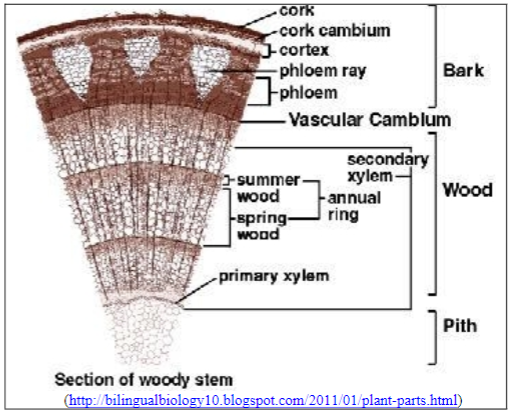
If your students are not familiar with annual growth rings, you may want to explain that the area of each annual growth ring is a measure of the amount of growth of a willow in a given year. If elk eat less of the leaf and branch growth, the willow will have more leaves which will result in more photosynthesis which in turn will result in more biosynthesis and a thicker annual growth ring. Annual growth rings are visible because the new xylem cells produced in the spring are large and thin-walled, whereas the new xylem cells formed in the summer are smaller and thick-walled.
You may want to show your students either or both of these videos related to trophic cascades. These videos have contrasting strengths:
- “Wolves of Yellowstone” (http://education.nationalgeographic.org/media/wolves-yellowstone/) (an engaging National Geographic video that may overestimate the effects of wolves)
- Ecosystem video concerning research in Yellowstone (beginning at 13 minutes and 40 seconds in http://www.learner.org/courses/envsci/unit/text.php?unit=4&secNum=1 ) (more balanced and more detailed about research)
III. Photosynthesis, Cellular Respiration, and Biosynthesis
Photosynthesis, cellular respiration, and biosynthesis play important roles in the carbon cycle and energy flow in ecosystems. In this section, students review a basic summary of each of these complex molecular/cellular processes as they prepare for the next section on the carbon cycle and energy flow in ecosystems. Additional information about these processes (including an explanation of the estimate that cellular respiration of one glucose molecule produces only ~29 ATP) is provided in “Cellular Respiration and Photosynthesis – Important Concepts, Common Misconceptions, and Learning Activities” (available at http://serendip.brynmawr.edu/exchange/bioactivities/cellrespiration).
We recommend having a class discussion of question 9 before proceeding to the discussion of cellular respiration and biosynthesis. This discussion should not only ensure that students understand photosynthesis, but also ensure that students understand the type of chart being used to present photosynthesis, cellular respiration, and biosynthesis. Students may be puzzled by the idea that photosynthesis produces heat since leaves generally do not feel warm; this can be explained by considering that only a relatively small amount of heat is produced by photosynthesis in a single leaf and other processes such as transpiration tend to cool leaves.
Biosynthesis is important to include to reinforce student understanding that organic molecules are used not only for cellular respiration but also for making the many organic molecules in an organism. The following equation and diagram provide additional information about the basics of the biosynthesis and structure of cellulose.
n(HO–C6H10O4–OH) → H–(O–C6H10O4)n–OH + (n – 1)H2O
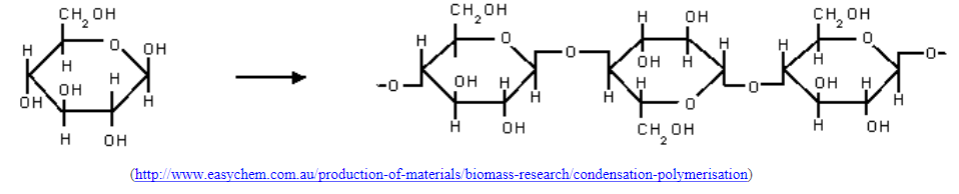
The details of this reaction are not important for our purposes; the reaction is included only to illustrate an example of biosynthesis. The chart on the top of page 6 of the Student Handout includes the role of ATP in providing the energy for biosynthesis; however, you can omit this if you feel your students will understand the overall argument better without this complexity. You might want to mention additional biosynthesis reactions that are needed to make all the many types of molecules in an organism. For example, producers use carbon-containing molecules and mineral sources of nitrogen (e.g. NH4+) to make amino acids; then, amino acids are joined together to form proteins.
With regard to question 13, you may want to mention that cows do not produce enzymes that digest cellulose; instead, a cow’s rumen contains bacteria that produce the enzymes that digest cellulose.
The general principles presented on the bottom of page 6 of the Student Handout will be familiar as the conservation of matter, the conservation of energy, and the laws of thermodynamics. You may need to remind students that matter (atoms) is not converted to energy in biological processes, and energy is not converted to matter.
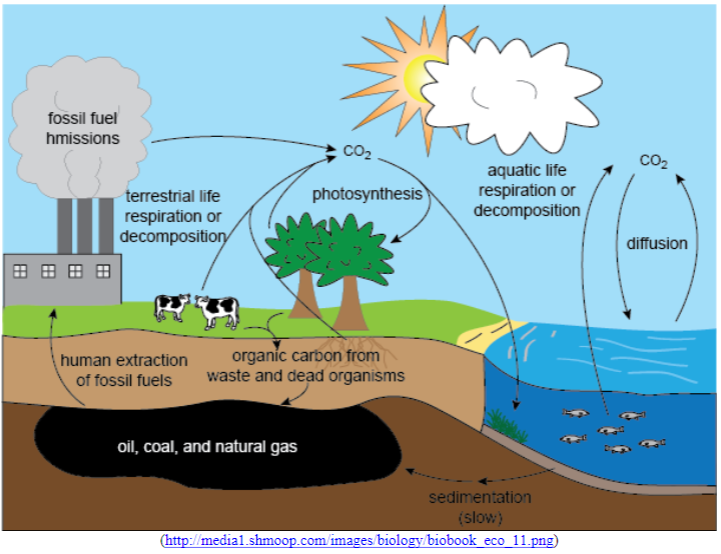
IV. Carbon Cycle and Energy Flow
In this section, students develop an understanding of carbon cycle and energy flow through ecosystems by building on their understanding of food webs and the processes of photosynthesis, cellular respiration, and biosynthesis. One goal for this section is to help your students understand the relationships between phenomena observed at different organizational levels, including the relationships between (1) the molecular/cellular processes of cellular respiration, photosynthesis and biosynthesis, (2) effects at the individual organism level, and (3) the ecosystem level phenomena of carbon cycle and energy flow. Students often find it challenging to link their understanding of phenomena observed at different organizational levels, so you will probably want to reinforce this understanding in your class discussions of the questions in this section.
The carbon cycle shown in the Student Handout is simplified to help students clearly understand the basic processes in the carbon cycle. You may want to point out to your students the short arrow labeled “eaten by animals” which represents a trophic relationship in a food web.
A more complete overview of the carbon cycle is shown on the next page. This figure could provide a useful starting point for a discussion of global warming (http://www.nasa.gov/feature/goddard/carbon-climate).
For page 8 of the Student Handout, it will be important to have a class discussion that consolidates student understanding of why energy cannot cycle.
The Student Handout refers to sunlight as the input energy for ecosystems. Although sunlight is the input energy in most ecosystems, in deep-sea hydrothermal vents and iron-rich rocks deep below the earth’s surface, the input energy that primary producers use is the chemical energy contained in compounds such as ammonia or hydrogen sulfide.
For question 18, you may want to provide colored pencils, pens or markers so students can draw the four types of arrows in different colors. If your students are familiar with compost piles, you may want to discuss how compost piles heat up due to the metabolic activity of decomposers. After the students have completed question 18, you may want to point out that some of the arrows represent processes where energy and carbon atoms move together in organic molecules, but other arrows represent processes where energy moves independently of carbon atoms. Since organic molecules contain both chemical energy and carbon atoms, energy and carbon atoms move together when organic molecules are consumed or when an organism dies and its organic molecules become part of the dead organic matter. In contrast, light enters an ecosystem and heat leaves an ecosystem independent of the movement of carbon atoms.
Useful background for this section is provided in “Energy Flow through Ecosystems” (http://www.learner.org/courses/envsci/unit/text.php?unit=4&secNum=3) and “Biogeochemical Cycling in Ecosystems” (http://www.learner.org/courses/envsci/unit/text.php?unit=4&secNum=4).
V. Trophic Pyramids
Question 20 should help students link their own experience to basic phenomena that play important roles in determining the shape of trophic pyramids. Estimated annual per capita food consumption in the US includes 75 pounds of added fats and oils, 152 pounds of caloric sweeteners, 195 pounds of meat and fish, 200 pounds of grains, 593 pounds of dairy, and 708 pounds of fruit and vegetables (http://www.usda.gov/factbook/chapter2.pdf). Notice that the types of foods at the beginning of this list have high caloric density; foods in the last two categories weigh substantially more per calorie consumed, in large part because they contain a lot of water.
Biomass (the mass of the organic molecules in an organism) is typically estimated by weighing a dried specimen to estimate the mass of the organism minus the mass of the water in the organism.
Partial food webs for the forest in New Hampshire discussed in questions 21-23 are shown below. In this forest ecosystem, only about 5% of producer biomass gets consumed while the plants are still alive (the green food web), and almost 95% is consumed only after the plants die (the brown food web).
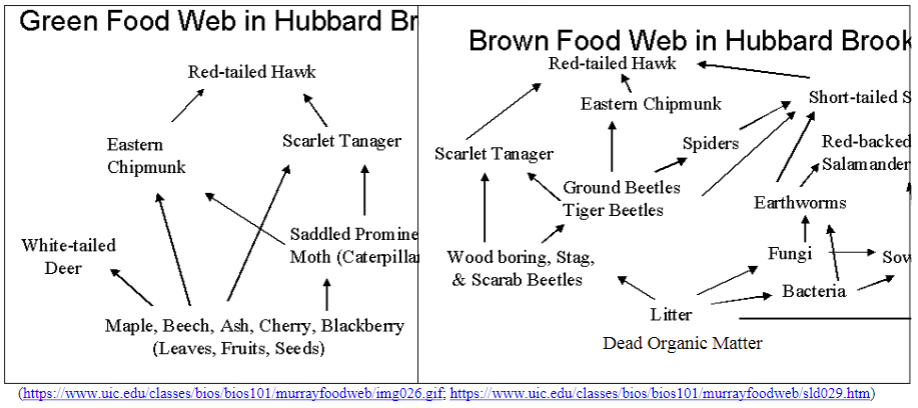
In question 21, the rate of production of biomass for producers is the Net Primary Production, which is the total organic matter produced by producers minus the amount used by producers for cellular respiration. In this study, the proportion of Net Primary Production that became biomass in primary consumers and decomposers was 20%. This proportion is higher than the more often quoted 10% transfer between producers and primary consumers, primarily because decomposers have been included together with primary consumers. Many estimates of biomass production at the second trophic level omit decomposers, even though decomposers are a very important part of the second trophic level since a substantial amount of plant biomass dies before it is consumed by primary consumers.
This illustrates the general point that the shape of trophic pyramids is highly dependent upon the specific methodology used. The rate of production of biomass must be smaller at each higher trophic level because at each trophic level some organic molecules are metabolized in cellular respiration and carbon is lost as CO2 is released. If a trophic pyramid assesses numbers of organisms or amount of biomass rather than flux, the pyramid may have a very different shape. For example, the number of individuals may be greater for a higher trophic level, e.g. if the organisms at the higher trophic level are smaller, such as insects feeding on trees. Similarly, there may be more biomass at a higher trophic level, e.g. if the organisms at the higher trophic level are more long-lived, such as whales feeding on plankton. In summary, trophic pyramids for the rate of production of biomass always show the classic pyramid shape. However, trophic pyramids for a number of organisms or for biomass of organisms vary in shape and tend to show the classic pyramid shape only if organisms at different trophic levels have similar size and longevity (http://www.esa.org/history/Awards/papers/Brown_JH_MA.pdf, page 1785).
As students draw the graph for question 23, the bar for each trophic level should extend the full height of the row for that trophic level in the graph. Thus, differences in the width of the bar for each trophic level will allow easy visual comparison of the rate of production of biomass at the different trophic levels.
In discussing the trophic pyramid on the top of page 11 of the Student Handout, you will want to question your students about the biological processes that result in “the general estimate that the rate of production of biomass at one trophic level is ~10% of the rate of production of biomass at the just lower trophic level” (reemphasizing the points from questions 20 and 22). The relative importance of the different processes varies for different types of organisms. For example, the proportion of consumed biomass that is used for cellular respiration is ~80% for chipmunks vs. 33% for herbivorous insects. (This difference reflects the fact that chipmunks are homeotherms, whereas herbivorous insects are poikilotherms; homeothermy is metabolically expensive.) The proportion of the biomass consumed that is lost as feces is ~18% for chipmunks vs. ~50% for herbivorous insects that eat leaves. (Leaves have more cellulose and other relatively indigestible molecules than the nuts, seeds, and fruits eaten by chipmunks). As a result of these various differences, biomass production for chipmunks is ~2% of the biomass consumed, whereas biomass production for herbivorous insects is ~17% of the biomass consumed.
Comparison of the graph that students produce in question 23 with the trophic pyramid shown on the top of page 11 in the Student Handout illustrates the general point that a typical trophic pyramid does not accurately portray how much smaller biomass productivity is at higher trophic levels. The more accurate graph in question 23, together with question 24b, will help students understand why food chains are generally limited to ~5 trophic levels.
In discussing question 26, you may want to mention that eating meat from primary consumers instead of eating plant foods not only requires ~10 times as much land but also requires ~10 times as much water and other resources.
Possible Follow-Up Activity
This activity helps students to understand a range of interrelated phenomena by focusing on the basic processes and relationships. To supplement this approach, you may want to encourage your students to research related topics such as:
- Aquatic food webs
- Eutrophication as an example of bottom-up regulation
- Nutrient cycles for nitrogen, phosphorus, and water
- Global warming (e.g. http://www.nasa.gov/feature/goddard/carbon-climate; resources available at http://www.sciencejournalforkids.org/)
- Biomagnification of concentrations of persistent organic pollutants, mercury, etc. at higher trophic levels
- Other topics that students may ask about during the activity.
Possible Alternative Activities for Middle School Students
A very thorough and carefully researched sequence of activities for teaching middle schoolers about carbon cycles and energy flows is available through Carbon TIME (http://ibis.colostate.edu/MSP/CTIME/TeachingUnitDashboard.php?TeachingUnitID=6# ).
“Who Eats What?” provides a useful introduction to food webs for middle school students is available as part of “Eco-Inquiry” (http://www.caryinstitute.org/educators/teaching-materials/eco-inquiry).
Sources for Figures in Student Handout
- Food web on page 2 – http://www.biorewind.com/ecology/
- Trends in Yellowstone – “Trophic cascades in Yellowstone: The first 15 years after wolf ‘s reintroduction” Biological Conservation 145 (2012): 205-213
- Giraffe carbon cycle – http://www.bbc.co.uk/schools/gcsebitesize/science/images/bi01002.gif
- Carbon cycle and energy flow – http://carbontime.bscs.org/
- Trophic Pyramid – http://files5.pdesas.org/118247080114254228171068116089003070092117008089/Download.ashx?hash=2.2
|
Beavers Eat: Willows Eaten by: Gray wolves |
Elk Eat: Grasses, willows, other flowering plants Eaten by: Gray wolves, grizzly bears |
Bison Eat: Grasses Eaten by: Gray wolves |
|
Yellow-Bellied Marmots Eat: Grasses; other flowering plants Eaten by: Coyotes |
Deer Mice Eat: Grasses; other flowering plants Eaten by: Coyotes |
Uinta Ground Squirrels Eat: Grasses, other flowering plants, mushrooms Eaten by: Coyotes, grizzly bears |
|
Earthworms Eat: Dead organic matter, fungi, bacteria Eaten by: American robins |
Mites Eat: Nematodes, fungi Eaten by: Beetles |
Beetles Eat: Springtails, mites Eaten by: American robins |
|
Springtails Eat: Fungi Eaten by: Beetles |
Bacteria Consume: Dead organic matter Eaten by: Protista, nematodes, earthworms |
Nematodes Eat: Protista, fungi, bacteria Eaten by: Mites |
|
Willows Eaten by: Beavers, elk |
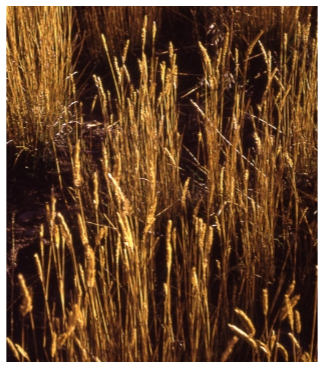
Grasses (including seeds) Eaten by: Bison, elk, deer mice, Uinta ground squirrels, yellow-bellied marmots |
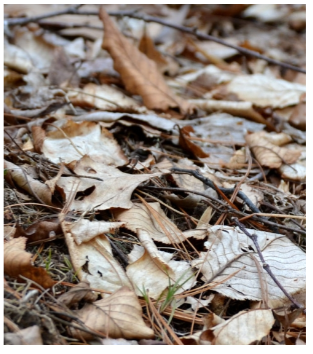
Dead Organic Matter Consumed by: Bacteria, fungi, earthworms |
|
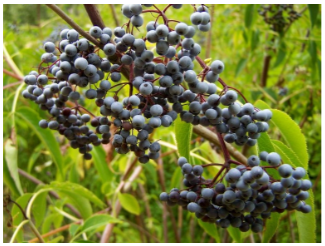
Other Flowering Plants (including berries) Eaten by: American robins, deer mice, elk, grizzly bears, Uinta ground squirrels, yellow-bellied marmots |
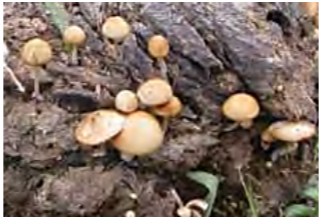
Fungi Consume: Dead organic matter Eaten by: Springtails, mites, nematodes, earthworms, Uinta ground squirrels |
Algae Eaten by: Cutthroat trout |
|
American Robins Eat: Earthworms, beetles, other flowering plants Eaten by: Snakes and birds of prey (not included in this food web) |
Cutthroat Trout Eat: Algae Eaten by: Grizzly bears |
Grizzly Bears Eat: Other flowering plants, cutthroat trout, Uinta ground squirrels, elk |
|
Protista Eat: Bacteria Eaten by: Nematodes |
Coyotes Eat: deer mice, Uinta ground squirrels, yellow-bellied marmots Eaten by: Gray wolves |
Gray Wolves Eat: Elk, beavers, bison, coyotes |
Simplified Partial Food Web for Yellowstone National Park
