
6.1: Trophic Webs Protocol
- Page ID
- 25202
I. Introduction
Organic molecules are complex, carbon-containing molecules found in living organisms. In this activity, we will analyze the production and utilization of organic molecules in ecosystems. We will focus primarily on how carbohydrates are produced and used in ecosystems.
1. Explain how plants make organic molecules. Include the terms CO2, H2O, photosynthesis, sugar, and sunlight in your answer.
2. How do animals get organic molecules?
The difference between plants and animals illustrates a fundamental difference between:
• A producer = an organism that produces all of its own organic molecules from small inorganic molecules
• A consumer = an organism that consumes organic molecules produced by other organisms.
3. Consumers can be divided into several categories. Use your prior knowledge and logical reasoning to match each word or phrase in the top list with the appropriate definition from the bottom list.
Decomposer ___
Primary consumer (herbivore) ___
Secondary consumer ___
Tertiary consumer ___
a. consumes producers
b. consumes dead organic matter
c. consumes primary consumers and/or decomposers
d. consumes secondary consumers
II. Food Chains and Food Webs
Trophic refers to eating or nutrition. In a typical trophic relationship, one organism eats all or part of another organism. In another type of trophic relationship, a decomposer consumes organic molecules from dead organic matter. A food chain summarizes a sequence of trophic relationships within an ecosystem.
One type of food chain begins with a producer:
Producer ⇒ Primary Producer ⇒ Secondary Consumer
Another type of food chain begins with dead organic matter:
Dead Organic Matter ⇒ Decomposer ⇒ Secondary Consumer
Organisms can be categorized in different trophic levels, e.g. producer, primary consumer or decomposer, and secondary consumer. If a consumer eats organisms at more than one trophic level, it is called a trophic omnivore. Trophic omnivores are a broad category that includes not only omnivores (animals that eat both plants and animals), but also some other types of organisms (see question 5 below).
Your teacher will supply your group with a deck of cards, each of which describes one type of organism that lives in Yellowstone National Park (plus a card for dead organic matter).
- Find three cards that form a food chain that starts with a producer. Find three other cards that form a food chain that starts with dead organic matter. Arrange these on a sheet of paper and draw arrows to create two food chains.
The trophic relationships in real biological communities are much more complex than a simple food chain. These more complex trophic relationships are shown in a food web.
The diagram below shows a small part of a food web. Notice that the food web contains multiple food chains.
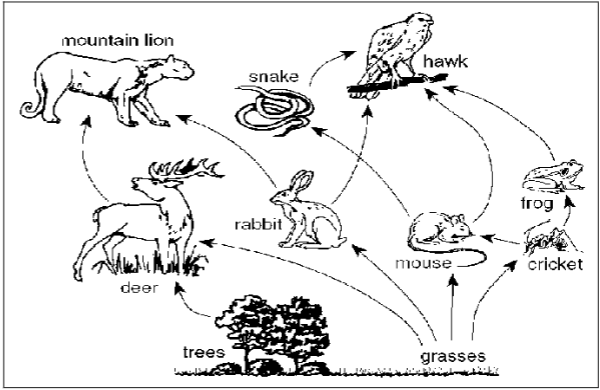
4. Circle the organisms in one of the food chains in this food web. Label the producer in this food chain.
5. Explain why the hawk in this food web is a trophic omnivore, even though it does not eat both plants and animals.
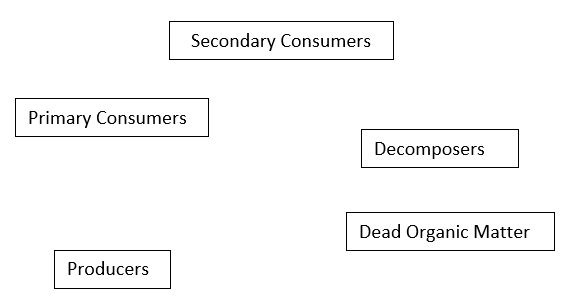
- You will use all of the cards in your Yellowstone deck to create a Yellowstone food web. Begin by drawing the boxes shown in this chart on your lab table or on the large paper provided by your teacher.
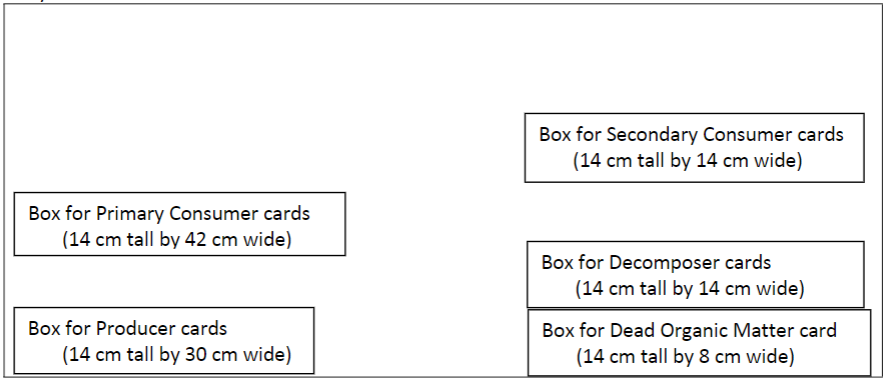
- Identify the producers and decomposers in your Yellowstone deck and put these cards in the appropriate boxes. Next, add the cards for the primary consumers and secondary consumers. Finally, put the cards for the trophic omnivores in the appropriate spaces between the boxes.
- Draw an arrow to show each trophic relationship listed on the cards (42 arrows for the 42 trophic relationships).
6. After your teacher has checked and approved your food web, draw a diagram of the food web on a separate sheet of paper. Include all of the organisms and arrows.
Some scientists distinguish between a green food web that begins with producers and a brown food web that begins with dead organic matter. Notice that in your Yellowstone food web, the green food web contains more familiar plants and animals, whereas the organisms in the brown food web tend to be smaller and less familiar. Some organisms at higher trophic levels are part of both the green and brown food webs.
7. What problem or problems would occur if there were no decomposers and no brown food web?
Although your food web looks complex, a real biological food web is much more complex. Here are two of the reasons why a complete Yellowstone food web would be much more complex.
- Your food web includes only 23 types of organisms. In contrast, Yellowstone Park has many more types of organisms, including more than 1000 different kinds of plants, more than 1000 different kinds of insects, many hundreds of other types of animals, and many types of fungi, Protista, and bacteria.
- Most organisms have more trophic relationships than the few that are shown on each card.
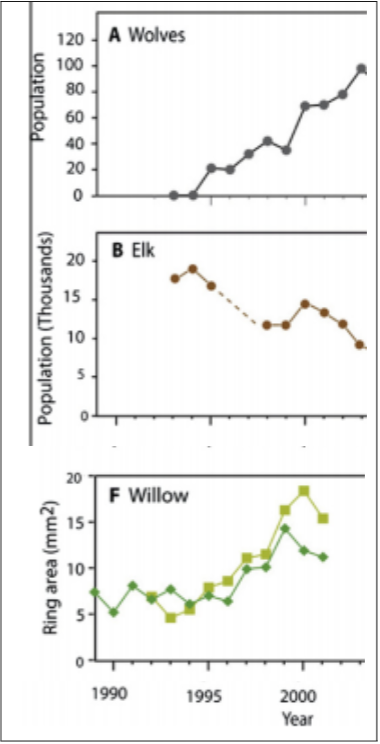
Food webs can help us understand how changes in the population size of one organism in an ecosystem can influence the population size of another organism in the ecosystem. Humans eliminated wolves from Yellowstone National Park for most of the twentieth century. Gray wolves were reintroduced in the park in 1995-1996. The next page shows evidence that, after wolves were reintroduced, there were changes in the populations of some other organisms in Yellowstone.
The top two graphs show how the population of wolves and the population of elk changed following the introduction of wolves into Yellowstone National Park.
The third graph shows trends in the amount of growth of willows (data for annual growth ring size from two different studies).
8. For each organism in the table below:
- State whether population size or amount of growth generally decreased, increased, or stayed the same.
- Explain a likely reason for each trend. Use the information from the food web to understand the trends in the elk population and willow growth.
| Trend in Population Size or Amount of Growth | Explanation for this Trend | |
| Wolves | ||
| Elk | ||
| Willow |
If an increase in a predator population results in a decrease in an herbivore population which in turn results in an increase in plant growth, this type of effect is called a trophic cascade.
III. Photosynthesis, Cellular Respiration, and Biosynthesis
You have learned about food webs, which summarize how organic molecules move between organisms in an ecosystem. Organic molecules contain carbon atoms and chemical energy, so the movement of organic molecules through a food web contributes to the movement of carbon atoms and energy in an ecosystem.
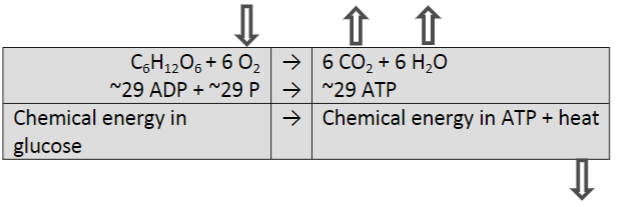
Three other processes that contribute to the movement of carbon atoms and energy in an ecosystem are photosynthesis, cellular respiration and biosynthesis. Each of these processes is shown in a chart where:
- Gray boxes show chemical reactions inside an organism. The upper row of boxes shows changes in how the atoms are organized in molecules, and the lower row shows the associated energy changes.
- Vertical arrows indicate inputs from the environment to the organism or outputs from the organism to the environment.
Photosynthesis
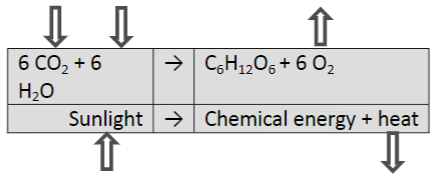
9a. Mark each arrow that shows molecules coming from or returning to the air with an A. Mark the arrow that shows molecules coming from the soil with an S. Circle the organic compound (glucose) that has relatively high chemical energy.
9b. The input energy for photosynthesis is ___________________. Photosynthesis transforms this input energy to ___________________________ in sugar molecules and ______________, which is released to the environment.
Cellular Respiration
Some of the sugar molecules produced by photosynthesis are used for cellular respiration.
10. Use the information about photosynthesis and cellular respiration to explain how carbon atoms can move from CO2 in the air into an organic molecule inside a plant and then back to CO2 in the air.
11. The main function of cellular respiration is to produce ATP. Why do cells need ATP?
Biosynthesis
You have seen that some of the sugar molecules produced by photosynthesis are used for cellular respiration. Other sugar molecules produced by photosynthesis are used for biosynthesis. Biosynthesis produces all the different molecules that make up an organism. For example, multiple glucose molecules are combined to produce the polymer cellulose, a very important molecule in plant cell walls.
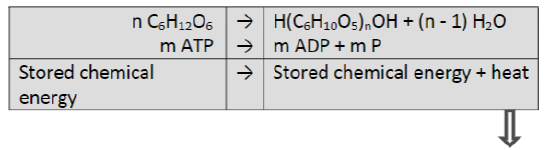
12. Explain how a carbon atom in a CO2 molecule in the air can become part of a cellulose molecule in a plant.
13. Suppose that a cow eats a plant and digests the plant’s cellulose molecules to glucose molecules. These glucose molecules are used by the cow’s cells for cellular respiration or for biosynthesis. Explain how a carbon atom in a CO2 molecule in the air can become part of an organic molecule in a cow.
The following general principles apply to photosynthesis, cellular respiration, biosynthesis, and all other biological processes.
- The atoms in molecules can be rearranged into other molecules, but atoms cannot be created or destroyed.
- Energy is neither created nor destroyed by biological processes.
- Energy can be transformed from one type to another (e.g. the energy in sunlight can be transformed into chemical energy in sugar molecules).
- All types of energy transformation are inefficient, so some of the input energy is transformed to heat energy.
14a. Explain how photosynthesis illustrates the first of these general principles.
14b. Explain how photosynthesis illustrates the last two general principles.
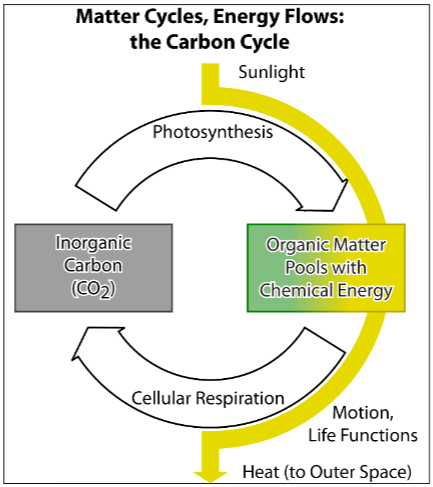
IV. Carbon Cycle and Energy Flow
In this section, you will use your understanding of food webs, photosynthesis, cellular respiration and biosynthesis to analyze how carbon atoms and energy move in ecosystems. The figure below shows how these processes result in a carbon cycle. Notice how carbon atoms cycle between CO2 in the air and organic molecules in living organisms or dead organic matter.
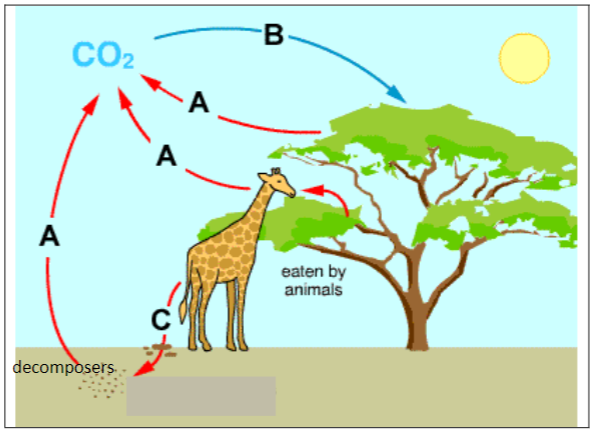
15a. After CO2 enters a plant (B arrow), how do the carbon atoms in CO2 become carbon atoms in organic molecules in the plant?
15b. Before CO2 is released into the air (A arrows), how do the carbon atoms in organic molecules become carbon atoms in CO2?
15c. C arrows show defecation and death. Add another C arrow to show plants dying and becoming available to decomposers.
16a. Explain why this carbon cycle diagram does not have a B arrow that shows carbon atoms going from CO2 molecules in the air directly to the giraffe.
16b. Explain why there is no arrow that shows carbon atoms going from the soil to the tree.
16c. Use sentences or a labeled diagram to explain how a carbon atom in a giraffe could eventually end up as a carbon atom in a tree.
Organic molecules contain both carbon atoms and chemical energy, so carbon atoms and energy move together when a consumer eats organic molecules. However, carbon atoms and energy do not always move together. For example, carbon atoms cycle in ecosystems, but energy does not.
17. Use the charts below to show the carbon cycle. Begin by indicating which chart shows cellular respiration and which chart shows photosynthesis. Next, draw an arrow to connect the organic molecule produced by photosynthesis to the organic molecule used in cellular respiration. To complete the carbon cycle, draw an arrow from the CO2 produced by cellular respiration and released into the air to the CO2 used in photosynthesis.
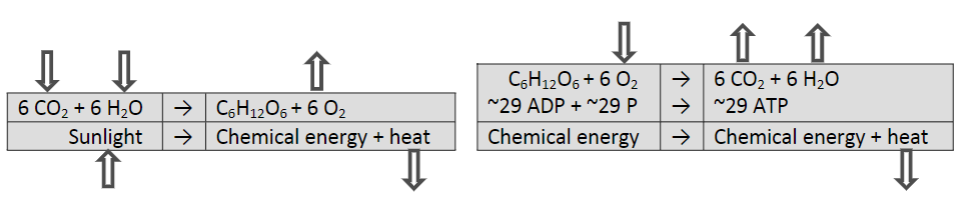
Notice that energy cannot cycle in the same way that carbon cycles. All energy transformations are inefficient, so some of the input energy is transformed to heat, and heat cannot be used as the input energy for photosynthesis.
This diagram summarizes how:
- Carbon atoms cycle from CO2 in the air → organic molecules in organisms → CO2 in the air.
- Energy flows from sunlight → chemical energy in organic molecules → heat energy which is radiated out to space.
18a. Show how energy moves through the ecosystem summarized in the chart below. Include arrows that show:
- The inflow of energy in the form of sunlight (Label this arrow S.)
- Chemical energy moving between organisms when one organism consumes energy-containing organic molecules from another organism or from dead organic matter (Label these four arrows C-C.)
- Chemical energy moving from living organisms to dead organic matter when an organism dies (Label these four arrows C-D.)
- The releases of heat from all types of living organisms (This occurs because, in all of the energy transformations required for the processes of life, some of the input energy is transformed to heat. This heat is ultimately radiated from the earth out into space.) (Label these four arrows H.)
18b. Use an asterisk (*) to mark the arrow that shows energy entering the ecosystem.
18c. Circle each arrow that indicates energy leaving the ecosystem.
19. The earth receives substantial energy from the sun, but the earth does not receive any significant inflow of new atoms. Explain why:
"Ecosystems with living organisms could not exist without a continuous inflow of new energy, but ecosystems with living organisms can exist without a continuous inflow of new carbon atoms."
V. Trophic Pyramids
20. The average American consumes almost 2000 pounds of food each year. Obviously, we do not gain 2000 pounds of weight each year! What happened to all the weight of the food we ate? Where did the atoms in the food molecules go?
21. The biomass of an organism is the mass of the organic molecules in the organism. Scientists have estimated the rate of production of biomass at each trophic level in a forest in New Hampshire. Use the information in the left column of the table to calculate the rate of production of biomass at each trophic level.
| Trophic Level | Rate of Production of Biomass |
| Producers | 1000 g/m²/year |
| Primary Consumers and Decomposers (produce only 20% as much biomass as producers) | ______ g/m²/year |
| Secondary Consumers (produce only 15% as much biomass as primary consumers and decomposers) | ______ g/m²/year |
| Tertiary Consumers (produce only 10% as much biomass as secondary consumers) | ______ g/m²/year |
22. Why is the rate of production of biomass for primary consumers and decomposers so much smaller than the rate of production of biomass for producers? What happened to the 80% of producer biomass that was not converted to biomass in primary consumers and decomposers?
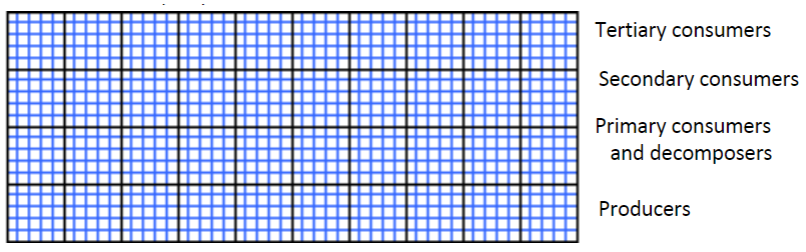
23. In the graph below, each large square represents 100 g/m²/year of biomass production and each small square represents 4 g/m²/year. In the bottom row of the graph, fill in the appropriate number of squares to represent 1000 g/m²/year of biomass production.
For each of the other three trophic levels, draw a bar that fills in the appropriate number of squares to represent the rate of biomass production shown in the above table. For each trophic level, your bar should extend the full height of the row for that trophic level; thus, all of the bars should be equally tall, but different widths.
The information in the graph you just made is often displayed in a trophic pyramid like this one below.
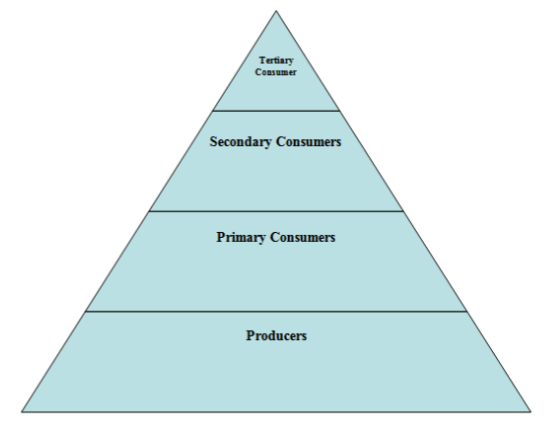
When data is not available for a specific ecosystem, scientists may use the general estimate that the rate of production of biomass at one trophic level is ~10% of the rate of production of biomass at the just lower trophic level.
24a. Use this general estimate to label each level in this trophic pyramid with the appropriate percent, beginning with 100% as the rate of production of biomass for producers.
24b. If the producers in this ecosystem produce 1000 g of biomass each day, how many grams of biomass will the tertiary consumers produce each day?
The trophic pyramids we have considered represent the relative rates of production of biomass. Similar trophic pyramids can show the relative numbers of organisms at each trophic level.
25. One of the following sentences is true – which one is it?
_____ There are thousands of elk and bison in Yellowstone National Park, but only hundreds of wolves and coyotes.
_____ There are thousands of wolves and coyotes in Yellowstone National Park, but only hundreds of elk and bison.
How do you know that the other statement is false?
26. Erin and Pat each had lunch with a similar amount of biomass. Erin had a hamburger and Pat had a baked potato. Which of the following is a reasonable estimate of the amount of land required to produce Erin’s hamburger compared to the amount of land required to produce Pat’s baked potato? (Hint: Think about the trophic levels of cows and potatoes.)
a. 1% as much land to produce Erin’s hamburger
b. 10% as much land to produce Erin’s hamburger
c. the same amount of land to produce the hamburger and the baked potato
d. 10 times as much land to produce Erin’s hamburger
e. 100 times as much land to produce Erin’s hamburger
Explain the reasoning that supports your answer.