
3.1: Yeast Protocol
- Page ID
- 25190

Alcoholic Fermentation in Yeast – A Bioengineering Design Challenge
Alcoholic fermentation is the main process that yeast cells use to produce ATP. ATP molecules provide energy in a form that cells can use for cellular processes such as pumping ions into or out of the cell and synthesizing needed molecules.
Yeasts are single-cell fungi. People use yeast to make bread, wine, and beer. For your experiment, you will use the little brown grains of yeast you can buy if you want to make bread.
During alcoholic fermentation:
- The sugar glucose is broken down to smaller molecules. Specifically, glucose (C6H12O6) is broken down to alcohol ethanol (C2H6O) and carbon dioxide (CO2).
- As a glucose molecule is broken down, some of the energy stored in the chemical bonds of glucose is transferred to energy stored in the chemical bonds of ATP molecules.
The process of alcoholic fermentation is summarized in these chemical equations.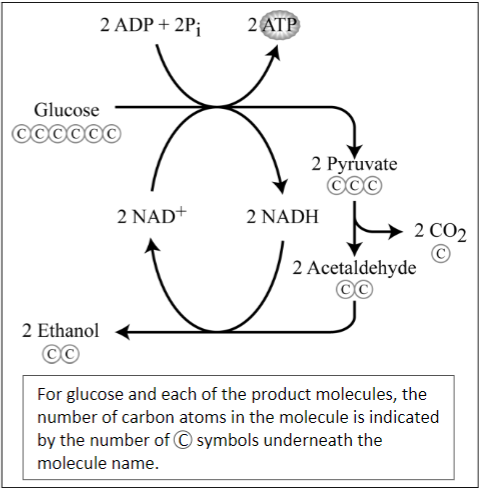
C6H12O6 ⇒ 2C2H6O + 2CO2
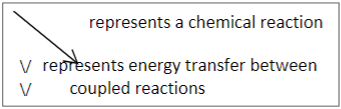
\/
\/
2 ADP + 2 Pi ⇒ 2 ATP
1. For the first chemical equation, label each chemical formula with the name of the molecule.
Alcoholic fermentation is a complex process that includes twelve different chemical reactions. The diagram on the right shows a few of these reactions.
2. In the equations on the left and in the diagram on the right:
- Underline the 6-carbon glucose molecule that is broken down to smaller molecules during alcoholic fermentation.
- Use checkmarks (ü) to indicate the ethanol and carbon dioxide molecules produced by the alcoholic fermentation of glucose.
- Circle the ADP and Pi that are combined to make ATP.
- Use an asterisk to indicate the transfer of energy from chemical energy stored in the bonds of a glucose molecule to chemical energy stored in the bonds of ATP molecules.
3. Each of the twelve chemical reactions in the alcoholic fermentation of glucose requires an enzyme. What are enzymes? What does it mean to say that "a chemical reaction requires an enzyme"?
In biological processes:
- Energy can be transferred between molecules (e.g. some of the stored chemical energy in glucose molecules can be transferred to stored chemical energy in ATP molecules).
- Matter can be converted to matter (i.e. the atoms in molecules can be rearranged into other molecules).
- Matter is not converted to energy, and energy is not converted to matter.
4. Complete this chart to show the energy changes and matter changes during alcoholic fermentation.
| Inputs | Alcoholic Fermentation | Outputs |
|
Type of Energy |
>>>>>>>>>> |
Type of Energy |
|
Matter (molecules) |
>>>>>>>>>> |
Matter (molecules) |
I. Testing for Alcoholic Fermentation in Yeast Cells
5. One way to test for alcoholic fermentation in yeast cells is to evaluate whether CO2 is produced by yeast cells in water with sugar vs. water without sugar. If yeast cells carry out alcoholic fermentation, would you expect CO2 to be produced by:
- Yeast cells in sugar water? yes___ no ___
- Yeast cells in plain water (without sugar)? yes___ no ___
Explain your reasoning.
CO2 can be produced by a simple chemical reaction without any living cells or enzymes and without producing ATP (e.g., baking soda and vinegar react to produce CO2). This raises the possibility that dead yeast cells in sugar water produce CO2 as a result of a simple chemical reaction without carrying out alcoholic fermentation. To evaluate this possibility, you will test for CO2 production by dead yeast cells that have been boiled so the enzymes needed for alcoholic fermentation have been denatured and cannot catalyze the chemical reactions required for alcoholic fermentation.
6. Can dead yeast cells that were boiled carry out alcoholic fermentation of sugar to produce CO2? yes___ no ___
Explain why or why not; include enzymes in your explanation.
In your experiment to test for alcoholic fermentation in yeast cells:
- Experimenter 1 will test for CO2 production by living yeast cells in plain water.
- Experimenter 2 will test for CO2 production by living yeast cells in sugar water.
- Experimenter 3 will test for CO2 production by dead yeast cells in sugar water.
- Experimenter 4 will be in charge of timing and measuring temperature.
The sugar you will use in your experiment is sucrose, the common sugar that people use for baking and cooking. Sucrose is a disaccharide that yeast cells convert to glucose for alcoholic fermentation.
When the yeast cells produce CO2, this gas is trapped in bubbles in a layer of foam. Your teacher will pass around a cup with a foam layer so you will know what it looks like.
- Use the following procedure for your experiment:
|
Experimenter 1 |
Experimenter 2 |
Experimenter 3 |
Experimenter 4 |
|
Label your cups. Add 80 mL of 35°C water. |
Label your cup. Add 80 mL of 35°C dead yeast suspension. |
||
|
Put your cups in the container for the warm water bath. Tear a piece of scrap paper into quarters; each experimenter should take a quarter-piece of paper for the next step. |
Add 35°C water to the container for the warm water bath, just to the level of the liquid in the cups. Do not add more water or the cups will tip over! Put the thermometer in the water in the bath. |
||
|
Experimenter 1: Weigh 4 g of yeast and put this on your piece of paper. |
Experimenter 2: Weigh 4 g of yeast and 0.5 g of sucrose and put these on your piece of paper. |
Experimenter 3: Weigh 0.5 g of sucrose and put this on your piece of paper. |
When the weighing is nearly completed, measure the temperature of the bath. Record this starting temperature in question 7 on the next page. |
|
Bend your paper and pour the yeast and/or sucrose into your cup. Stir vigorously with a plastic spoon; smash any clumps of yeast and if necessary use your second spoon to scrape off any yeast that is stuck to the first spoon. |
Time 1 minute of stirring for Experimenters 1-3. |
||
|
Make observations and record what you observe in the second and third columns of the table in question 7 on the next page. Do not bump the cups! |
Time 10 minutes. At 8 minutes, measure and record the ending temperature of the warm water bath. At 9 minutes give a warning, and then at 10 minutes announce that it is time to measure the depth of the foam layer in the cups. |
||
|
At the end of 10 minutes, measure the depth of the foam layer at the edge of the cup and record your results in the last column in the table in question 7. If the foam layer is not even, measure the depth at the thinnest and thickest points and record both measurements and the average. |
|||
|
Empty and clean the cups and bath. Clean up your workspace. |
Report the depth of the foam layer in each cup and the starting and ending temperatures to your teacher. |
||
7. Record your observations in this table.
Starting temperature _______° C Ending temperature _______° C
|
Any bubbles right at the beginning? |
Observations 1-9 min. |
Depth of Foam Layer (mm) at 10 min. |
|
|
Living yeast in plain water (1) |
|||
|
Living yeast in sugar water (2) |
|||
|
Dead yeast in sugar water (3) |
8. Compare your results in question 7 with your predictions in questions 5 and 6. Do your results support the conclusion that yeast can carry out alcoholic fermentation? Explain your reasoning.
9a. Your teacher will provide the results for all the student groups in your class. Do the class results support your conclusions in question 8? If not, briefly summarize your conclusions based on the class results.
9b. Were the results similar for all the cups with living yeast in sugar water? If not, what could be the reasons for any differences in results?
10. If you were going to repeat your experiment, how could you improve your methods to get more reliable and valid results?
II. Bioengineering Design Challenge.
When bakers make bread, they include flour with the yeast, sugar, and water. The gluten protein in the flour gives elasticity to the dough and traps the CO2 bubbles produced by the yeast so the bread dough rises and the bread becomes fluffy. The fluffiness of the bread can be influenced by the relative amounts of yeast, sugar, water and flour, as well as other ingredients in the dough. The fluffiness of the bread can also be influenced by the temperature of the dough as it rises and how long the dough rises.
Design Challenge
Jim Baker wants to make his bread as fluffy as possible without spending too much time waiting for the dough to rise. He has asked your class to find the amount of sucrose and temperature that produces the most CO2 in 10 minutes. He does not want his bread to be too sweet, so he doesn't want to use any more sucrose than needed for maximum CO2 production. To maintain good flavor and texture of the bread, he wants to keep the amount of yeast the same as in your experiment in Part I.
Scientific Background
CO2 is produced by alcoholic fermentation, which includes multiple chemical reactions, each catalyzed by a different enzyme. Fortunately, you do not need to think about all of these chemical reactions and enzymes to predict the effects on CO2 production of changes in the amount of sucrose or changes in temperature; you can get sufficiently accurate predictions by thinking about the expected effect for a single reaction catalyzed by a single enzyme.
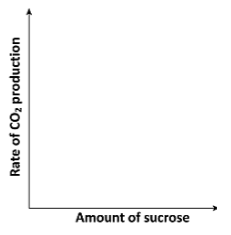
11a. What happens to the rate of a chemical reaction catalyzed by an enzyme when the concentration of substrate increases? Give molecular explanations for the relationships between substrate concentration and rate of reaction. In the graph, draw a curve to show the expected change in the rate of CO2 production as the number of sucrose increases.
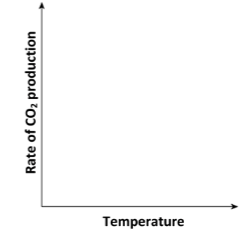
11b. What happens to the rate of a chemical reaction catalyzed by an enzyme when the temperature increases? Give molecular explanations for the relationships between temperature and rate of reaction. In the graph, draw a curve to show the expected change in the rate of CO2 production as the temperature increases.
Proposing and Testing Your Design Solution
12. Reread the Design Challenge above and list here the criteria for a good Design Solution for this Design Challenge.
13a. Think about the best Design Solution for this Design Challenge. Based on your answers to questions 11 and 12 and the experiment in Part I, how much sucrose do you think will give the best Design Solution? What range of grams of sucrose in 80 mL H2O do you think should be tested to identify the best Design Solution? Explain your reasoning.
13b. What range of temperatures do you think should be tested to identify the best Design Solution? Explain your reasoning.
14. Based on your answers to question 13, what combinations of sucrose concentrations and temperatures should be tested to identify the best Design Solution?
Your teacher will lead a discussion of the proposed experiments and develop a Class Investigation Plan. Due to practical constraints, each student group will test three different amounts of sucrose at one temperature and different groups will test at different temperatures. Record the assigned temperature and the assigned amounts of sucrose for your group in question 15.
- Use the following procedure for your experiment.
|
Experimenters 1-3 |
Experimenter 4 |
|
Label your cups. Add 80 mL of water at your assigned temperature. Put your cups in the container for the bath. Weigh 4 g of yeast and your assigned amount of sucrose onto a quarter-sheet of scrap paper. |
Add water at the assigned temperature to the container for the bath, up to the level of the liquid in the cups. Put in the thermometer. When the weighing is nearly completed, measure and record the starting temperature of the bath in question 15. |
|
Bend your paper and pour the yeast and sucrose into your cup. Stir vigorously with a plastic spoon; smash any clumps of yeast; if necessary use your second spoon to scrape yeast off the first spoon. |
Time 1 minute of stirring for Experimenters 1-3.
|
|
Do not bump the cups! At the end of 10 minutes, measure the depth of the foam layer and record your results in question 15. Measure the depth of the foam layer at the edge of the cup. If the foam layer is not even, measure the depth at the thinnest and thickest points and calculate the average. |
Time 10 minutes. At 8 minutes, measure and record the temperature of the warm water bath. At 9 minutes give a warning, and then at 10 minutes announce that it is time to measure the depth of the foam layer in the cups. |
|
Clean up. |
Report your results to your teacher. |
15. Assigned Temperature _____° C Starting Temperature _____° C Ending Temperature _____° C
|
Cup 1 |
Cup 2 |
Cup 3 |
|
|
Amount of Sucrose (grams in 80 mL of water) |
|||
|
Depth of Foam Layer (mm) at 10 minutes |
16. Your teacher will provide the information to fill out as many of the columns as possible in this table. (Each column gives the results from one student group.)
|
Amount of Sucrose (grams in 80 mL of water) |
Depth of Foam Layer (mm) |
||||||||
|
Lowest Assigned Temperature (______°C) |
Middle Assigned Temperature (______°C) |
Highest Assigned Temperature (______°C) |
|||||||
|
Test 1 |
Test 2 |
Test 3 |
Test 1 |
Test 2 |
Test 3 |
Test 1 |
Test 2 |
Test 3 |
|
|
Lowest amount (_______ grams) |
|||||||||
|
Medium amount (_______ grams) |
|||||||||
|
Highest amount (_______ grams) |
|||||||||
|
Starting temperature |
|||||||||
|
Ending temperature |
|||||||||
17. Graph the results for the depth of the foam layer vs. the amount of sucrose at each temperature. Label the axes and provide a key that distinguishes between the results for tests 1, 2 and 3 in each graph.
|
Lowest Assigned Temperature |
Middle Assigned Temperature |
Highest Assigned Temperature |
|
|
|
|


18a. Interpret the results shown in these graphs. What effects did the amount of sucrose have on the amount of CO2 produced? Were the effects of the amount of sucrose consistent at different temperatures?
18b. Were the effects of the amount of sucrose consistent for tests 1-3 at each assigned temperature? If not, what might account for any observed differences?
18c. Are the observed relationships between amount of sucrose and amount of CO2 produced compatible with your predictions in question 11a? If not, what scientific explanation could account for the observed results?
19. Graph the depth of the foam layer vs. the starting temperature for each amount of sucrose. Label the axes and provide a key that distinguishes between the results for tests 1, 2 and 3 in each graph.
|
Lowest Assigned Temperature |
Middle Assigned Temperature |
Highest Assigned Temperature |
|
|
|
|


20a. What effects did temperature have on the amount of CO2 produced? Were the effects of temperature consistent for different amounts of sucrose?
20b. Were the effects of temperature consistent for tests 1-3 at each sucrose level? If not, what might account for any observed differences?
20c. Are the observed relationships between temperature and amount of CO2 produced compatible with your predictions in question 11b? If not, what scientific explanation could account for the observed results?
21. Summarize your conclusions concerning the optimum Design Solution. What advice would you give Jim Baker concerning the optimum amount of sucrose and temperature to maximize CO2 production in 10 minutes, but with no more sucrose than needed? Explain how your recommended Design Solution is supported by the experimental results. Describe any uncertainty you have about your recommendations.
Improving Your Design Solution
22a. What additional information could help you to better identify the amount of sucrose and temperature that would give an optimum Design Solution? Explain your reasoning.
22b. Describe the experiments that you think would be most important to do next in order to better identify the optimum amount of sucrose and temperature.
Your teacher will lead a class discussion of the proposed experiments. Then, your teacher will assign each group specific experiments from a Class Investigation Plan.
23. Make a data table, carry out your experiment, record your results, and report your results to your teacher.
24. Graph the data from all the student groups.
|
|
|
|


|
|
|
|


25. Do these results support your proposed design solution in question 21? What different or additional conclusions are supported by these new results?
26. On a separate sheet of paper prepare a report for Jim Baker. Include the following:
- Describe your recommended Design Solution. Relate your Design Solution to the criteria in the Design Challenge and the evidence that supports your recommendations. Describe any uncertainty you have about your recommendations.
- Would you advise continued testing with the same procedures or would you advise Jim Baker to begin testing with bread dough? What are the relative advantages and disadvantages of these two ways of testing different possible Design Solutions?