
1.1: Chemical Equilibrium Powerpoint
- Page ID
- 25080
Prepared for SSAC by Cheryl Coolidge, Colby-Sawyer College, New London NH
What are the Characteristics of an Equilibrium Reaction?
Many important biological and ecological processes follow the equilibrium model. Until now, we have assumed that if stoichiometric amounts of all reactants are present, a chemical reaction will “go to completion”. How and why does the equilibrium model differ?
Quantitative Concepts and Skills
- XY Scatter graphs
- Rate
- Percent change
- Exponential decay
- Geometric progressions
- Ratio (Homework)
Overview
The amount of product formed in a chemical reaction depends not only on the amount of reactants present but also on the rate of conversion of reactants to products (the forward reaction) and the rate of conversion of products to reactants (the reverse reaction).
- Introduce the concept of rate and percent change and introduce you to the use of spreadsheets to efficiently perform calculations.
- Start with a hypothetical reaction that follows the model we have used so far in class: a reaction will go to completion when stoichiometrically equivalent amounts of reactants are present.
- Require you to analyze a more complex “equilibrium” reaction.
- Contain your homework assignment.
Problem
You are a chemist at a plant that manufactures product B, a life-saving drug. Your company has a shortage of this drug, so you need to perform several syntheses each day to meet your new quota. However, you would like to go home on time tonight because you have evening plans. You can go home when 95% of your reactant molecules, A, have been converted to product B via A → B.
If you start a production run at 4:30 pm, what time can you leave work?
Getting Ready: Rate and Percent Change
Rate is the change over time. Let’s examine the rate of change in a rabbit population. If you start with a mating pair of rabbits on day 1 and have 6 rabbits on day 2, the rate is expressed as a ratio of change in rabbits (6-2) divided by change in time (day 2 – day 1) or 4 rabbits/1day. In a rate, time is always in the denominator. The mathematical formula that describes this is \(\frac{Δy}{Δt}\), where Δ means change.
Rates can also be expressed as a percent (%) change. In the example above, the % change would be expressed as:
\[\frac{\frac{change\;in\;value}{initial\;value}}{change\;in\;time}*100\]
which is 200%. These % changes can be either increases or decreases.
Exercise 1
What is the % change if you start with 1000 molecules at time zero (the initial time), and have 750 molecules one minute later?
How do you use the % change you calculated above to determine how many molecules you have after an additional minute has elapsed? (HINT: your initial value is now 750).
- Answer
-
If you begin with 1000 molecules and end with 750 molecules a minute later, you are left with 75% of the molecules you originally had. Therefore, the one-minute reaction reduced the number of molecules by 25%.
If you want to know how many molecules you are left with after an additional minute, simply reduce 750 by 25%. Simply calculate the value of 25% of 750, and subtract this number from 750.
Hint: unless you know how to use the percent key on your calculator, you should convert your percentages to decimals.750 molecules x 0.25 = 187.5 molecules
750 molecules – 187.5 molecules = 562.5 molecules
Getting Ready: Using a Spreadsheet
Data Input
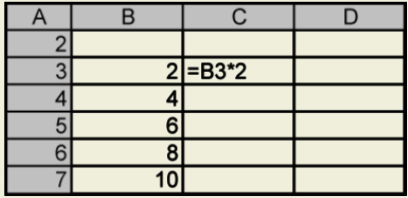
A spreadsheet is an easy way to perform calculations. The numbers in Cells B3 through B7 can just be typed in. As an alternative, Excel can do this for you. Type in the first three values then highlight them (B3 through B5) and place the cursor at the bottom right of the last highlighted cell until you see a small cross. Hold down the left mouse button, drag the pattern through as many cells as you want, and release the button to fill the cells. Excel recognizes the pattern from the first three cells and copies it.
If you want to multiply each of these numbers by 2, you can create a recurrence formula to perform this task. In Cell C3, type the formula as shown. (All formulas begin with =.)
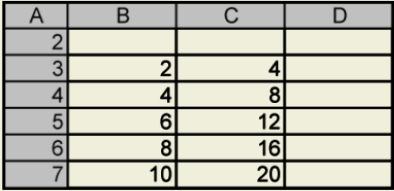
You can copy the formula by clicking on Cell C3 and placing the cursor on the bottom right-hand corner of the cell until you see a small cross. Then drag the cursor down the column, and your results will be displayed.
Calculation Input
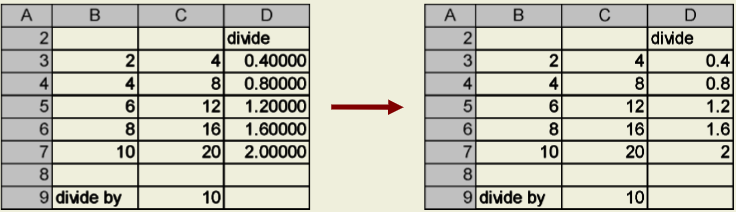
Suppose you always want to divide the numbers in Column C by the same number – let’s use 10 for an example. You could create a formula for the first cell in Column C, =C3/10, and drag the formula down Column D as described in Slide 5. Suppose, though, that you might want to divide by a value in a particular cell . So that you don’t have to change the formula for each value in Column C, you can reference the cell (here, C9) in the formula. In your formula, you refer to this cell as an “absolute” (or “fixed”) cell whose position doesn’t change when you copy the formula. To indicate that this cell is absolute, precede both the column and the row number with a dollar sign.
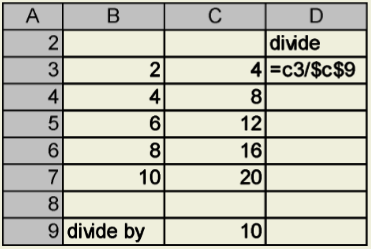
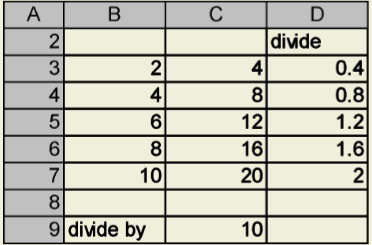
When the formula in Cell D3 is copied, the cell referenced in the numerator of the formula will adjust row by row, but the cell referenced in the denominator remains fixed.
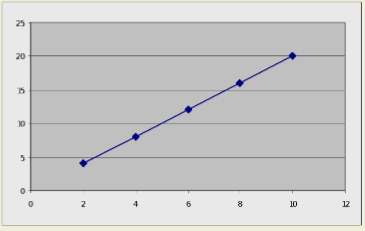
You can make a graph by highlighting a range of data (here, from B3 to C7) and then clicking on the chart wizard button:  Select a graph type (in this case, an X-Y scatter plot connected by a smooth line) and follow the prompts. Voila! A graph!
Number Formatting
Depending on the default settings of the version of Excel you are using, the values generated by your equations may display an unnecessary number of decimal places. To fix this, right-click on the cell or group of cells you wish to change and choose “Format Cells” from the pop- up menu. Select the “Number” tab, and choose “Number” from the “Category” list, if not already selected. In the “Decimal places” scroll box that appears on the right, type in the number of decimal places you would like to use.
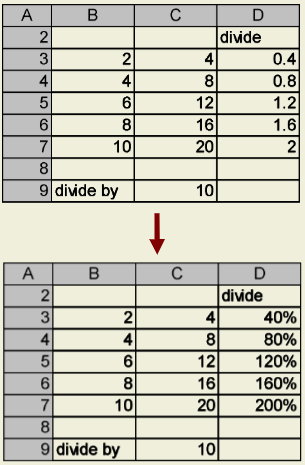
When working with percentages in Excel, it is best to treat them as decimals rather than values greater than 1 (e.g., 0.51 instead of 51%). Multiplying your decimals by 100 to obtain percents can, at times, needlessly complicate your equations and hinder Excel’s ability to understand what you’re trying to calculate. To tell Excel to display the result as a percent, simply highlight the cells with your decimals, and follow the formatting directions previously discussed. However, instead of choosing “Number” from the “Category” list, choose “Percentage”, and select the number of additional decimal places you wish to use.
Calculating “Completion” Time
What is the time course of a chemical reaction that “goes to completion”? When can you go home?
One way to answer these questions is to build a spreadsheet that lets you calculate molecules vs. time
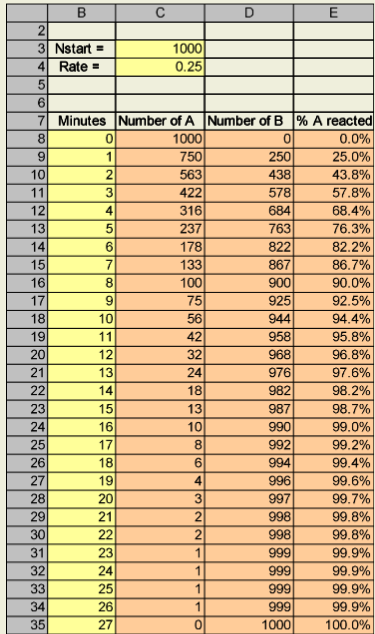
You will start with 1000 molecules of reactant A, and assume that 25% of these molecules are converted to product B in a minute via A→B. Note that the progression down column A is geometric (we will explore this again later).
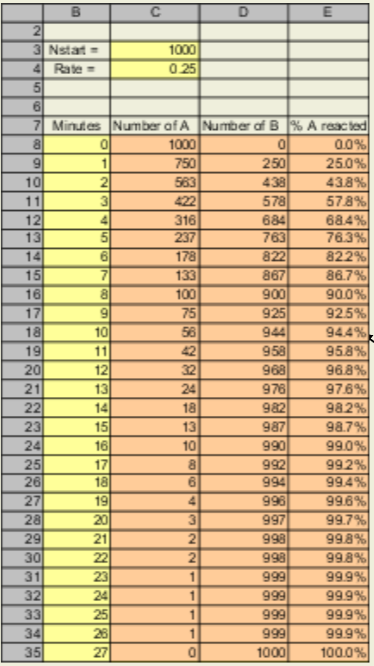
Yellow Boxes = Cells with a number in it.
Orange Boxes = Cells with a formula in it.
Recreate this spreadsheet.
Graphing Reaction Time Course
Use the XY Scatter plot option in the graph menu to duplicate this graph and select the option in which the data points are connected by smooth lines.
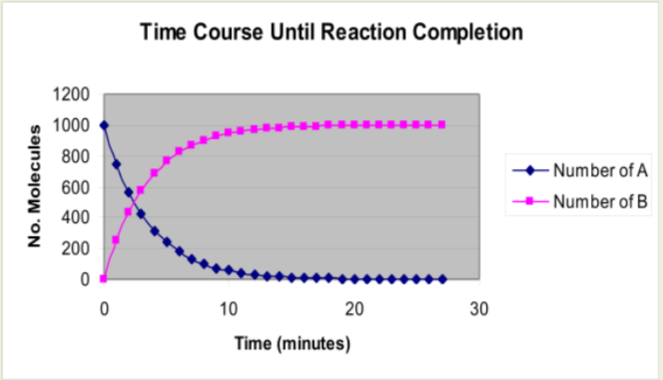
Note
Hint: You do not need Column E in the spreadsheet to create this graph.
Questions and Predictions
- How many minutes does it take before 95% of your 1000 reactant molecules have been converted to product? When can you go home?
- How long do you think it will take for 10,000 molecules of A to be 95% converted to product B? 50,000 molecules? Make a prediction and test it by changing the number of starting molecules in your spreadsheet.
- How long do you think it will take for your original 1000 molecules to be 95% converted to product if the reaction rate is decreased to 10% per minute? Increased to 50% per minute? Increased to 75% per minute? Make predictions and test them by changing the rate of conversion in your spreadsheet.
- Refer to your original graph (1000 molecules, 25% rate of conversion). Describe the appearance of the curve that depicts the number of molecules of A present over time. Do you know what this type of curve is called?
Record your answers.
Optional Activity
You can get the equation that describes the conversion of A to B by right-clicking on the curve in the graph and selecting “add trend line”. Choose the type of fit that best matches your data. In options, select “display equation on chart”.
Pulling it Together
Assume now that the reaction of A → B is readily reversible; that is, B → A as well. Suppose that 25% of the molecules of A are converted to B each minute and 10% of the molecules of B are converted back to A each minute (hence, nothing is reacted at minute 0).
Hints
- Note that “A react” in one row is the same as “Number of A” in the previous row, and “B react” is “Number of B” from the previous row.
- “Number of A” is “A react” minus “A → B”, plus “B → A”. Why?
- “Number of B” is “B react” minus “B → A”, plus “A → B”. Why?
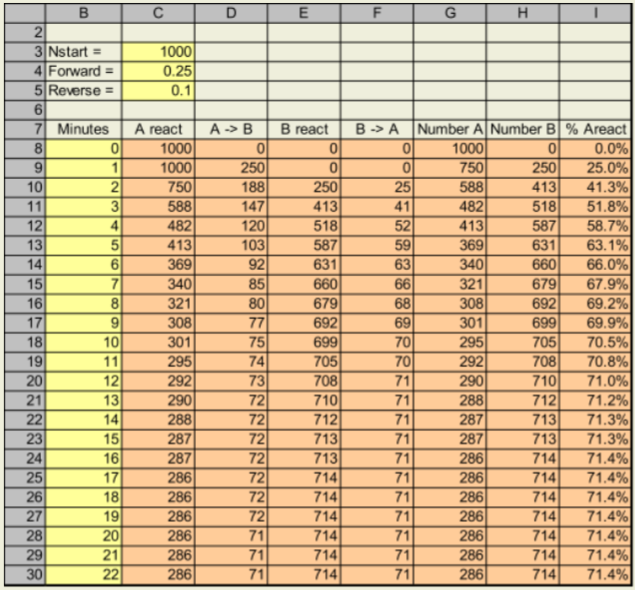
Recreate this spreadsheet, starting on a new sheet.
Graphing the Solution
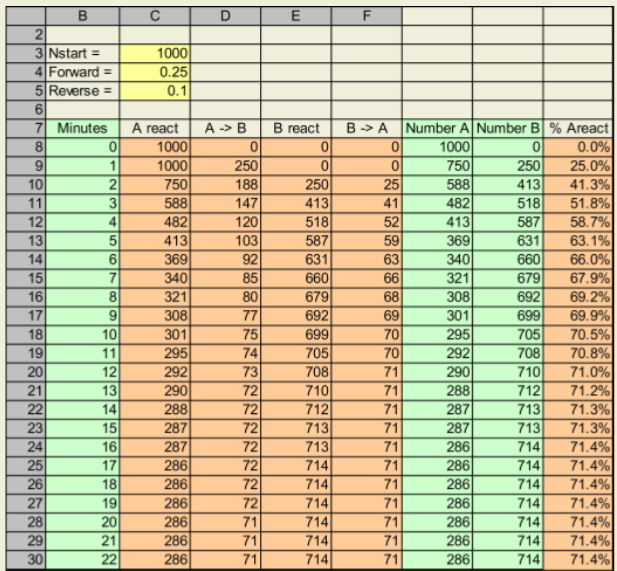
Highlight the columns indicated in green to make your graph. Click control at the top of each column and drag over it vertically to highlight the correct range. Then select the chart icon to make your graph.
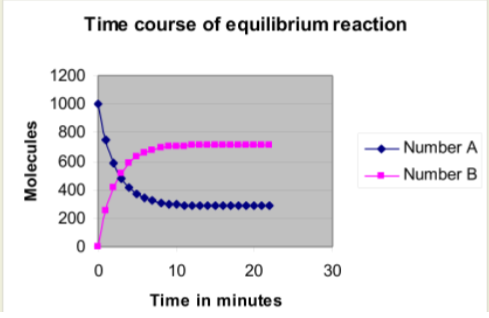
Create an XY scatter plot of the highlighted ranges.
Questions and Predictions
- Refer to the second spreadsheet you have created. What do you notice about the % of A that has reacted after 16 minutes?
- When will 95% of the molecules of A be converted to B? Remember, this is when you can go home.
- Predict what will happen to the time course if you change the number of molecules reacting to 10,000. 50,000. Test and record your predictions by making the appropriate changes in the spreadsheet.
- Predict what will happen to the time course if you change the rate of the forward reaction to 50%, keeping the rate of the reverse reaction at 10% Test and record your predictions. What do you notice about the time it takes for your reaction to stabilize? What about the % of A converted (reacted)?
- Predict the effect of changing your reverse reaction to 15% on both the time course and the % conversion, returning the rate of the forward reaction to 25%. Test and record.
- Predict the effect of setting both the forward and reverse rate to 50%. Test and record. What about both at 20%? Test and record.
Remember to record your predictions and answers.
Homework
- Compare the time course graphs you generated using both the completion reaction and the equilibrium reaction. What differences do you notice? Based on these differences, try to define what an equilibrium reaction is.
- Have a copy or window of your completion spreadsheet available for reference. In your equilibrium spreadsheet, set the forward reaction to 25%. Start with a reverse reaction rate of 2.5%. Now continue to decrease the rate of the reverse reaction and compare the results of your equilibrium spreadsheet to the completion spreadsheet. At what reverse rate does the equilibrium spreadsheet become like the completion spreadsheet? Generally, then, when does an equilibrium reaction behave like a reaction that goes to completion? Try other ratios of forward to reverse reactions to confirm your understanding. (In reality, all reactions are equilibrium reactions.)
- Use the equilibrium spreadsheet to answer the following questions.
Part A:
Set the rate of both the forward and reverse reactions to 50%. Make sure that the reaction has stabilized, with no changes in molecules formed at the end of the time course. If the reaction has not stabilized, extend the spreadsheet by copying and dragging the last row in your spreadsheet to create several additional rows. Create two new formulas in your spreadsheet, one to calculate the ratio of molecules of B to molecules of A (Number B /Number A ), and one to calculate the ratio of the forward to the reverse reaction (forward/reverse). Do you notice a relationship?
Part B:
Repeat this exercise using the following ratios:
| Forward | Reverse |
| 90% | 10% |
| 10% | 90% |
| 75% | 25% |
| 25% | 75% |