
4.3: Lab Assignment 4- Population Monitoring and Field Sampling
- Page ID
- 25937

Name: ________________________________
Sampling for pests only provides useful estimates of population size when two important aspects are addressed: accuracy and precision. Accuracy is how close your sampling is able to reflect actual population size. Precision is when the data collected in each sampling event are relatively equal, with little or no variation. When precision is poor, more samples are required to generate more accurate data.
Determining sample size: Rarefaction Curves
With each sampling event, we gain more information about our ecosystem. In the example below, you’ll be filling in Table 1 with the values given using Appendix A, which is a data set built on number of insects recorded during scouting.
| Sample No. | # Species in Sample | Total NEW Species | TOTAL SPECIES (Cumulative) |
| 1 | |||
| 2 | |||
| 3 | |||
| 4 | |||
| 5 |
Table 1.
Using your data, extrapolate the results to reflect a hypothetical organic garden that when considered as a whole, is comprised of 150 plots of the same size.
For example:
- If there were a total of 40 individuals sampled, and 10 are pest species A, then species A is 25% of the population (10/40 = .25). This percentage is the relative abundance.
- 25% of 150 (150×25) is 37.5, so we assume that in the entire production area, there should be about 38 (rounding to the whole insect) species A individuals.
| Species No. | Species Name | Total No. Sampled (cumulative) | Relative Abundance (%) | Extrapolated Abundance (x30) |
Table 2.
Now add the data from the next 5 samples (samples 6-10), adding to your counts, in the table below.
| Sample No. | # Species in Sample | Total NEW Species (including prev. samples) | Total Cumulative Species |
| 6 | |||
| 7 | |||
| 8 | |||
| 9 | |||
| 10 |
Table 3.
With the new data, you’ll need to recalculate the relative and total abundance for each species identified over 10 sampling events.
| Species No. | Species Name | Total No. Sampled (cumulative) | Relative Abundance (%) | Extrapolated Abundance (x15) |
Table 4.
Was there a difference in the number of the species between table 1 and table 3? Is the changing number of species an indication of changing accuracy or precision?
Was there a difference in the overall relative abundances for each species? Why/Why not?
Plot your data on the graph below, showing the total number of species found as a response to the number of samples taken by highlighting the cells in the table at each data point. Because we are tracking cumulative data, connect the data points with a line of highlighted cells
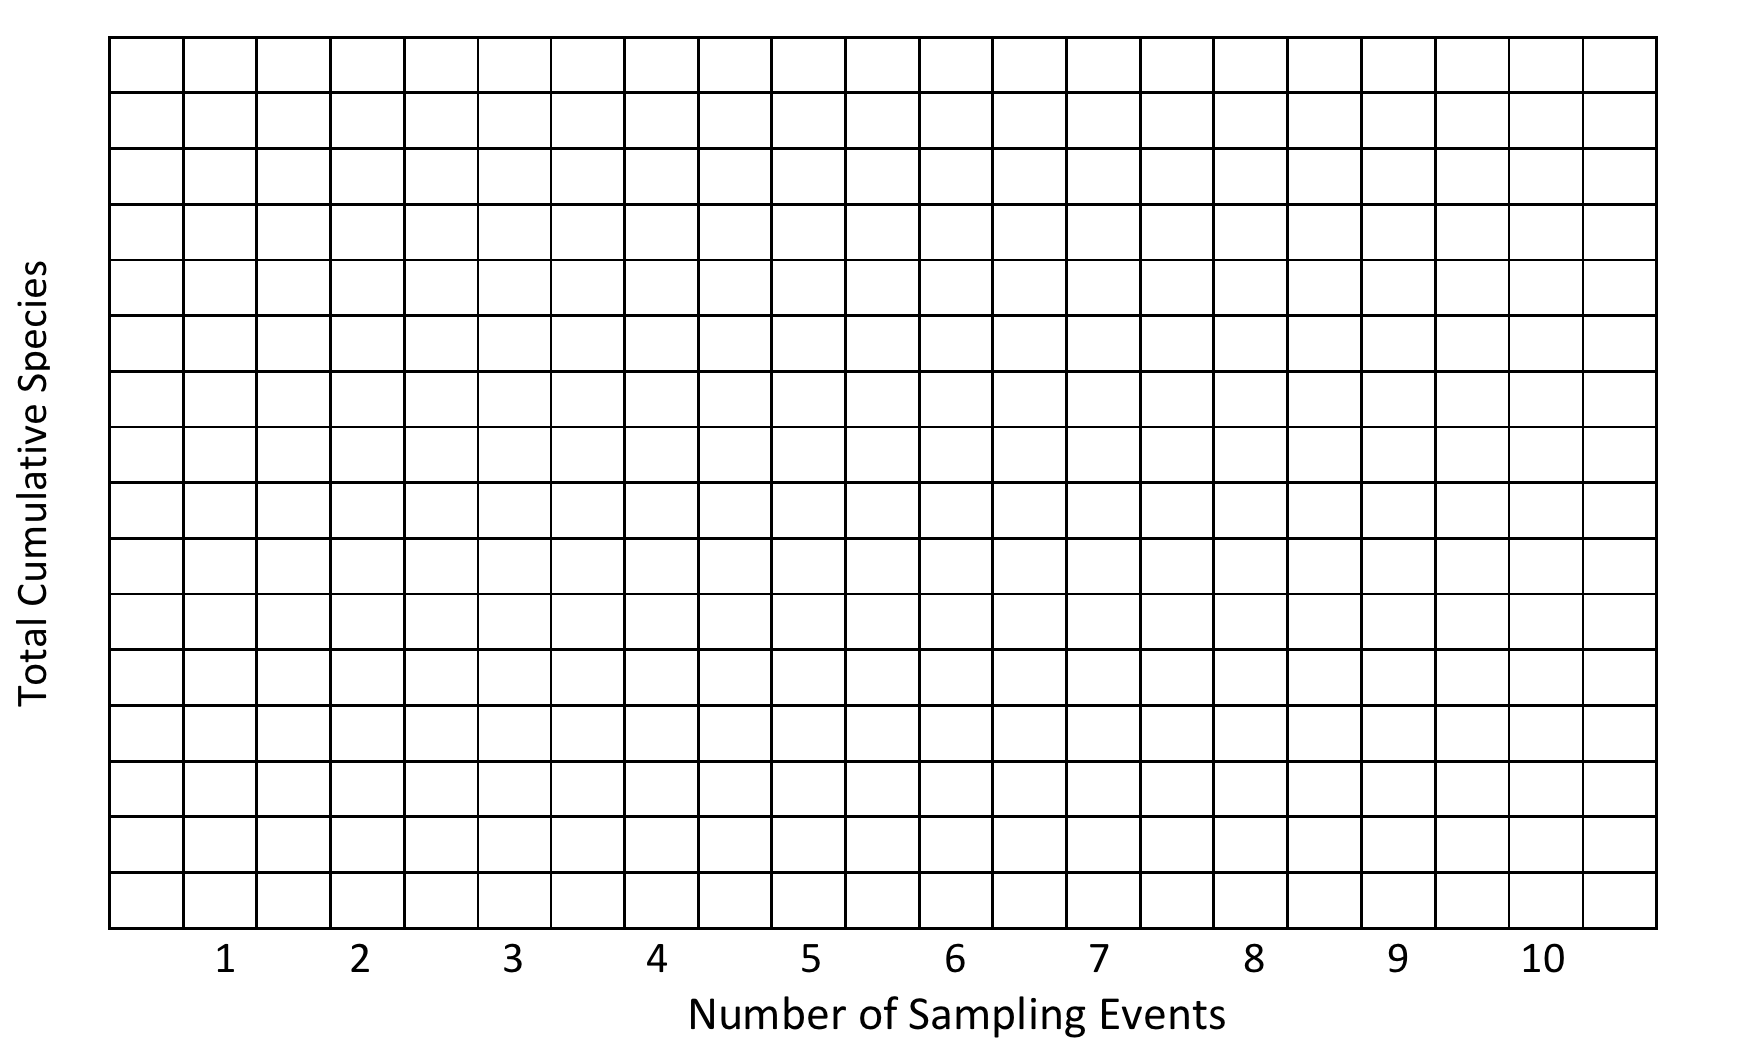
The plot you have just created above is what is known as a rarefaction curve. This helps consultants and scientists monitoring populations of organisms select the correct sampling effort (number of sampling events or number of units sampled) that will cost the least amount of resources while still gaining accurate data for estimating population sizes. This point happens when there is little NEW information gained by additional sampling. Indicate where this occurs on your graph by adding a STAR at this point.
According to the graph you made, what is the ideal number of samples that should be taken to both minimize sampling effort while gaining the most information to accurately estimate populations?
Application.
In production systems, we don’t have the actual pest population sizes to compare with our samples, thus ensuring accuracy. Instead, we rely on repeated sampling efforts and a variety of sampling techniques to get information about the pest populations present.
Next, you will use a hypothetical sampling plot where you will conduct THREE different types of samples. Each sampling method is commonly used, but each gives very different types of information. For each sampling method, assume you know nothing about the data found by the two other techniques: complete each technique one at a time, ignoring previous sampling results. Using the Practice Plot PDF (separate file), fill in the sampling card for each technique.
I. Presence/Absence Sample Card
Sample every plant in the row to fill out the table below. Only mark if the pest is present by placing an “X” in the column if the species appears.
| Species: | Species: | Species: | Species: | |
| PLANT No. | (describe) | (describe) | (describe) | (describe) |
| 1 | ||||
| 2 | ||||
| 3 | ||||
| 4 | ||||
| 5 | ||||
| 6 | ||||
| 7 | ||||
| 8 | ||||
| 9 | ||||
| 10 | ||||
| 11 | ||||
| 12 | ||||
| 13 | ||||
| 14 | ||||
| 15 | ||||
| 16 | ||||
| 17 | ||||
| 18 | ||||
| 19 | ||||
| 20 | ||||
| 21 |
With P/A sampling, the intent is to get an idea of the pests present in the system by searching every without making hourly cost of scouts increase by requiring a count of each population. When do you think this kind of sampling is the most useful and economical for growers?
II. Fixed Random Sample Card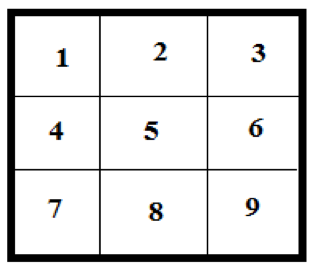
Look at your plot and mentally overlay a 3×3 grid that covers the entire plot of available plants (see diagram on the right). Determine which end of the practice plot contains units 1-3 and which has 7-9. Determine which plant is the closest to the center of each sample unit in your plot. Examine these nine plants closely and fill out the sample card below, adding a new row in each plot when there are more than one “species” of pest found.
| Grid Unit No. | Pest(s) | Description | Number | Total Cumulative |
| Example | Light Green | Light green + | 9 | 9 |
| Dark green | Large, round circle | 1 | 10 | |
| 1 | ||||
| 2 | ||||
| 3 | ||||
| 4 | ||||
| 5 | ||||
| 6 | ||||
| 7 | ||||
| 8 | ||||
| 9 |
As you experienced, this type of sampling takes more time per plant, hence the need to reduce the number of plants sampled. Think about the first part of this activity, accuracy and precision and give one benefit and one drawback of using this type of sampling compared to the simpler Presence/Absence sampling event used for the previous sample card.
III. Sequential Sampling Card
Use the same nine plants identified in Sample Type II above. Check each plant for the light green “+”; if present, that plant is added to the tally as “1”. Each positive result adds to the running tally in the vertical column titled “your tally”. This column is additive– if the first three plants are all positive for the pest, then by the 3rdplant, there should be a “3” in the tally column. If plants 1 and 2 are positive, but 3 is negative, then there will still be a “2” in the tally column at the third plant.
Example:
| Plant No. | Pest Present? | Don’t Treat | YOUR TALLY | Treat |
| 1 | Yes | — | 1 | — |
| 2 | Yes | — | 2 | — |
| 3 | No | 2 | 2 | 3 |
| 4 | Yes | 2 | 3 | 3 |
| 5 | No | 2 | 3 | 4 |
Compare your count to the “Treat” and “Don’t Treat” recommendation columns to determine if pesticide management is necessary.
| Plant No. | Pest Present? | Don’t Treat | YOUR TALLY | Treat |
| 1 | — | — | ||
| 2 | — | — | ||
| 3 | 2 | 3 | ||
| 4 | 2 | 3 | ||
| 5 | 2 | 4 | ||
| 6 | 3 | 4 | ||
| 7 | 3 | 5 | ||
| 8 | 3 | 6 | ||
| 9 | 4 | 6 | ||
| 10 | 4 | 7 |
For your nine plants, what is the recommendation for pest management?
Perform the sequential sampling a few times using different sampling patterns – one whole row, every other plant, ALL plants, etc. Did you consistently get the same pest management recommendation? Why/Why not?
What are the benefits and drawbacks of sequential sampling? When (in a production year/cycle) would this be the most useful means of sampling pests?
Wrap-Up Analysis
Insect identification is an important part of scouting for pests, especially when it comes to determining the difference between pests and similar-looking beneficial insects. However, training in identification for scouting jobs varies widely, which means there may not always be consistency in pest recognition and identification.
How do inconsistencies in identification change the precision and accuracy of each sampling type and analysis we’ve considered in this exercise?