
15.5: Energy Flow Through Ecosystems
- Page ID
- 69508

Virtually every task performed by living organisms requires energy. In general, energy is defined as the ability to do work, or to create some kind of change. Energy exists in different forms. Examples include light energy, kinetic energy, heat energy, potential energy, and chemical energy.Energy is required by most complex metabolic pathways (often in the form of adenosine triphosphate, ATP), especially those responsible for building large molecules from smaller compounds, and life itself is an energy-driven process. Living organisms would not be able to assemble macromolecules (proteins, lipids, nucleic acids, and complex carbohydrates) from their monomeric subunits without a constant energy input.
It is important to understand how organisms acquire energy and how that energy is passed from one organism to another through trophic interactions. Trophic interactions in a community can be represented by diagrams called food chains and food webs. Food webs illustrate how energy flows directionally through ecosystems, including how efficiently organisms acquire it, use it, and how much remains for use by other organisms of the food web.
How Organisms Acquire Energy in a Food Web
Energy is acquired by living things in three ways: photosynthesis, chemosynthesis, and the consumption and digestion of other living or previously living organisms by heterotrophs.
Photosynthetic and chemosynthetic organisms are both grouped into a category known as autotrophs (or producers): organisms capable of synthesizing their own food (more specifically, capable of using inorganic carbon as a carbon source). Cells run on the chemical energy found mainly in carbohydrate molecules the majority of which are produced by autotrophs. Photosynthetic autotrophs (photoautotrophs) use sunlight as an energy source, whereas chemosynthetic autotrophs (chemoautotrophs) use inorganic molecules as an energy source. Autotrophs are critical for all ecosystems. Without these organisms, energy would not be available to other living organisms and life itself would not be possible. The energy that is harnessed by autotrophs enters the communities continuously and is transferred from one organism to another.
Photoautotrophs, such as plants, algae, and photosynthetic bacteria, serve as the energy source for a majority of the world’s ecosystems. These ecosystems are often described by grazing food webs. Photoautotrophs harness the solar energy of the sun by converting it to chemical energy in the form of ATP (and NADP) (figure \(\PageIndex{1}\)). The energy stored in ATP is used to synthesize complex organic molecules, such as glucose.
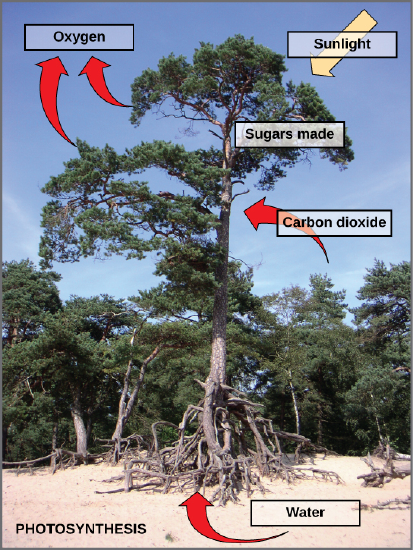
Figure \(\PageIndex{1}\): Photosynthesis uses solar energy, carbon dioxide, and water to release oxygen and to produce energy-storing sugar molecules. Image and caption by OpenStax (CC-BY). Access for free at openstax.org.
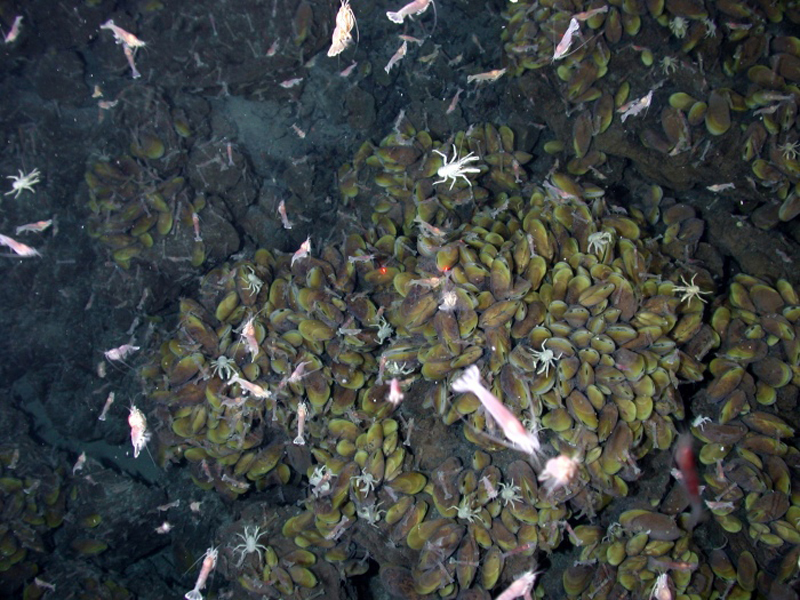
Chemoautotrophs are primarily bacteria that are found in rare ecosystems where sunlight is not available, such as in those associated with dark caves or hydrothermal vents at the bottom of the ocean (Figure \(\PageIndex{2}\)). Many chemoautotrophs in hydrothermal vents use hydrogen sulfide (H2S), which is released from the vents as a source of chemical energy. This allows chemoautotrophs to synthesize complex organic molecules, such as glucose, for their own energy and in turn supplies energy to the rest of the ecosystem.
Heterotrophs (consumers), like animals, fungi, and various microorganisms depend on producers, either directly or indirectly. For example, a deer obtains energy by eating plants (figure \(\PageIndex{3}\)). A wolf eating a deer obtains energy that originally came from the plants eaten by that deer. Using this reasoning, all food eaten by humans can be traced back to producers that carry out photosynthesis (figure \(\PageIndex{4}\)).
Figure \(\PageIndex{3}\): The energy stored in carbohydrate molecules from photosynthesis passes through the food chain. The predator that eats these deer is getting energy that originated in the photosynthetic vegetation that the deer consumed. (credit: Steve VanRiper, U.S. Fish and Wildlife Service)
Figure \(\PageIndex{4}\): Ultimately, most life forms get their energy from the sun. This flow chart shows energy from the sun being captured by producers, such as plants, through photosynthesis. The energy is transferred to the consumers of the producers, such as animals. Energy can be obtained from producers directly (herbivores eat plants) or indirectly (carnivores eat herbivores). Decomposers eventually breakdown of dead organisms, including plant and animal material, and contribute to the nutrient pool. Fungi and bacteria are decomposers, and worms are detritivores (not shown). During each energy transfer, some of the energy in the system is lost as heat.
Consumers can be classified based on whether they eat animal or plant material (figure \(\PageIndex{5}\)). Consumers that feed exclusively on animals are called carnivores. Lions, tigers, snakes, sharks, sea stars, spiders, and ladybugs are all carnivores. Herbivores are consumers that feed exclusively on plant material, and examples include deer, koalas, some bird species, crickets, and caterpillars. Herbivores can be further classified into frugivores (fruit-eaters), granivores (seed eaters), nectivores (nectar feeders), and folivores (leaf eaters). Consumers that eat both plant and animal material are considered omnivores. Humans, bears, chickens, cockroaches, and crayfish are examples of omnivores.
Figure \(\PageIndex{5}\): Carnivores like the lion (top left) eat primarily meat. The ladybug (lower left) is also a carnivore that consumes small insects called aphids. Herbivores, like the mule deer (middle) eat primarily plant material. Omnivores like the bear (top right) and crayfish (bottom right) eat both plant and animal based food. Lion by Kevin Pluck; ladybug by Jon Sullivan; mule deer by Bill Ebbesen; bear by Dave Menke; crayfish by Jon Sullivan. All from OpenStax (CC-BY). Access for free at openstax.org.
Dead producers and consumers are eaten by detritivores (which ingest dead tissues) and decomposers (which further break down these tissues into simple molecules by secreting digestive enzymes). Invertebrate animals, such as worms and millipedes, are examples of detritivores, whereas fungi and certain bacteria are examples decomposers.
Food Chains
A food chain is a linear sequence of organisms through which nutrients and energy pass as one organism eats another. Each organism in a food chain occupies a specific trophic level (energy level), its position in the food chain. The first trophic level in the food chain is the producers. The primary consumers (the herbivores that eat producers) are the second trophic level. Next are higher-level consumers. Higher-level consumers include secondary consumers (third trophic level), which are usually carnivores that eat the primary consumers, and tertiary consumers (fourth trophic level), which are carnivores that eat other carnivores. In the Lake Ontario food chain, shown in figure \(\PageIndex{6}\), the Chinook salmon is the apex consumer at the top of this food chain. Some communities have additional trophic levels (quaternary consumers, fifth order consumers, etc.). Finally, detritivores and decomposers break down dead and decaying organisms from any trophic level. There is a single path through a food chain.
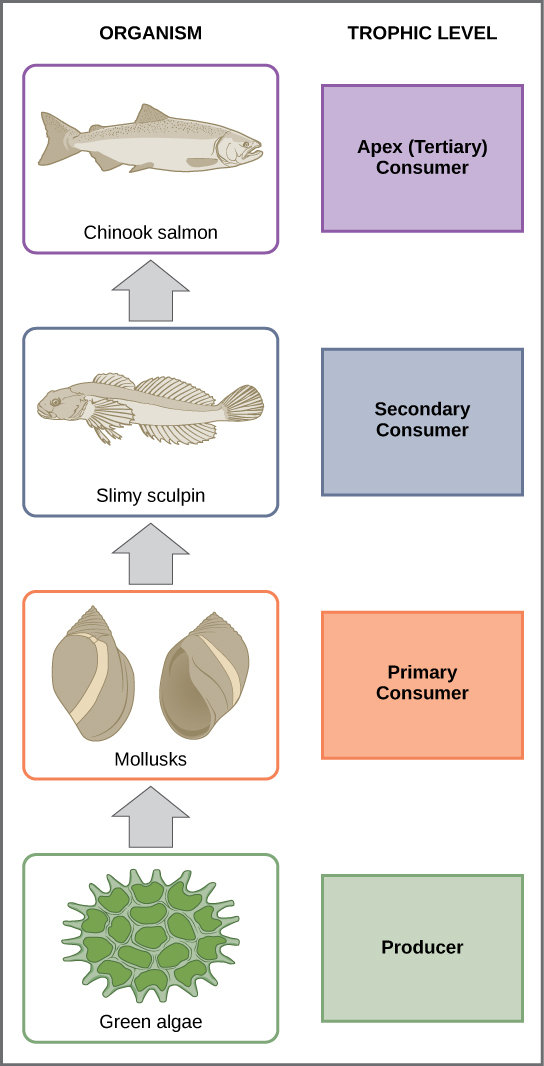
Figure \(\PageIndex{6}\): These are the trophic levels of a food chain in Lake Ontario at the United States–Canada border. Energy and nutrients flow from photosynthetic green algae (producers) at the base to the primary consumers, which are mollusks, or snails. The secondary consumers are small fish called slimy sculpin. The tertiary and apex consumer is Chinook salmon. Detritivores and decomposers are not shown. (credit: modification of work by National Oceanic and Atmospheric Administration/NOAA)
One major factor that limits the number of steps in a food chain is energy. Only about 10% of the energy in one trophic level is transferred to the next trophic level. This is because much energy is lost as heat during transfers between trophic levels or to decomposers due to the second law of thermodynamics. Thus, after four to six trophic energy transfers, the amount of energy remaining in the food chain may not be great enough to support viable populations at higher trophic levels.
Certain environmental toxins can become more concentrated as they move up the food chain, with the highest concentrations occurring in the top consumers, a process called biomagnification. Essentially, a top consumer ingests all the toxins that had previously accumulated in the bodies of the organisms at the lower trophic levels. This explains why frequently eating certain fish, like tuna or swordfish, increases your exposure to mercury, a toxic heavy metal.
Food Webs
While food chains are simple and easy to analyze, there is a one problem when using food chains to describe most communities. Even when all organisms are grouped into appropriate trophic levels, some of these organisms can feed at more than one trophic level. In addition, species feed on and are eaten by more than one species. In other words, the linear model of trophic interactions, the food chain, is a hypothetical and overly simplistic representation of community structure. A holistic model—which includes all the interactions between different species and their complex interconnected relationships with each other and with the environment—is a more accurate and descriptive model. A food web is a concept that accounts for the multiple trophic interactions between each species (figure \(\PageIndex{7-9}\)).
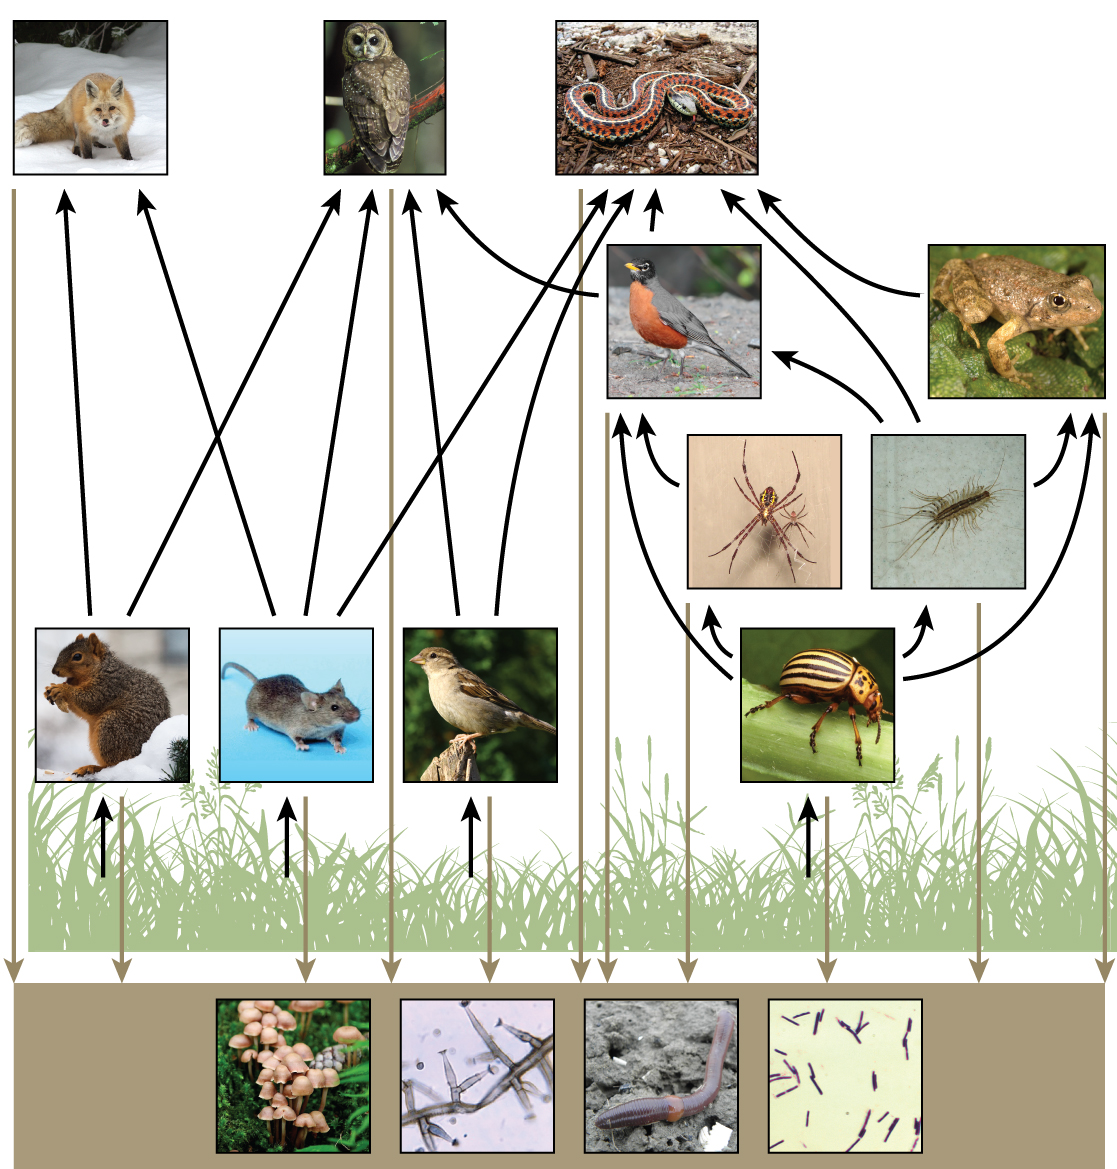
Figure \(\PageIndex{7}\): This food web shows the interactions among organisms across trophic levels. Arrows point from an organism that is consumed to the organism that consumes it and represent energy transfer. The producers (plants) capture energy from the sun. The level above the producers shows the primary consumers that eat the producers. Some examples are squirrels, mice, seed-eating birds, and beetles. Spiders and centipedes eat beetles. Robins eat beetles, spiders, and centipedes, and toads eat beetles and centipedes. Foxes eat squirrels and mice; owls eat squirrels, mice, seed-eating birds, and robins; and snakes eat mice, seed-eating birds, robins, centipedes, and toads. Some consumers are in between trophic levels because they eat a combination of primary, secondary, and/or tertiary consumers. All the producers and consumers eventually become nourishment for the decomposers (mushrooms, mold, and bacteria) and detritivores (earthworms) in the soil, which are depicted at the bottom of the illustration. (credit “fox”: modification of work by Kevin Bacher, NPS; credit “owl”: modification of work by John and Karen Hollingsworth, USFWS; credit “snake”: modification of work by Steve Jurvetson; credit “robin”: modification of work by Alan Vernon; credit “frog”: modification of work by Alessandro Catenazzi; credit “spider”: modification of work by “Sanba38″/Wikimedia Commons; credit “centipede”: modification of work by “Bauerph”/Wikimedia Commons; credit “squirrel”: modification of work by Dawn Huczek; credit “mouse”: modification of work by NIGMS, NIH; credit “sparrow”: modification of work by David Friel; credit “beetle”: modification of work by Scott Bauer, USDA Agricultural Research Service; credit “mushrooms”: modification of work by Chris Wee; credit “mold”: modification of work by Dr. Lucille Georg, CDC; credit “earthworm”: modification of work by Rob Hille; credit “bacteria”: modification of work by Don Stalons, CDC)
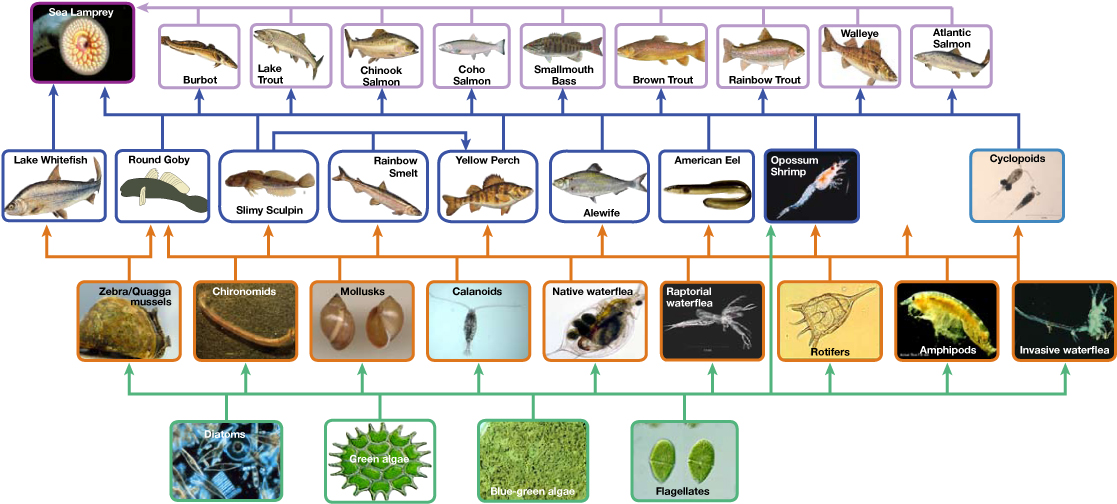
Figure \(\PageIndex{8}\): Food web: This food web shows the interactions between organisms across trophic levels in the Lake Ontario ecosystem. Primary producers are outlined in green, primary consumers in orange, secondary consumers in blue, and tertiary (apex) consumers in purple. Arrows point from an organism that is consumed to the organism that consumes it. Notice how some lines point to more than one trophic level. For example, the opossum shrimp eats both primary producers and primary consumers. (credit: NOAA, GLERL)
The trophic level of each species in a food web is not necessarily a whole number. In figure \(\PageIndex{9}\), phytoplankton are the primary producers (trophic level 1). Zooplankton only feed on phytoplankton, making them primary consumers (trophic level 2). Determining the trophic level of the other species is more complex. For example, krill eat both phytoplankton and zooplankton. If krill only ate phytoplankton they would primary consumers (trophic level 2). If they ate only zooplankton, they would be secondary consumers (trophic level 3). Since, krill consume both, their trophic level is 2.5.
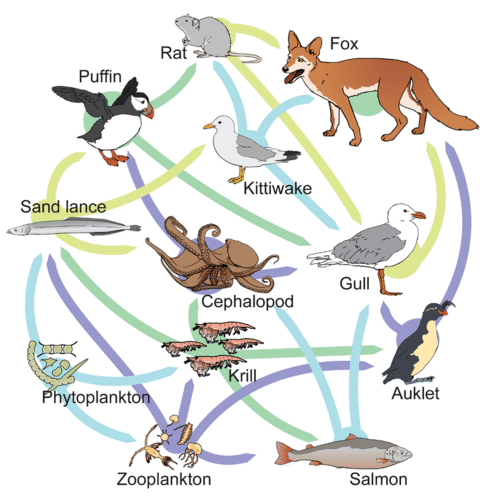
Figure \(\PageIndex{9}\): In this food web, each organism may have multiple food sources or be eaten by multiple species. Phytoplankton are the primary producers. They are consumed by sand lances, krill, and zooplankton. Sand lances are consumed by puffins, kittiwake, and cephalopods. Krill are consumed by the sand lance, cephalopods, auklets, and salmon. Zooplankton are consumed by the sand lance, krill, auklets, and salmon. Puffins are eaten by rats and gulls. Kittiwakes are eaten by rats, foxes, and gulls. Cephalopods are consumed by puffins and gulls. Auklets are consumed by gulls and foxes. Salmon are consumed by cephalopods and gulls. Rats are consumed by foxes and gulls. Gulls are consumed by foxes. Detritivores and decomposers are not shown. Image by Mariana Ruiz Villarreal (LadyofHats) for CK-12 Foundation (CC-BY-NC).
Ecosystem Productivity
Productivity within an ecosystem can be defined as the percentage of energy entering the ecosystem incorporated into biomass in a particular trophic level. Biomass is the total mass, in a unit area at the time of measurement, of living or previously living organisms within a trophic level. Ecosystems have characteristic amounts of biomass at each trophic level. For example, in the English Channel ecosystem the primary producers account for a biomass of 4 g/m2 (grams per meter squared), while the primary consumers exhibit a biomass of 21 g/m2.
The productivity of the primary producers is especially important in any ecosystem because these organisms bring energy to other living organisms by photoautotrophy or chemoautotrophy. The rate at which photosynthetic producers incorporate energy from the sun is called gross primary productivity. In a cattail marsh, plants only trap 2.2% of the energy from the sun that reaches them. Three percent of the energy is reflected, and another 94.8% is used to heat and evaporate water within and surrounding the plant. However, not all of the energy incorporated by producers is available to the other organisms in the food web because producers must also grow and reproduce, which consumes energy. At least half of the 2.2% trapped by cattail marsh plants is used to meet the plants own energy needs.
Net primary productivity is the energy that remains in the producers after accounting for the metabolic needs of the producers and heat loss. The net productivity is then available to the primary consumers at the next trophic level. One way to measure net primary productivity is to collect and weigh the plant material produced on a m2 (about 10.7 ft2) of land over a given interval. One gram of plant material (e.g., stems and leaves), which is largely the carbohydrate cellulose, yields about 4.25 kcal of energy when burned. Net primary productivity can range from 500 kcal/m2/yr in the desert to 15,000 kcal/m2/yr in a tropical rain forest.
The loss of energy between trophic levels is illustrated by the pioneering studies of Howard T. Odum in the Silver Springs, Florida, ecosystem in the 1940s (Figure \(\PageIndex{10}\)). the gross primary productivity (total energy accumulated by the primary producers) was 20,810 kcal/m2/yr (figure \(\PageIndex{j}\)). The net primary productivity (energy available to consumers) was only 7,632 kcal/m2/yr after accounting for energy lost as heat and energy require to meet the producer's metabolic needs. . The primary consumers generated 3368 kcal/m2/yr, the secondary consumers generated 383 kcal/m2/yr, and the tertiary consumers only generated 21 kcal/m2/yr. Thus, there is little energy remaining for another level of consumers in this ecosystem.
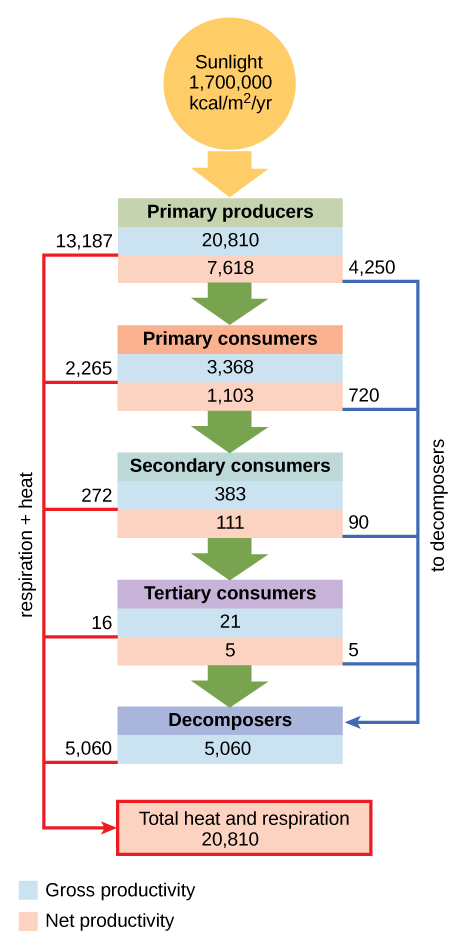
Figure \(\PageIndex{10}\): The flow of energy through a spring ecosystem in Silver Springs, Florida. The gross productivity (blue) for each trophic level is listed just above the net productivity (red). Notice that the energy decreases with each increase in trophic level. The energy content of primary producers (gross productivity) is 20,810 kcal/m2/yr. The gross productivity of primary consumers is much smaller, about 3,368 kcal/m2/yr. The gross productivity of secondary consumers is 383 kcal/m2/yr, and the gross productivity of tertiary consumers is only 21 kcal/m2/yr. The net productivity of each trophic level is less than the gross productivity because some energy is used to meet metabolic needs (respiration), and some energy is lost as heat. For example, the net productivity of primary consumers was 1,103 kcal/m2/yr, only about a third of the gross productivity. Some of the energy in each trophic level (a total of 5,060 kcal/m2/yr) is transferred to decomposers. All of the energy initially captured by primary producers (20,810 kcal/m2/yr) is eventually released from the system.
Ecological Efficiency: The Transfer of Energy between Trophic Levels
As illustrated in Figure \(\PageIndex{10}\), large amounts of energy are lost from the ecosystem from one trophic level to the next level as energy flows from the primary producers through the various trophic levels of consumers and decomposers. The main reason for this loss is the second law of thermodynamics, which states that whenever energy is converted from one form to another, there is a tendency toward disorder (entropy) in the system. In biologic systems, this means a great deal of energy is lost as metabolic heat when the organisms from one trophic level consume the next level. In the Silver Springs ecosystem example (Figure \(\PageIndex{10}\)), we see that the primary consumers produced 1103 kcal/m2/yr from the 7618 kcal/m2/yr of energy available to them from the primary producers. The measurement of energy transfer efficiency between two successive trophic levels is termed the trophic level transfer efficiency (TLTE) and is defined by the formula:
\[\text{TLTE} = \frac{\text{production at present trophic level}}{\text{production at previous trophic level}} * 100 \nonumber\]
In Silver Springs, the TLTE between the first two trophic levels was approximately 14.8 percent. The low efficiency of energy transfer between trophic levels is usually the major factor that limits the length of food chains observed in a food web. The fact is, after four to six energy transfers, there is not enough energy left to support another trophic level. In the Lake Ontario example shown in Figure 46.1.5, only three energy transfers occurred between the primary producer, (green algae), and the apex consumer (Chinook salmon).
Ecologists have many different methods of measuring energy transfers within ecosystems. Some transfers are easier or more difficult to measure depending on the complexity of the ecosystem and how much access scientists have to observe the ecosystem. In other words, some ecosystems are more difficult to study than others, and sometimes the quantification of energy transfers has to be estimated.
Another main parameter that is important in characterizing energy flow within an ecosystem is the net production efficiency. Net production efficiency (NPE) allows ecologists to quantify how efficiently organisms of a particular trophic level incorporate the energy they receive into biomass; it is calculated using the following formula:
\[\text{NPE} = \frac{\text{net consumer productivity}}{\text{assimilation}} * 100 \nonumber\]
Net consumer productivity is the energy content available to the organisms of the next trophic level. Assimilation is the biomass (energy content generated per unit area) of the present trophic level after accounting for the energy lost due to incomplete ingestion of food, energy used for respiration, and energy lost as waste. Incomplete ingestion refers to the fact that some consumers eat only a part of their food. For example, when a lion kills an antelope, it will eat everything except the hide and bones. The lion is missing the energy-rich bone marrow inside the bone, so the lion does not make use of all the calories its prey could provide.
Thus, NPE measures how efficiently each trophic level uses and incorporates the energy from its food into biomass to fuel the next trophic level. In general, cold-blooded animals (ectotherms), such as invertebrates, fish, amphibians, and reptiles, use less of the energy they obtain for respiration and heat than warm-blooded animals (endotherms), such as birds and mammals. The extra heat generated in endotherms, although an advantage in terms of the activity of these organisms in colder environments, is a major disadvantage in terms of NPE. Therefore, many endotherms have to eat more often than ectotherms to get the energy they need for survival. In general, NPE for ectotherms is an order of magnitude (10x) higher than for endotherms. For example, the NPE for a caterpillar eating leaves has been measured at 18 percent, whereas the NPE for a squirrel eating acorns may be as low as 1.6 percent.
Modeling Ecosystems Energy Flow: Ecological Pyramids
The structure of ecosystems can be visualized with ecological pyramids, which were first described by the pioneering studies of Charles Elton in the 1920s. Ecological pyramids show the relative amounts of various parameters (such as number of organisms, energy, and biomass) across trophic levels.
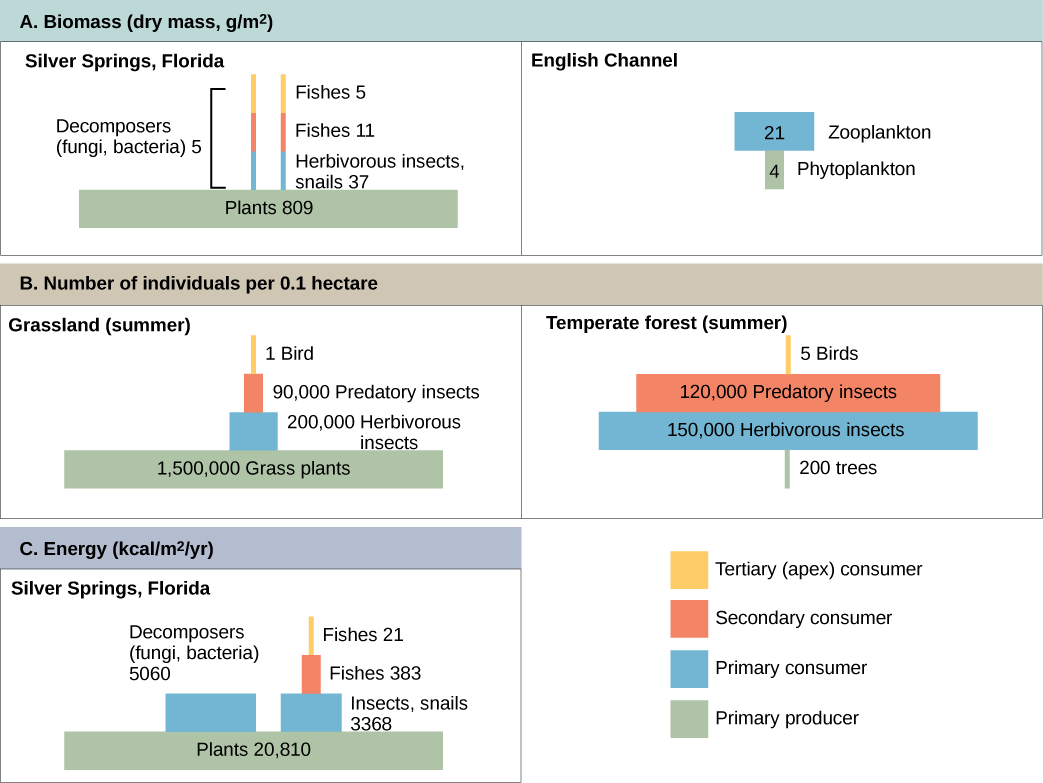
Pyramids of numbers can be either upright or inverted, depending on the ecosystem. As shown in Figure \(\PageIndex{11}\), typical grassland during the summer has a base of many plants and the numbers of organisms decrease at each trophic level. However, during the summer in a temperate forest, the base of the pyramid consists of few trees compared with the number of primary consumers, mostly insects. Because trees are large, they have great photosynthetic capability, and dominate other plants in this ecosystem to obtain sunlight. Even in smaller numbers, primary producers in forests are still capable of supporting other trophic levels.
Another way to visualize ecosystem structure is with pyramids of biomass. This pyramid measures the amount of energy converted into living tissue at the different trophic levels. Using the Silver Springs ecosystem example, this data exhibits an upright biomass pyramid (Figure \(\PageIndex{11}\)), whereas the pyramid from the English Channel example is inverted. The plants (primary producers) of the Silver Springs ecosystem make up a large percentage of the biomass found there. However, the phytoplankton in the English Channel example make up less biomass than the primary consumers, the zooplankton. As with inverted pyramids of numbers, this inverted pyramid is not due to a lack of productivity from the primary producers, but results from the high turnover rate of the phytoplankton. The phytoplankton are consumed rapidly by the primary consumers, thus, minimizing their biomass at any particular point in time. However, phytoplankton reproduce quickly, thus they are able to support the rest of the ecosystem.
Pyramid ecosystem modeling can also be used to show energy flow through the trophic levels. Notice that these numbers are the same as those used in the energy flow compartment diagram in Figure \(\PageIndex{10}\). Pyramids of energy are always upright, and an ecosystem without sufficient primary productivity cannot be supported. All types of ecological pyramids are useful for characterizing ecosystem structure. However, in the study of energy flow through the ecosystem, pyramids of energy are the most consistent and representative models of ecosystem structure (Figure \(\PageIndex{11}\)).
Footnotes
- 1 Nature (Vol. 458, April 1, 2009)
- 2 Howard T. Odum, “Trophic Structure and Productivity of Silver Springs, Florida,” Ecological Monographs 27, no. 1 (1957): 47–112.
Contributors and Attributions
Modified by Kyle Whittinghill and Melissa Ha from the following sources:
- Ecology of Ecosystems, Energy Flow through Ecosystems, and Digestive Systems from General Biology/Biology 2e by OpenStax (licensed under CC-BY). Access for free at openstax.org. by
Connie Rye (East Mississippi Community College), Robert Wise (University of Wisconsin, Oshkosh), Vladimir Jurukovski (Suffolk County Community College), Jean DeSaix (University of North Carolina at Chapel Hill), Jung Choi (Georgia Institute of Technology), Yael Avissar (Rhode Island College) among other contributing authors. Original content by OpenStax (CC BY 4.0; Download for free at http://cnx.org/contents/185cbf87-c72...f21b5eabd@9.87).
- Energy, Energy Enters Ecosystems Through Photosynthesis, and Energy Flow Through Ecosystems from Environmental Biology by Matthew R. Fisher (licensed under CC-BY)
- Ecosystem Productivity from Biology by John W. Kimball (licensed under CC-BY)