
12.3: Water Pollutants and Their Sources
- Page ID
- 69475

Although natural processes such as volcanic eruptions or evaporation sometimes can cause water pollution, most pollution is derived from human, land-based activities. Pollutants can spread through different water reservoirs, as the water carrying them progresses through stages of the water cycle (figure \(\PageIndex{1}\)). Water can be contaminated by various human activities or by existing natural features, like mineral-rich geologic formations. Agricultural activities, industrial operations, landfills, animal operations, and small and large scale sewage treatment processes, among many other things, all can potentially contribute to contamination. As water runs over the land or infiltrates into the ground, it dissolves material left behind by these potential contaminant sources. The risks and type of remediation for a contaminant depend on the type of chemicals present.
Figure \(\PageIndex{1}\): Sources of some water pollutants and movement of pollutants into different water reservoirs of the water cycle (such as rivers and aquifers). Point source contamination can be traced to specific points of discharge. Air pollution is an example of nonpoint source contamination because contaminants are throughout the air and landscape, ultimately entering the water from multiple locations. Eroded soil and sediment are another source of nonpoint source pollution. Image by USGS (public domain).
Point source pollution can be attributed to a single, definable origin. For example, animal factory farms (figure \(\PageIndex{2}\)) raise a large number and high density of livestock such as cows, pigs, and chickens.
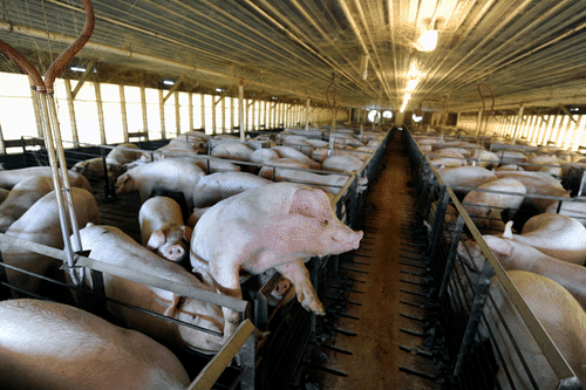
Figure \(\PageIndex{2}\): Large animal farms are often referred to as concentrated feeding operations (CFOs). These farms are considered potential point sources of pollution because untreated animal waste may enter nearby waterbodies as untreated sewage. Credit: ehp.gov
Combined sewer systems that have a single set of underground pipes to collect both sewage and storm water runoff from streets for wastewater treatment can also be major point sources of pollutants. During heavy rain, storm water runoff may exceed sewer capacity, causing it to back up. This spills untreated sewage directly into surface waters (figure \(\PageIndex{3}\)). Other examples include pipes from factories, waste disposal sites, storage tanks, and chemical spills.
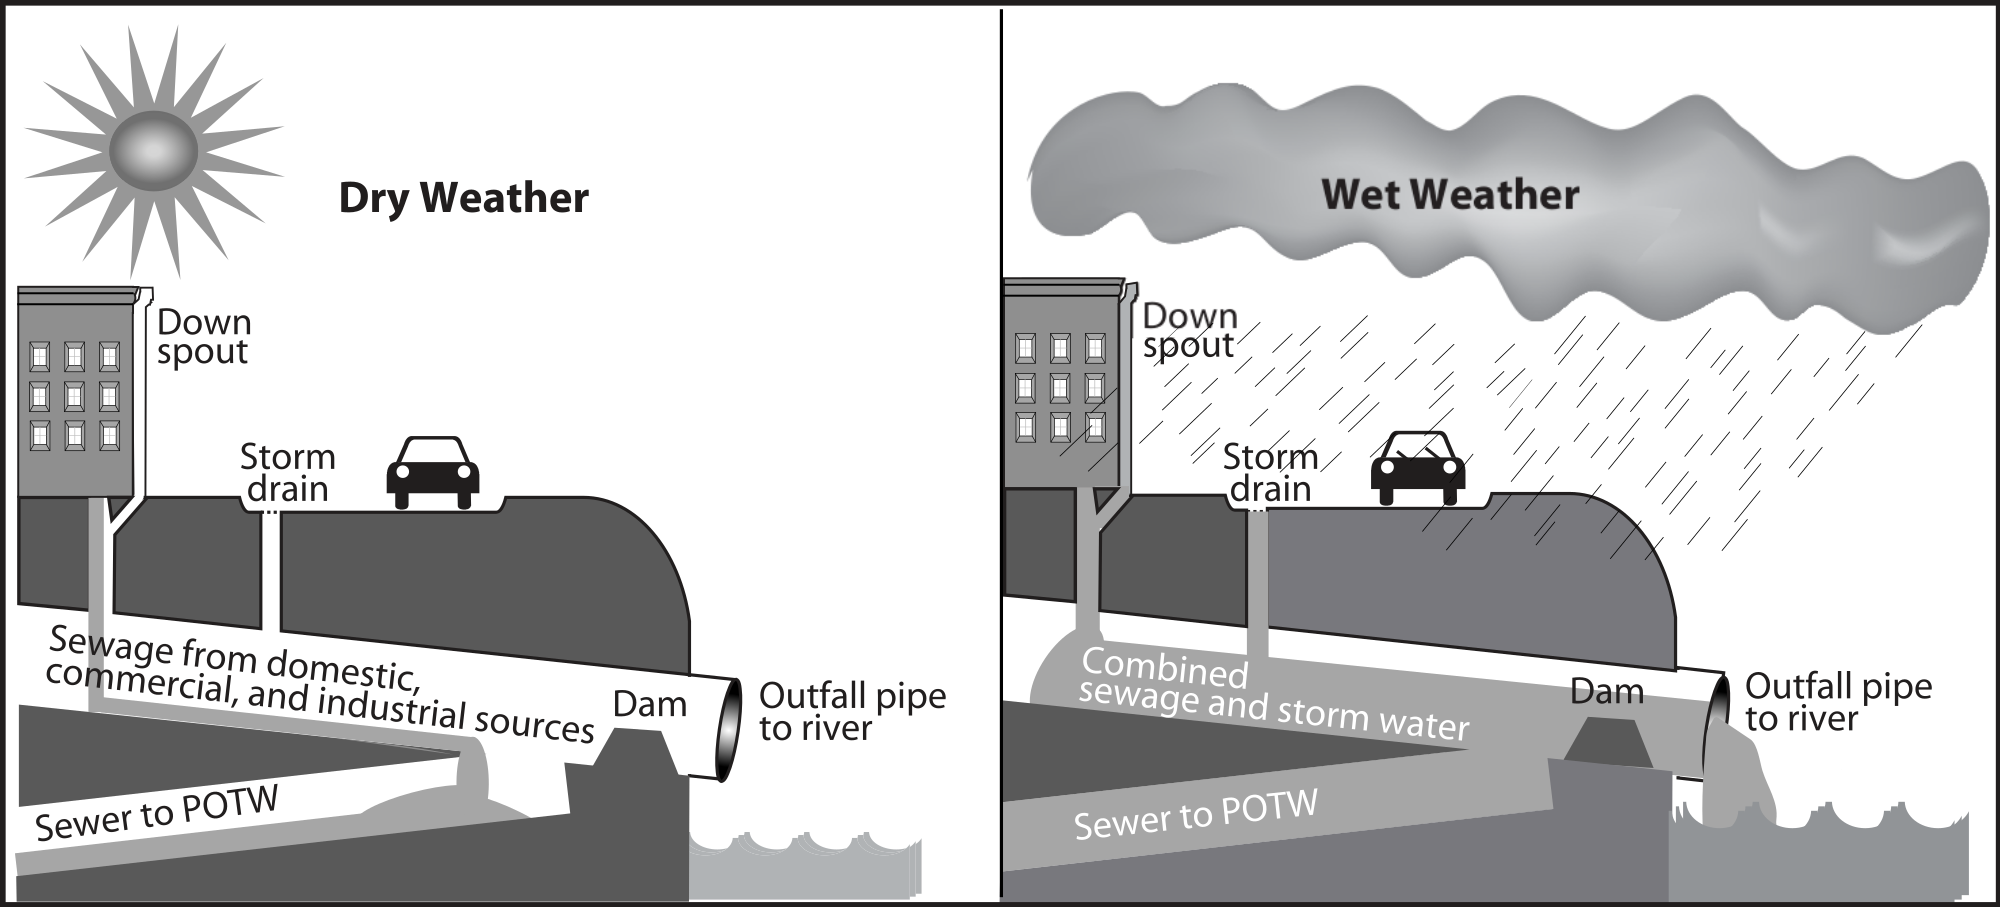
Figure \(\PageIndex{3}\): A combined sewer system is a possible major point source of water pollution during heavy rain due to overflow of untreated sewage. Sewage from domestic, commercial, and industrial sources enter the system through the down spout and storm water enters through the storm drain. During dry weather (and small storms), all sewage is handled by the publicly owned treatment works (POTW). A dam prevents raw sewage from flowing into a water body through the outfall pipe. During wet weather (large storms), the relief structure allows some of the combined sewage and storm water to be discharged untreated to an adjacent water body. Image by U.S. Environmental Protection Agency (public domain).
Nonpoint source pollution is from multiple dispersed sources. The whole of the contribution of pollutants is harmful, but the individual components may not reach harmful concentrations. Nonpoint sources of pollution include agricultural fields, cities, and abandoned mines. Rainfall runs over the land and through the ground, picking up pollutants from throughout the watershed (including areas of land and smaller streams that drain into a particular body of water). These pollutants might include herbicides, pesticides, and fertilizer from agricultural fields and lawns; oil, antifreeze, animal waste, and road salt from urban areas; and acid and toxic elements from abandoned mines. Then, this pollution is carried by runoff into surface water bodies and groundwater. Nonpoint source pollution, which is the leading cause of water pollution in the U.S., is usually much more difficult and expensive to control than point source pollution because of its low concentration, multiple sources, and much greater volume of water.
Residence time (the average time that a water molecule spends in a reservoir) is key to pollution problems because it affects pollution potential. Water in rivers has a relatively short residence time, so pollution usually is there only briefly. Of course, pollution in rivers may simply move to another reservoir, such as the ocean, where it can cause further problems. Groundwater is typically characterized by slow flow and longer residence time, which can make groundwater pollution particularly problematic. Finally, pollution residence time can be much greater than the water residence time because a pollutant may be taken up for a long time within the ecosystem or absorbed onto sediment.
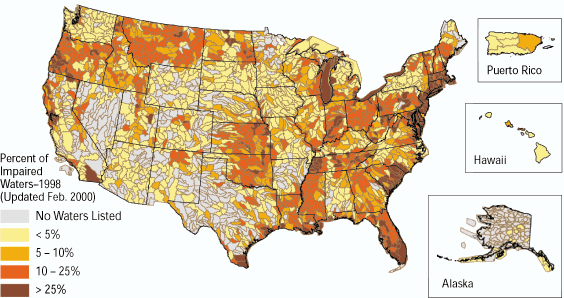
According to a 2016 report, there were 20,912 cases of impaired water bodies in the United States, which means they could neither support a healthy ecosystem nor meet water quality standards (Table \(\PageIndex{1}\) and Figure \(\PageIndex{4}\)). Selected causes of impairment (water pollutants) are discussed below, categorized according to whether they arise from chemical, biological, or physical processes.
| Cause of Impairment | Number of Impaired Bodies of Water |
|---|---|
| Polychlorinated biphenyls (PCBs) | 3,712 |
| Pathogens | 2,248 |
| Nutrients | 2,228 |
| Mercury | 2,138 |
| Metals (other than mercury) | 2,075 |
| Cause unknown- impaired biota | 1,852 |
| Organic enrichment/oxygen depletion | 1,281 |
| Turbidity | 1,175 |
| Pesticides | 795 |
| Salinity/total dissolved solids/chlorides/sulfates | 576 |
| pH/acidity/caustic conditions | 489 |
| Sediment | 453 |
| Temperature | 358 |
| Total toxics | 282 |
| Algal growth | 174 |
| Cause unknown | 159 |
| Dioxins | 136 |
| Toxic organics | 127 |
| Toxic inorganics | 99 |
.png?revision=1)
Figure \(\PageIndex{4}\): Percentage of Impaired Water Bodies in a Watershed by State in USA Based on US EPA Data in 2000 Map of watersheds containing impaired water bodies from the U.S. Environmental Protection Agency's 1998 list of impaired waters Source: U.S. Geological Survey
Groundwater pollution can occur from underground sources and all of the pollution sources that contaminate surface waters. Common sources of groundwater pollution are leaking underground storage tanks for fuel, septic tanks, agricultural activity, landfills, and fossil fuel extraction. Common groundwater pollutants include nitrate, pesticides, volatile organic compounds, and petroleum products. Polluted groundwater can be a more serious problem than polluted surface water because the pollution in groundwater may go undetected for a long time because usually it moves very slowly. As a result, the pollution in groundwater may create a contaminant plume, a large body of flowing polluted groundwater (Figure \(\PageIndex{5}\)), making cleanup very costly. By the time groundwater contamination is detected, the entity responsible for the pollution may be bankrupt or nonexistent. Another troublesome feature of groundwater pollution is that small amounts of certain pollutants, e.g., petroleum products and organic solvents, can contaminate large areas. In Denver, Colorado 80 liters of several organic solvents contaminated 4.5 trillion liters of groundwater and produced a 5 km long contaminant plume. A major threat to groundwater quality is from underground fuel storage tanks. Fuel tanks commonly are stored underground at gas stations to reduce explosion hazards. Before 1988 in the U.S. these storage tanks could be made of metal, which can corrode, leak, and quickly contaminate local groundwater. Now, leak detectors are required and the metal storage tanks are supposed to be protected from corrosion or replaced with fiberglass tanks. Currently there are around 600,000 underground fuel storage tanks in the U.S. and over 30% still do not comply with EPA regulations regarding either release prevention or leak detection.
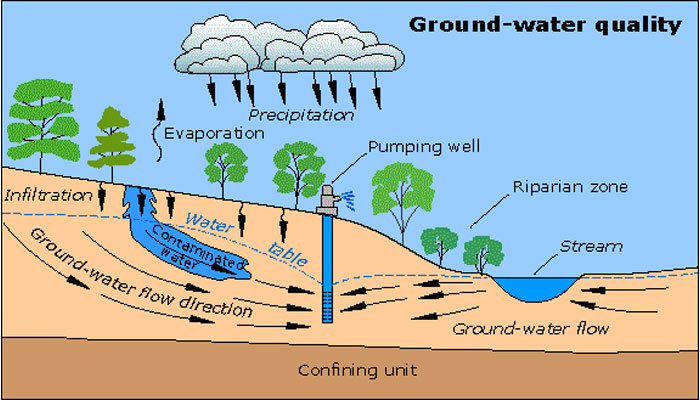
Figure \(\PageIndex{5}\): Contaminant Plume in Groundwater Mapping how a contaminant plume will migrate once it reaches groundwater requires understanding of the pollutant's chemical properties, local soil characteristics, and how permeable the aquifer is. Source: United States Geological Survey
Biological Pollutants
Pathogens are disease-causing microorganisms, e.g., viruses, bacteria, parasitic worms, and protozoa, which cause a variety of intestinal diseases such as dysentery, typhoid fever, hepatitis, and cholera. Pathogens enter water primarily from human and animal fecal waste due to inadequate sewage treatment. In many underdeveloped countries, sewage is discharged into local waters either untreated or after only rudimentary treatment. In developed countries untreated sewage discharge can occur from overflows of combined sewer systems, poorly managed livestock factory farms, and leaky or broken sewage collection systems. Water with pathogens can be remediated by adding chlorine or ozone (O3), by boiling, or by treating the sewage in the first place.
Unfortunately nearly a billion people around the world are exposed to waterborne pathogen pollution daily and around 1.5 million children mainly in underdeveloped countries die every year of waterborne diseases from pathogens. According to the World Health Organization, in 2008 approximately 880 million people in the world (or 13% of world population) did not have access to improved (safe) drinking water (World Health Statistics, 2010) (Figure \(\PageIndex{6}\)). At the same time, about 2.6 billion people (or 40% of world population) lived without improved sanitation (Figure \(\PageIndex{7}\)), which is defined as having access to a public sewage system, septic tank, or even a simple pit latrine. Each year approximately 1.7 million people die from diarrheal diseases associated with unsafe drinking water, inadequate sanitation, and poor hygiene, e.g., hand washing with soap. Almost all of these deaths are in developing countries, and around 90% of them occur among children under the age of 5 (Figure \(\PageIndex{8}\)). Compounding the water crisis is the issue of social justice; poor people more commonly lack clean water and sanitation than wealthy people in similar areas. Globally, improving water, sanitation, and hygiene could prevent up to 9% of all disease and 6% of all deaths.
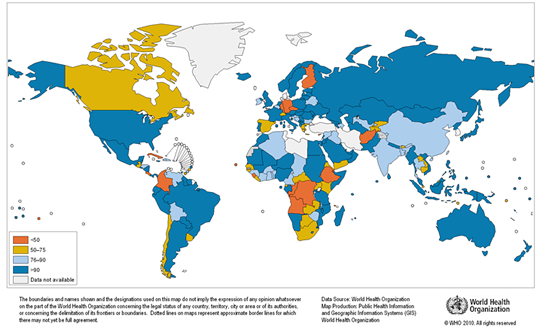
Figure \(\PageIndex{6}\): Proportion of Population by Country Using Improved Drinking Water Sources in 2008 Improved drinking water sources, e.g., household connections, public standpipes, boreholes, protected dug wells and springs, and rainwater collections, are defined as those more likely to provide safe water than unimproved water sources, e.g., unprotected wells and springs, vendor-provided water, bottled water (unless water for other uses is available from an improved source), and tanker truck-provided water. Source: World Health Organization
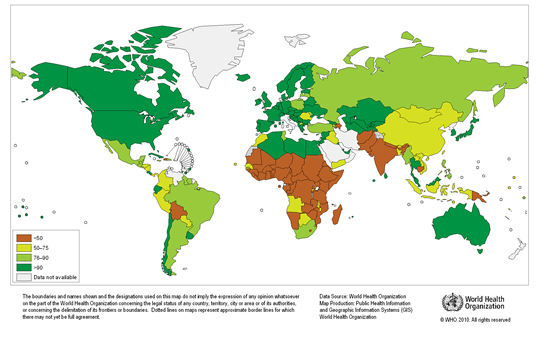 Figure \(\PageIndex{7}\): Proportion of Population by Country Using Improved Sanitation Facilities in 2008 Improved sanitation facilities, e.g., connection to public sewers or septic systems, pour-flush latrines, pit latrines, and ventilated improved pit latrines, are defined as those more likely to be sanitary than unimproved facilities, e.g., bucket latrines, public latrines, and open pit latrines. Source: World Health Organization
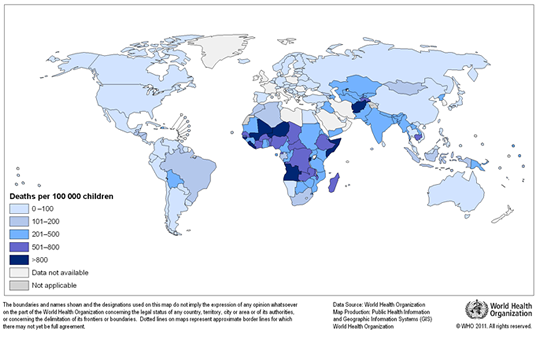 Figure \(\PageIndex{8}\): Deaths by Country from Diarrhea Caused by Unsafe Water, Unimproved Sanitation, and Poor Hygiene in Children Less than 5 Years Old, 2004 Source: World Health Organization
Chemical Pollutants
Chemical pollution from agriculture, industry, cities, and mining threatens global water quality. Air pollutants from these activities can also enter bodies of water (and become water pollutants) through dry deposition, precipitation, and runoff. Some chemical pollutants have serious and well-known health effects, whereas many others have poorly known long-term health effects.
Any natural water contains dissolved chemicals, some of which are important human nutrients while others can be harmful to human health. The concentration of a water pollutant is commonly given in very small units such as parts per million (ppm) or even parts per billion (ppb). An arsenic concentration of 1 ppm means 1 part of arsenic per million parts of water. This is equivalent to one drop of arsenic in 50 liters of water. To give you a different perspective on appreciating small concentration units, converting 1 ppm to length units is 1 cm (0.4 in) in 10 km (6 miles) and converting 1 ppm to time units is 30 seconds in a year. Total dissolved solids (TDS) represent the total amount of dissolved material in water. Average TDS values for rainwater, river water, and seawater are about 4 ppm, 120 ppm, and 35,000 ppm, respectively.
Inorganic pollutants (figure \(\PageIndex{9}\)) include nutrients like nitrate (NO3-) and phosphate (PO43-), heavy metals, chloride (Cl-), and radioactive isotopes released from mining or nuclear accidents (such as cesium, iodine, uranium, and radon gas).
.jpg?revision=1&size=bestfit&width=582&height=388)
Figure \(\PageIndex{9}\): This scientist demonstrates how to test water quality, and part of this involves measuring levels of inorganic pollutants. Image by Erin Gleeson (CC-BY).
Toxic Heavy Metals
Examples of heavy metals include arsenic, mercury, lead, cadmium, and chromium, and they can bioaccumulate and biomagnify through the food chain (see Biomagnification below at the end of this section). Heavy metals are commonly produced by industry and at metallic ore mines. Arsenic and mercury are discussed in more detail below. The US EPA regulates 83 contaminants in drinking water to ensure a safe public water supply. Similarly, at the international level the World Health Organization has drinking water standards for a variety of contaminants.
Arsenic (As) has been famous as an agent of death for many centuries. In large doses arsenic causes cancer and can be fatal. Only recently have scientists recognized that health problems can be caused by drinking small arsenic concentrations in water over a long time. It attacks the central nervous system and can damage the respiratory system, bladder, lungs, liver, and kidneys. Arsenic enters the water supply naturally from weathering of arsenic-rich minerals and from human activities such as coal burning and smelting of metallic ores. The worst case of arsenic poisoning occurred in the densely populated impoverished country of Bangladesh, which had experienced 100,000s of deaths from diarrhea and cholera each year from drinking surface water contaminated with pathogens due to improper sewage treatment. In the 1970s the United Nations provided aid for millions of shallow water wells (20-100m deep), which resulted in a dramatic drop in pathogenic diseases. Unfortunately, many of the wells produced water naturally rich in arsenic (Figure \(\PageIndex{10}\)). Tragically, there are an estimated 77 million people (about half of the population) who inadvertently may have been exposed to toxic levels of arsenic in Bangladesh as a result. Arsenic poisoning leads to headaches, confusion, and diarrhea, and eventually to vomiting, stomach pain, and convulsions. If not treated, the final outcomes are heart disease, stroke, cancer, diabetes, coma, and death. There are ways to treat arsenic-rich groundwater, but it is a challenge in Bangladesh to implement the simple and effective technology that is available. The World Health Organization has called it the largest mass poisoning of a population in history.
Mercury enters the water supply naturally from weathering of mercury-rich minerals and, like mercury, from human activities such as coal burning and metal processing. Mercury (Hg) is used in a variety of electrical products, such as dry cell batteries, fluorescent light bulbs, and switches, as well as in the manufacture of paint, paper, vinyl chloride, and fungicides. Mercury acts on the central nervous system and can cause loss of sight, feeling, and hearing as well as nervousness, shakiness, and death. A famous mercury poisoning case in Minamata, Japan involved methylmercury-rich industrial discharge that caused high mercury levels in fish. People in the local fishing villages ate fish up to three times per day for over 30 years, which resulted in over 2,000 deaths. During that time the responsible company and national government did little to mitigate, help alleviate, or even acknowledge the problem.
Biochemical Oxygen Demand
Oxygen-demanding waste is an extremely important pollutant to ecosystems. Most surface water in contact with the atmosphere has a small amount of dissolved oxygen, which is needed by aquatic organisms for cellular respiration. Decomposers, such as bacteria and fungi, also conduct cellular respiration and consume oxygen as they break down dead organic matter according to the following reaction:
\[\text{organic matter} + O_{2} \rightarrow CO_{2} + H_{2} O\]
Too much decaying organic matter in water is a pollutant because it removes oxygen from water, which can kill fish, shellfish, and aquatic insects. The amount of oxygen used by aerobic (in the presence of oxygen) bacterial decomposition of organic matter is called biochemical oxygen demand (BOD). The major source of dead organic matter in many natural waters is sewage; grass and leaves are smaller sources. An unpolluted water body with respect to BOD is a turbulent river that flows through a natural forest. Turbulence continually brings water in contact with the atmosphere where the O2 content is restored. The dissolved oxygen content in such a river ranges from 10 to 14 ppm O2, BOD is low, and clean-water fish such as trout thrive (figure \(\PageIndex{11}\)).
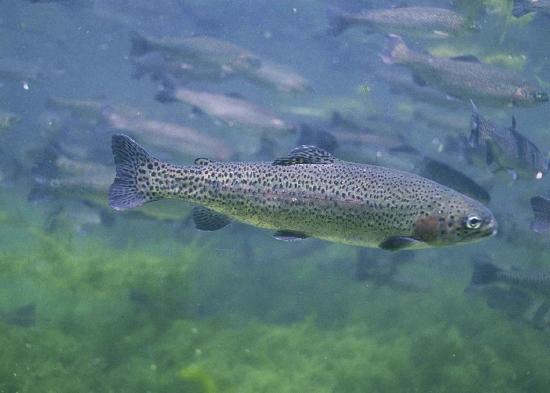
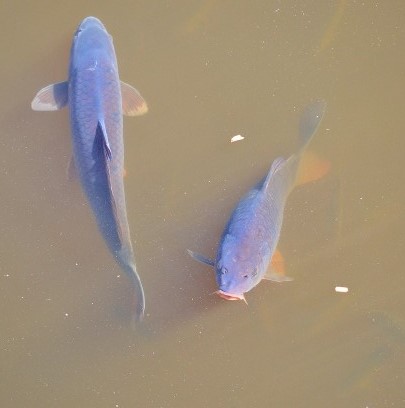
Figure \(\PageIndex{11}\): Left: Fish like rainbow trout thrive under low biological oxygen demand and ample levels of dissolved oxygen. Right: Fish like carp thrive under high biological oxygen demand and low dissolved oxygen levels. Left image by Engbretson Eric/U.S. Fish and Wildlife Service (public domain). Right image by X posid (public domain).
A polluted water body with respect to oxygen is a stagnant deep lake in an urban setting with a combined sewer system. This system favors a high input of dead organic carbon from sewage overflows and limited chance for water circulation and contact with the atmosphere. In such a lake, the dissolved O2 content is ≤5 ppm O2, BOD is high, and low O2-tolerant fish, such as carp and catfish dominate (figure \(\PageIndex{11}\)).
Plant Nutrients and Eutrophication
Excessive nutrients, particularly nitrogen (N) and phosphorous (P), are pollutants closely related to oxygen-demanding waste. Plants and algae require 15-20 nutrients for growth, most of which are plentiful in water. Nitrogen and phosphorus are called limiting nutrients, however, because they usually are present in water at low concentrations and therefore restrict the total amount of plant growth. This explains why nitrogen and phosphorus are major ingredients in most fertilizer.
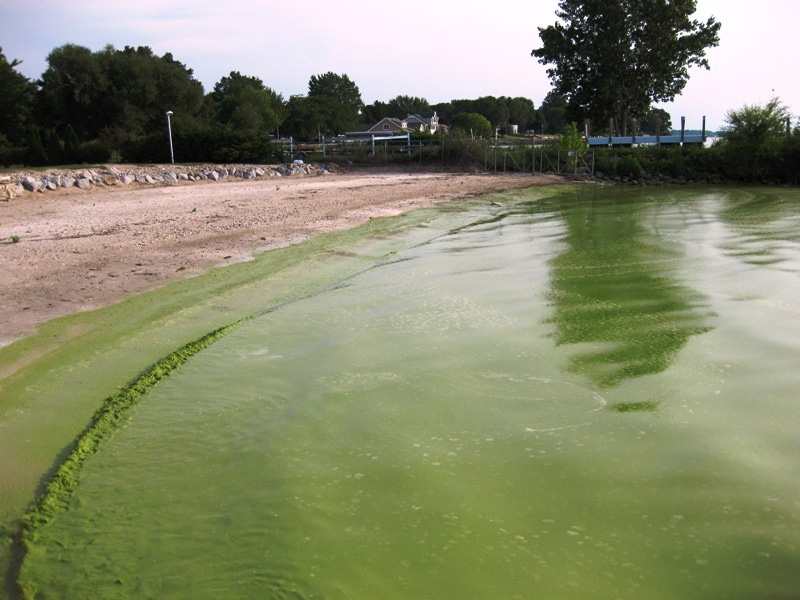
Figure \(\PageIndex{12}\): A cyanobacteria (blue-green algae) bloom in Lake Erie resulting from fertilizer pollution. Image by NASA (public domain).
High concentrations of limiting nutrients, particularly nitrogen (N) and phosphorous (P), from human sources (mostly agricultural and urban runoff including fertilizer, sewage, and phosphorus-based detergent) can cause cultural eutrophication, which leads to the rapid growth of aquatic producers, particularly algae, called an algal bloom. Thick mats of floating algae or rooted plants lead to a form of water pollution that damages the ecosystem by clogging fish gills and blocking sunlight (figure \(\PageIndex{12}\)). When the prolific algal layer dies, it becomes oxygen-demanding waste, which can create very low O2 water (<~2 ppm O2), called hypoxia or dead zone because it causes death to organisms that are unable to leave that environment (figure \(\PageIndex{13}\)).
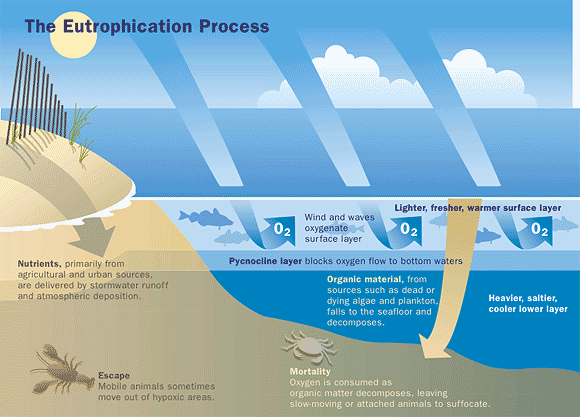
Figure \(\PageIndex{13}\): The Eutrophication Process and how it leads to hypoxia. The process of eutrophication. During eutrophication, increased nutrients causes the growth of photosynthetic microbes resulting in more biomass to decompose. More oxygen is used in decomposition, resulting in the death of larger organisms. The growth of photosynthetic microbes also leads to toxins (for example, those produced during red tides), which also leads to the death of larger organisms. Source: https://www.wri.org/our-work/project/eutrophication-and-hypoxia/about-eutrophication
A small percentage of algal species produce toxins that can kill fish, mammals, and birds, and may cause human illness. Exponential growths of these algae are called toxic algal blooms or harful algal blooms (figure \(\PageIndex{14}\)).
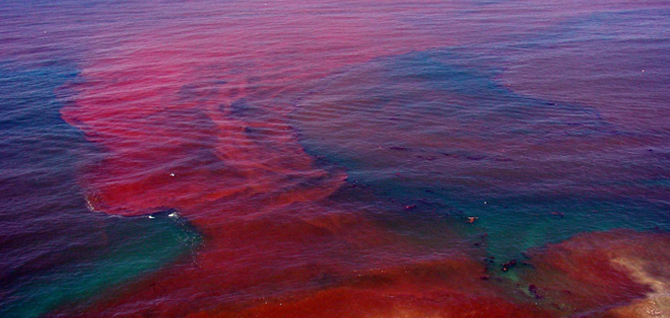
Figure \(\PageIndex{14}\): Harmful Algal Bloom Harmful algal bloom with deep red color. Source: Kai Schumann via National Oceanic and Atmospheric Administration
An estimated 50% of lakes in North America, Europe, and Asia are negatively impacted by cultural eutrophication. In addition, the size and number of marine hypoxic zones have grown dramatically over the past 50 years (Figure \(\PageIndex{15}\)), including a very large dead zone located offshore Louisiana in the Gulf of Mexico and measured 13,080 square kilometers in the summer of 2014. The eutrophication process in the Gulf of Mexico results from agricultural nutrient inputs in the Mississippi-Atchafalaya River Basin so the dead zone is cyclical and grows in the summer and shrinks during the winter due to decreased agriculture only to return the following summer. The Black Sea is another of the many dead zones that have been identified resulting from input from atmospheric deposition of NOx, intensive fertilizer use in farming practices, sewage input to water systems in the Danube River watershed in Germany. This resulted in the loss of fisheries and marine habits disrupted and reduced tourism. Cultural eutrophication and hypoxia are difficult to combat, because they are caused primarily by nonpoint source pollution, which is difficult to regulate, and N and P, which are difficult to remove from wastewater.
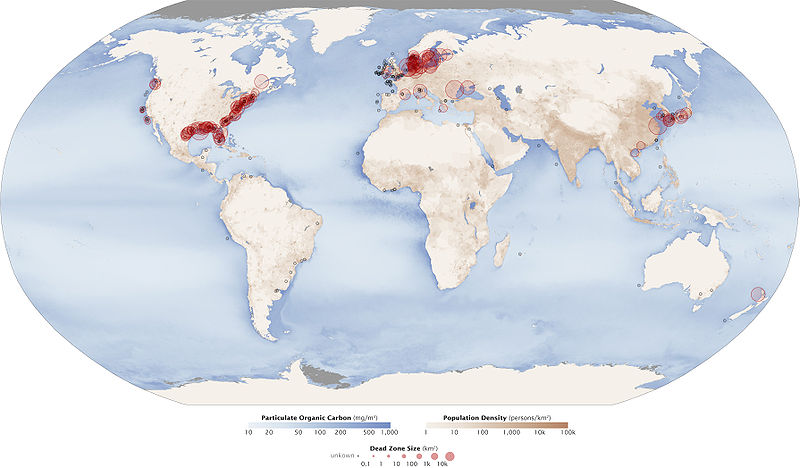
Figure \(\PageIndex{15}\): Aquatic Dead Zones Zones of hypoxia shown as red circles. Black dots show hypoxia zones of unknown size, brown shading shows population density, and blue shading shows density of particulate organic carbon, an indicator of organic productivity. Source: Robert Simmon & Jesse Allen at NASA Earth Observatory via Wikimedia Commons
For more information on Eutrophication see this video from the Khan Academy that explains the process of eutrophication and how dead zones are formed.
Organic Chemical Pollutants
Organic pollutants include herbicides and pesticides, pharmaceuticals, fuel (such as oil spills), industrial solvents and cleansers, and synthetic hormones associated with pharmaceuticals. These synthetic hormones can act as endocrine disruptors. Many are persistent organic pollutants (POPs), which are long-lived in the environment, biomagnify through the food chain, and can be toxic. As previously mentioned, DDT (pesticide), dioxin (herbicide by-product), and PCBs (polychlorinated biphenyls, which were used as a liquid insulator in electric transformers), are all POPs.
An example of organic chemical contamination is the Love Canal, in Niagara Falls, New York (Figure \(\PageIndex{16}\)). It is important because the pollution disaster at Love Canal, along with similar pollution calamities at that time (Times Beach, Missouri and Valley of Drums, Kentucky), helped to create Superfund, a federal program instituted in 1980 and designed to identify and clean up the worst of the hazardous chemical waste sites in the U.S.. Since the Love Canal tragedy, Superfund has analyzed tens of thousands of hazardous waste sites in the U.S. and cleaned up hundreds of the worst ones. Nevertheless, over 1,000 major hazardous waste sites with a significant risk to human health or the environment are still in the process of being cleaned.
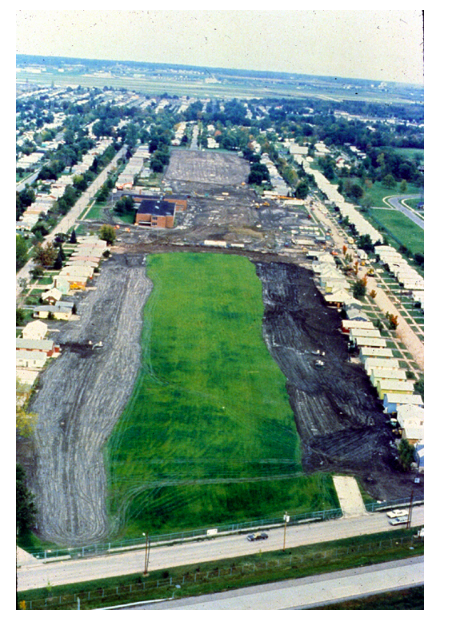
Figure \(\PageIndex{16}\): The Love Canal in Niagra Falls, New York. Image by Environmental Protection Agency (public domain).
Love Canal is a neighborhood in Niagara Falls named after a large ditch (approximately 15 m wide, 3–12 m deep, and 1600 m long) that was dug in the 1890s for hydroelectric power. The ditch was abandoned before it actually generated any power and went mostly unused for decades, except for swimming by local residents. In the 1920s Niagara Falls began dumping urban waste into Love Canal, and in the 1940s the U.S. Army dumped waste from World War II there, including waste from the effort to build a nuclear bomb. Hooker Chemical Company purchased the land in 1942 and lined it with clay. From 1942 to 1952, the Hooker Chemical disposed of over 21,000 tons of chemical waste, including chlorinated hydrocarbons, benzene, and dioxin, into a canal and covered it with a layer of clay. Chlorinated hydrocarbons are a large group of organic chemicals that have chlorine functional groups, most of which are toxic and carcinogenic to humans (DDT and PCBs are an examples.) In 1953, Hooker sold the land to the Niagara Falls school board for $1, and included a clause in the sales contract that both described the land use (filled with chemical waste) and absolved them from any future damage claims from the buried waste. The school board promptly built a public school on the site and sold the surrounding land for a housing project that built 200 or so homes along the canal banks and another 1,000 in the neighborhood. During construction, the canal’s clay cap and walls were breached, damaging some of the metal barrels. Eventually, the chemical waste seeped into people's basements, and the metal barrels worked their way to the surface. Trees and gardens began to die; bicycle tires and the rubber soles of children's shoes disintegrated in noxious puddles. From the 1950s to the late 1970s, residents repeatedly complained of strange odors and substances that surfaced in their yards. Local residents allegedly experienced major health problems including high rates of miscarriages, birth defects, and chromosome damage, but studies by the New York State Health Department disputed that. Finally, in 1978 President Carter declared a state of emergency at Love Canal, making it the first human-caused environmental problem to be designated that way, and the neighborhood had to be evacuated. Clean up of Love Canal, which was funded by Superfund and completely finished in 2004, involved removing contaminated soil, installing drainage pipes to capture contaminated groundwater for treatment, and covering it with clay and plastic. The total clean up cost was estimated to be $275 million.
Oil spills are another kind of organic pollution. Oil spills can result from supertanker accidents such as the Exxon Valdez in 1989, which spilled 10 million gallons of oil into the rich ecosystem of offshore south Alaska and killed massive numbers of animals. The largest marine oil spill was the Deepwater Horizon disaster, which began with a natural gas explosion (Figure \(\PageIndex{17}\)) at an oil well 65 km offshore of Louisiana and flowed for 3 months in 2010, releasing an estimated 200 million gallons of oil. The worst oil spill ever occurred during the Persian Gulf war of 1991, when Iraq deliberately dumped approximately 200 million gallons of oil in offshore Kuwait and set more than 700 oil well fires that released enormous clouds of smoke and acid rain for over nine months. During an oil spill on water, oil floats to the surface because it is less dense than water, and the lightest hydrocarbons evaporate, decreasing the size of the spill but polluting the air. Then, bacteria begin to decompose the remaining oil, in a process that can take many years. After several months only about 15% of the original volume may remain, but it is in thick asphalt lumps, a form that is particularly harmful to birds, fish, and shellfish. Cleanup operations can include skimmer ships that vacuum oil from the water surface (effective only for small spills), controlled burning (works only in early stages before the light, ignitable part evaporates but also pollutes the air), dispersants (detergents that break up oil to accelerate its decomposition, but some dispersants may be toxic to the ecosystem), and bioremediation (adding microorganisms that specialize in quickly decomposing oil, but this can disrupt the natural ecosystem).
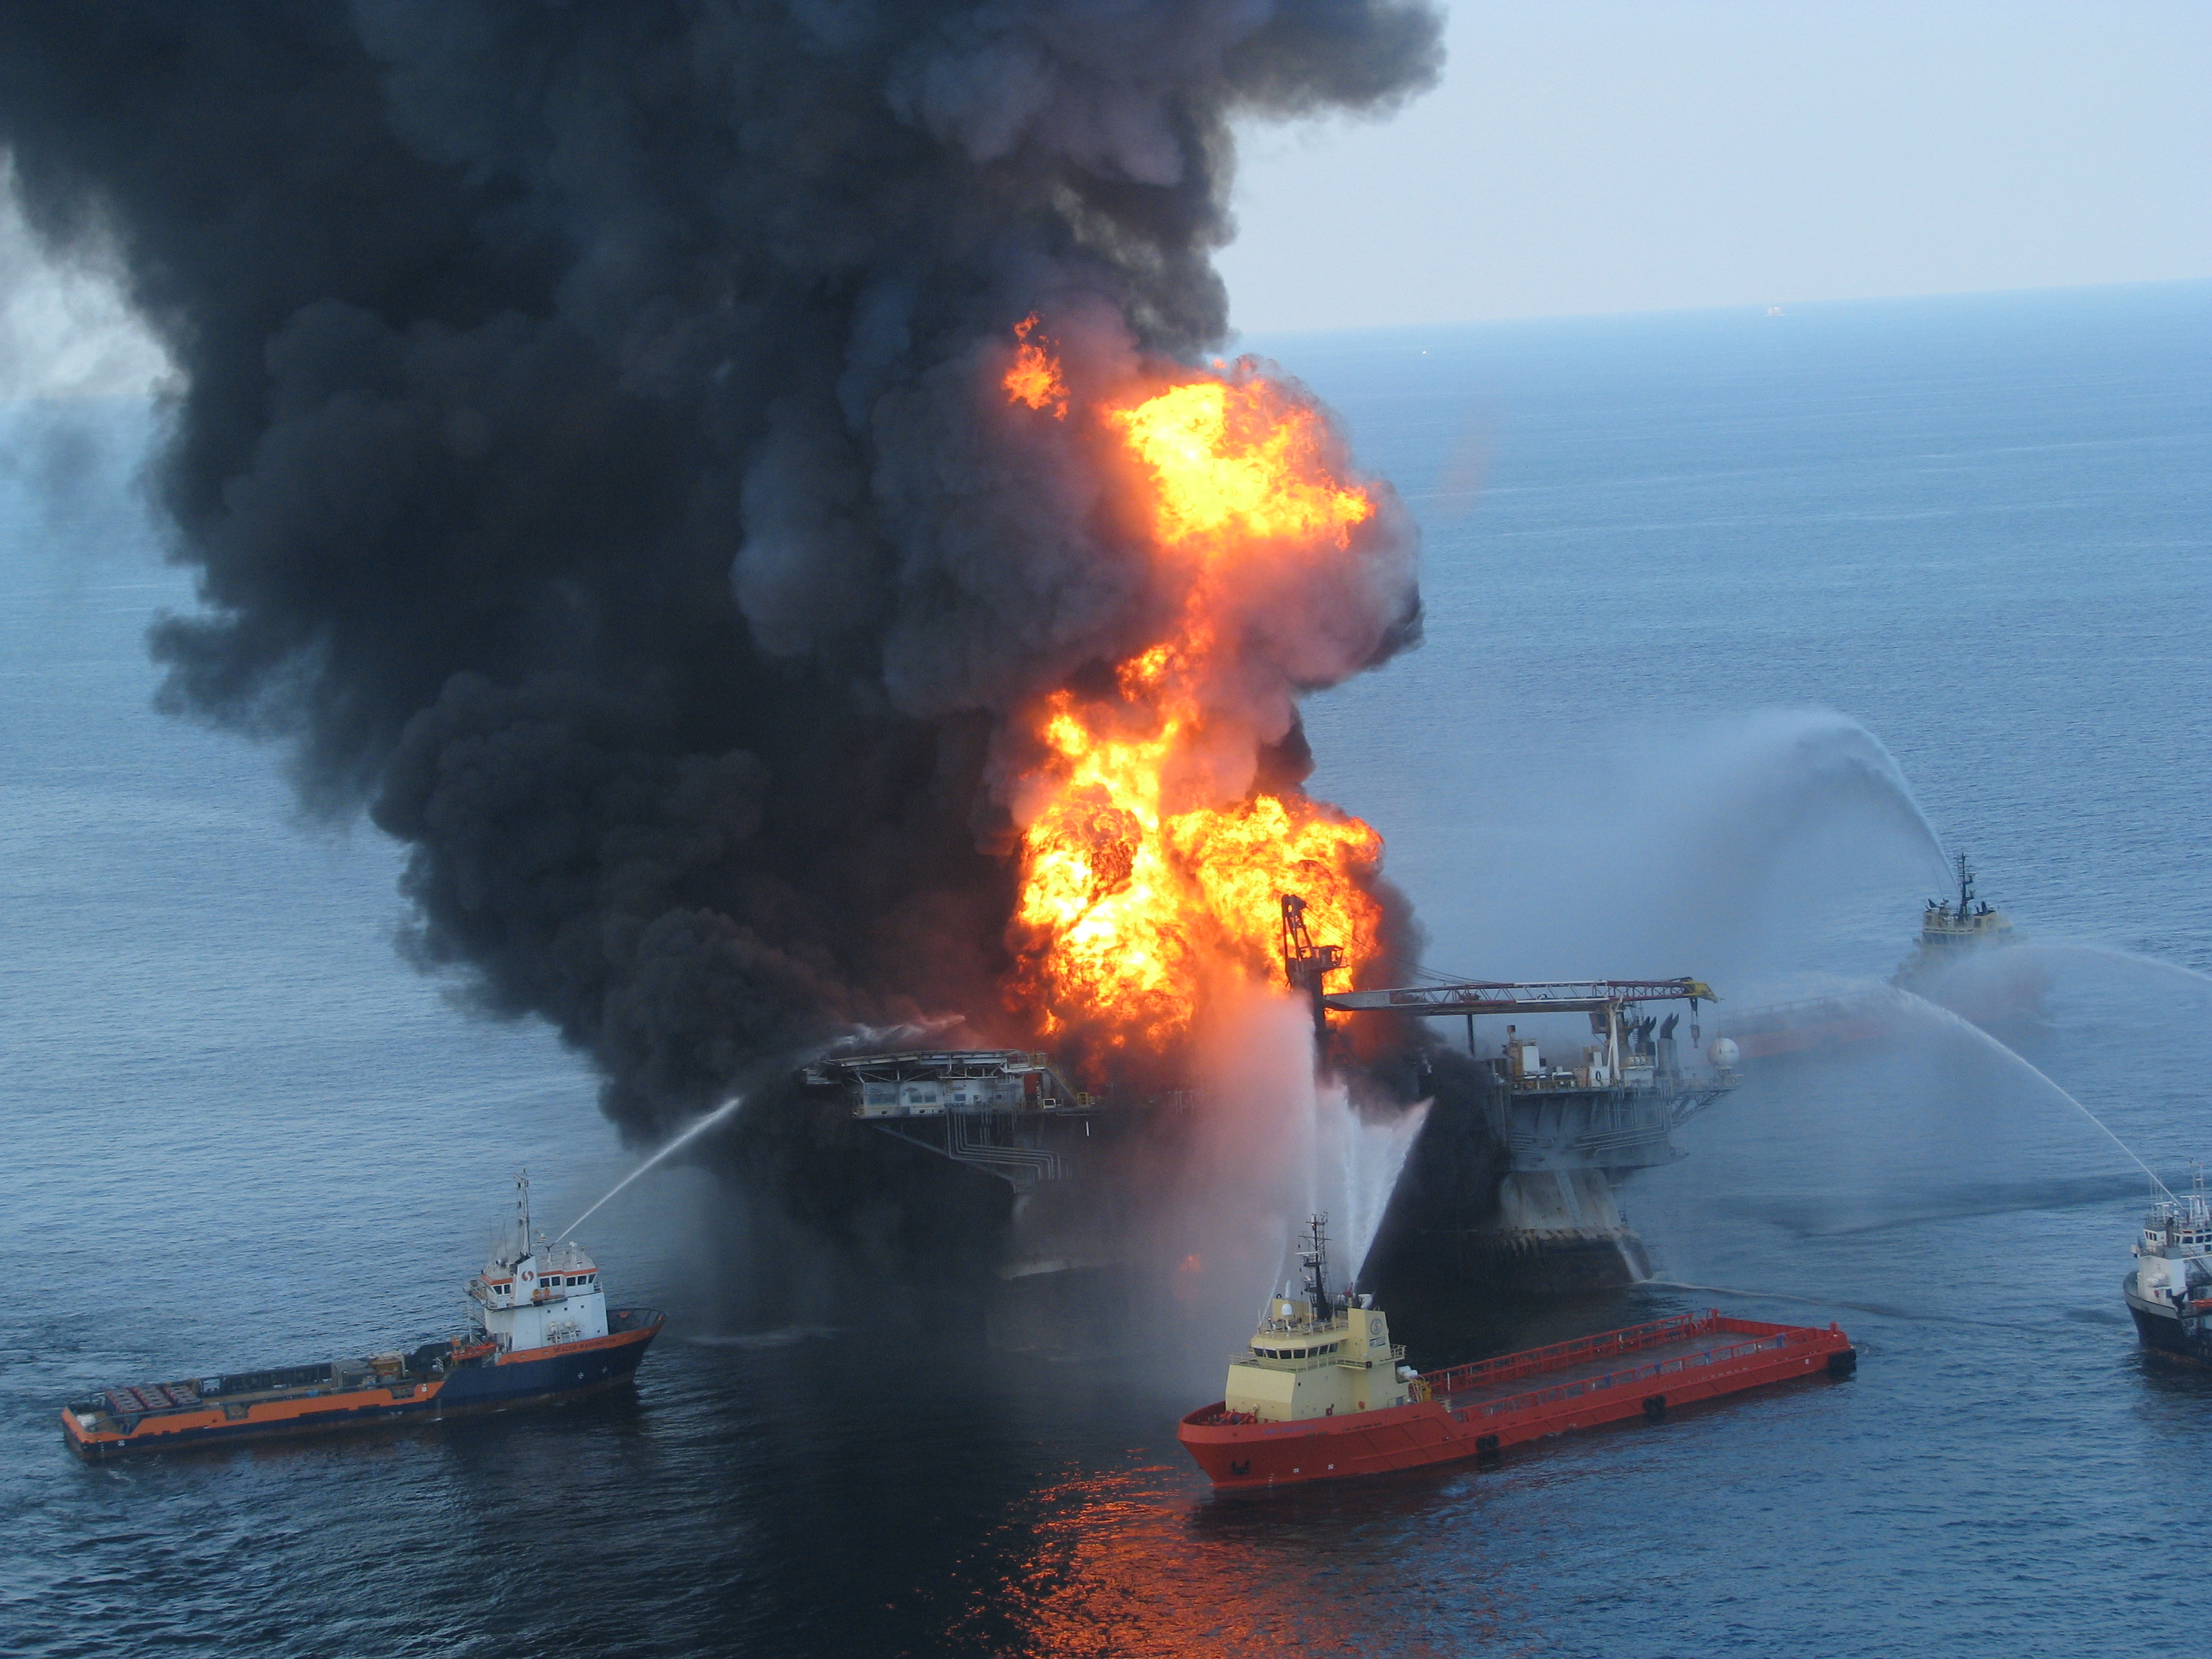
Figure \(\PageIndex{17}\): Deepwater Horizon Explosion Boats fighting the fire from an explosion at the Deepwater Horizon drilling rig in Gulf of Mexico offshore Louisiana on April 20, 2010. Source: United States Coast Guard via Wikimedia Commons
Physical Sources of Pollution
Trash, sediments, and thermal pollution arise from physical sources of pollution (figure \(\PageIndex{18}\)).
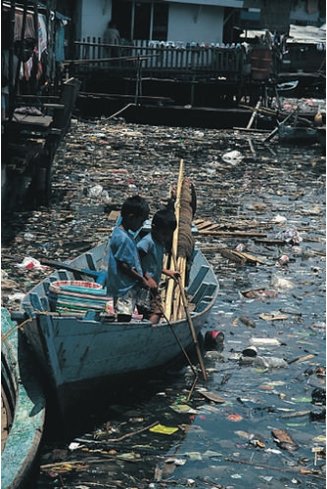
Figure \(\PageIndex{18}\): Water Pollution. Obvious water pollution in the form of floating debris; invisible water pollutants sometimes can be much more harmful than visible ones. Image by Stephen Codrington (CC-BY).
Thermal pollution occurs when water temperature exceeds its natural range. Many power plants (such as coal, natural gas, nuclear, etc.) rely on water from the environment for cooling. This water is released back into bodies of water at a higher temperature than usual. High temperature disrupt aquatic organisms for several reasons; one is that warmer waters cannot hold as much dissolved oxygen (see below; figure \(\PageIndex{19}\)). Dams can also raise water temperature to the detriment or the organisms that live there.
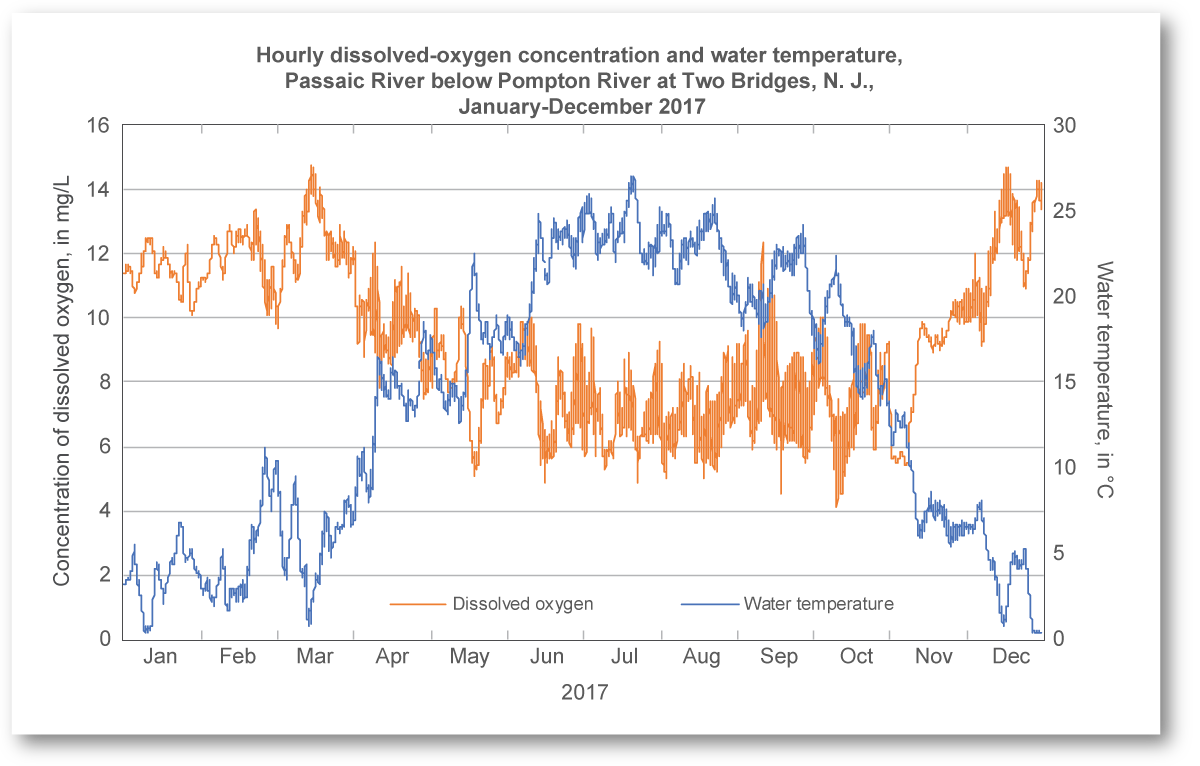
Figure \(\PageIndex{19}\): Water temperature affects dissolved oxygen concentrations in bodies of water. From January to December 2017, water temperature (blue) increases in summer months and then decreases. Dissolved oxygen levels (orange) dips in the summer when temperature increases. Image and caption (modified) from USGS (public domain).
Turbidity is the clouding of water due to sediment. It can be caused by excessive phytoplankton, algae growth, urban runoff, or sediments from erosion. These suspended particles, in addition to making the water look dirty, also help promote the toxins in water as heavy metals and toxic organic compounds can attach easily to the suspended sediment. These suspended particles also absorb heat from the sun, making turbid waters warmer. This also reduces the oxygen content in the water, as more oxygen is dissolved in colder waters. The suspended particles also scatter light, decreasing the photosynthetic activity of plants and algae, which results in a positive feedback loop for decreasing oxygen even more. Excess sediments enter bodies of water when various land uses, such as mining, deforestation, and agriculture increases erosion.
Other Water Quality Issues
Salt, typically sodium chloride, is a common inorganic contaminant. It can be introduced into groundwater from natural deposits or from anthropogenic sources like the salts applied to roads in the winter to keep ice from forming (figure \(\PageIndex{20}\)). Salt contamination can also occur from saltwater intrusion, where cones of depression around fresh groundwater pumping near ocean coasts induce the encroachment of saltwater into the freshwater body.
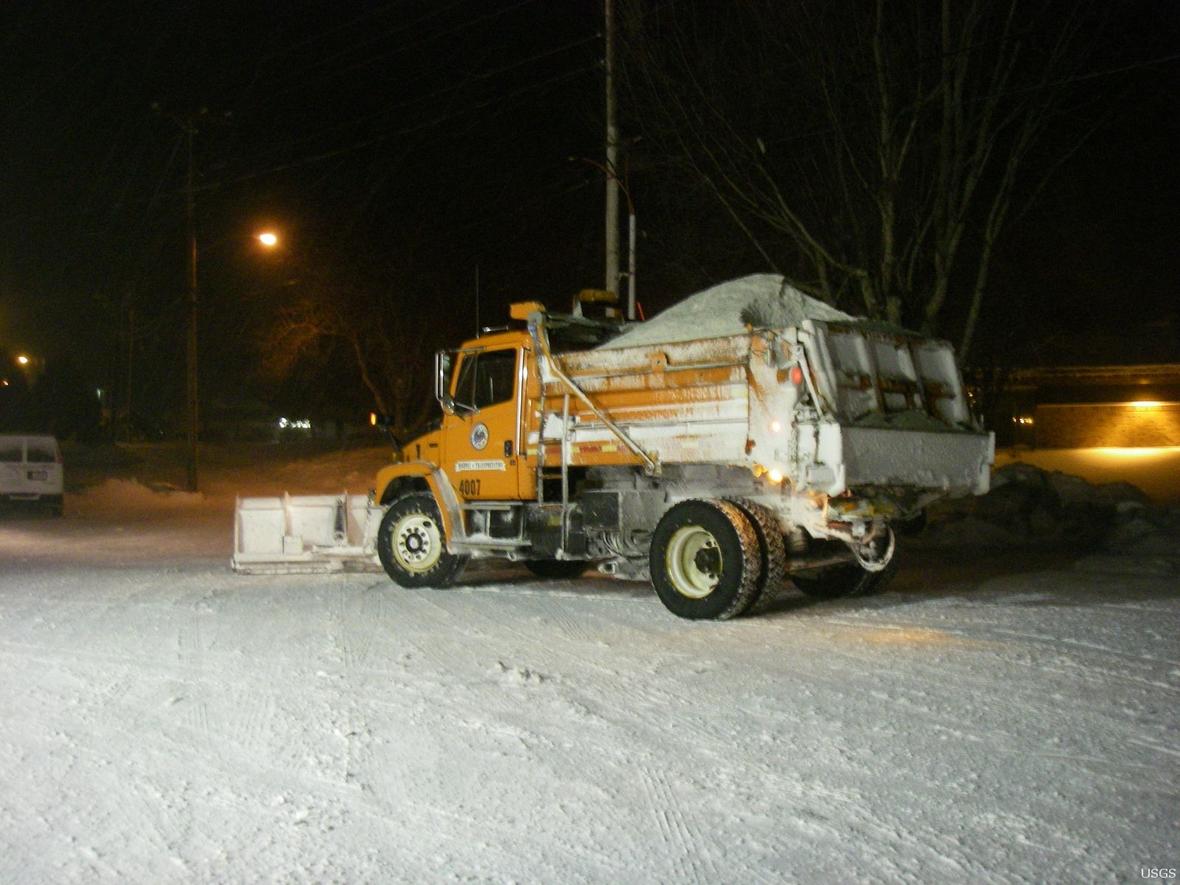
Figure \(\PageIndex{20}\): A snow plow and road salt application truck that is used to clear snow and ice from roadways for improving traffic and pedestrian safety. The use of salt to deice pavement can be harmful to aquatic life in urban streams. Image and caption (modified) from USGS (public domain).
The acidity or alkalinity of a body of water can also impact its quality. pH is a measure of the concentration of hydrogen ions (protons) in a solution, which determines how acidic or basic (alkaline) a solution is. Acidic solutions have a high hydrogen ion concentration and a pH less than 7, and basic solutions have a pH of greater than 7. The pH of freshwater usually ranges from 5 to 9, and saltwater is slightly basic (pH = 8.2) in a healthy ecosystem. When conditions are too acidic, some aquatic animals cannot reproduce, and calcium carbonate structures (clams, snails, corals, etc.) dissolve. Acid deposition and ocean acidification are two examples of pH changes in water bodies caused by anthropogenic activity.
Hard water contains abundant calcium and magnesium, which reduces its ability to develop soapsuds and enhances scale (calcium and magnesium carbonate minerals) formation on hot water equipment. Water softeners remove calcium and magnesium, which allows the water to lather easily and prevent the minerals from precipitating on surfaces (figure \(\PageIndex{21}\)). Hard water develops naturally from the dissolution of calcium and magnesium carbonate minerals in soil; it does not have negative health effects in people.

Figure \(\PageIndex{21}\): Overly hard water (high calcium content) can cause film on glassware. Image by Liz Meimann/Iowa State Univ. (public domain).
Biomagnification
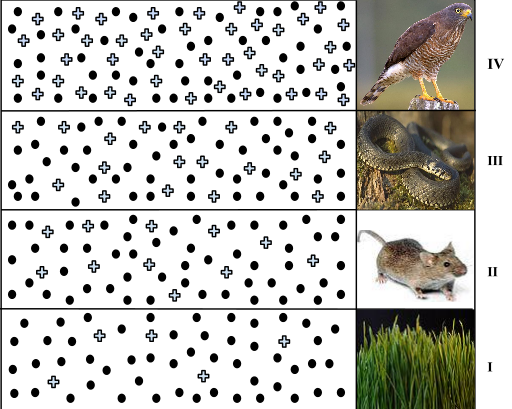
Biomagnification represents the processes in an ecosystem that cause greater concentrations of a persistent, toxic substances, in organisms higher up the food chain. Many substances have been shown to bioaccumulate, including classical studies with the pesticide dichlorodiphenyltrichloroethane (DDT), which was published in the 1960s bestseller, Silent Spring, by Rachel Carson. Other chemicals that exhibit biomagnification are methylmercury, PCBs, cadmium, lead, and arsenic. Mercury and methylmercury are present in only very small concentrations in seawater; however, at the base of the food chain algae absorb methylmercury. Then, small fish eat the algae, large fish and other organisms higher in the food chain eat the small fish, and so on. Fish and other aquatic organisms absorb methylmercury rapidly but eliminate it slowly from the body. Therefore, each step up the food chain increases the concentration from the step below (Figure \(\PageIndex{22-23}\)). Largemouth bass can concentrate methylmercury up to 10 million times over the water concentration and fish-eating birds can concentrate it even higher.
DDT was a commonly-used pesticide before its dangers became known. Figure \(\PageIndex{22}\) shows how DDT becomes concentrated in the tissues of organisms representing four successive trophic levels in a food chain. The concentration effect occurs because DDT is metabolized and excreted much more slowly than the nutrients that are passed from one trophic level to the next. So DDT accumulates in the bodies (especially in fat). Thus most of the DDT ingested as part of gross production is still present in the net production that remains at that trophic level. Thus, birds accumulated sufficient amounts of DDT to cause fragility in their eggshells which increased egg breakage during nesting, resulting in adverse effects on populations of predatory birds and scavengers (such as the California Condor). The use of DDT was banned in the United States in the 1970s.
Polychlorinated biphenyls (PCBs), which were used in coolant liquids in the United States until their use was banned in 1979. In a study performed by the National Oceanic and Atmospheric Administration (NOAA) in the Saginaw Bay of Lake Huron, PCB concentrations increased from the ecosystem’s primary producers (phytoplankton) through the different trophic levels of fish species (Figure \(\PageIndex{23}\)). The apex consumer (walleye) had more than four times the amount of PCBs compared to phytoplankton. Also, based on results from other studies, birds that eat these fish may have PCB levels at least one order of magnitude higher than those found in the lake fish.

Other concerns have been raised by the accumulation of heavy metals, such as mercury and cadmium, in certain types of seafood. The United States Environmental Protection Agency (EPA) recommends that pregnant women and young children should not consume any swordfish, shark, king mackerel, or tilefish because of their high mercury content. These individuals are advised to eat fish low in mercury: salmon, sardines, tilapia, shrimp, pollock, and catfish.
References
- http://www.nature.com/scitable/knowledge/library/eutrophication-causes-consequences-and-controls-in-aquatic-102364466
- www.globalpartnershipforocean...black-sea-blue
- http://oceanservice.noaa.gov/educati...intsource.html
- www2.epa.gov/nutrient-policy-data/cyanohabs
- http://dujs.dartmouth.edu/winter-2012/eutrophication-in-the-gulf-of-mexico-how-midwestern-farming-practices-are-creating-a-%E2%80%98dead-zone%E2%80%99#.VObsBFPF9fw
- http://water.epa.gov/type/watersheds/named/msbasin/zone.cfm
- http://water.epa.gov/type/watersheds...hypoxia101.cfm
- https://www.youtube.com/watch?<wbr/>v=rZFcLYqOxZQ
- http://1.bp.blogspot.com/-HAO2PgXGXd...ia+diagram.png
- http://www.nytimes.com/interactive/2...-map.html?_r=0
- http://www.wri.org/resource/interact...cation-hypoxia
- http://www.lenntech.com/eutrophicati...on-effects.htm
- http://www.lenntech.com/turbidity.htm
- Water for Life: Making it Happen (2005) World Health Organization and UNICEF. Retrieved from http://www.who.int/water_sanitation_health/waterforlife.pdf
- World Health Statistics (2010) World Health Organization. Retrieved from http://www.who.int/whosis/whostat/EN_WHS10_Full.pdf
Contributors and Attributions
Modified by Kyle Whittinghill and Melissa Ha from the following sources:
- Water Contamination from An Introduction to Geology by Johnson et al. (licensed under CC-BY-NC-SA)
- Water Pollution from Environmental Biology by Matthew R. Fisher (licensed under CC-BY)
- The Industrialization of Nature: A Modern History (1500 to the present), Water Pollution, and Case Study: The Love Canal Disaster from Sustainability: A Comprehensive Foundation by Tom Theis and Jonathan Tomkin, Editors. Download for free at CNX. (licensed under CC-BY)
- Essentials of Environmental Science by Kamala Doršner is licensed under CC BY 4.0
- Eutrophication from Oceanograpy by Hill et. al. University of California, Davis
- Biomagnification of Pesticides by John W. Kimball, is licensed CC BY
- Biological Magnification from General Microbiology at Boundless.com. License: CC BY-SA: Attribution-ShareAlike