
pKa_Mary_Caidon
- Page ID
- 39851
pKa 
pKa is defined as the negative log10 of the dissociation constant of an acid, its Ka.
pKa = -log10[Ka]
The pKa is a quantitative measure of how readily an acid gives up a proton to a solution and is thus a measure of the "strength" of the acid. Strong acids have a small pKa, weak acids have a larger pKa.
As noted, the carboxylic acid functional group R-COOH is found in many biomolecules. This functional group has a pKa between 2-4 in aqueous solution and is considered a weak acid. At many biologically relevant pH values, the carboxylic acid only partially dissociates into H+ cations and R-COO- anions. In a population of molecules containing the carboxylic acid functional group, it is not uncommon - at biologically relevant pH values - to simultaneously find molecules in both the protonated (R-COOH) and deprotonated (R-COO-) forms. By contrast, HCl (hydrogen chloride), a common strong acid, has a pKa << 0. This means that it will fully dissociate into H+ and Cl- at all biologically relevant pH values. HCl is a strong acid and will almost never be found in the protonated form.
One of the key ways we depict the difference between a strong acid or base and a weak acid or base in chemical equations is the use of a single arrow (strong acid/base) versus a double arrow (weak acid/base). The full dissociation of proton(s) from strong acids at equilibrium means that the likelihood of protons returning to the molecule they dissociated from is very small. The reaction goes mostly one way, hence the single arrow. In weak acids, the likelihood of the forward reaction happening is more similar to the likelihood of the reverse reaction happening. The consequence of this is partial dissociation at equilibrium, hence the double arrow in the chemical equation.
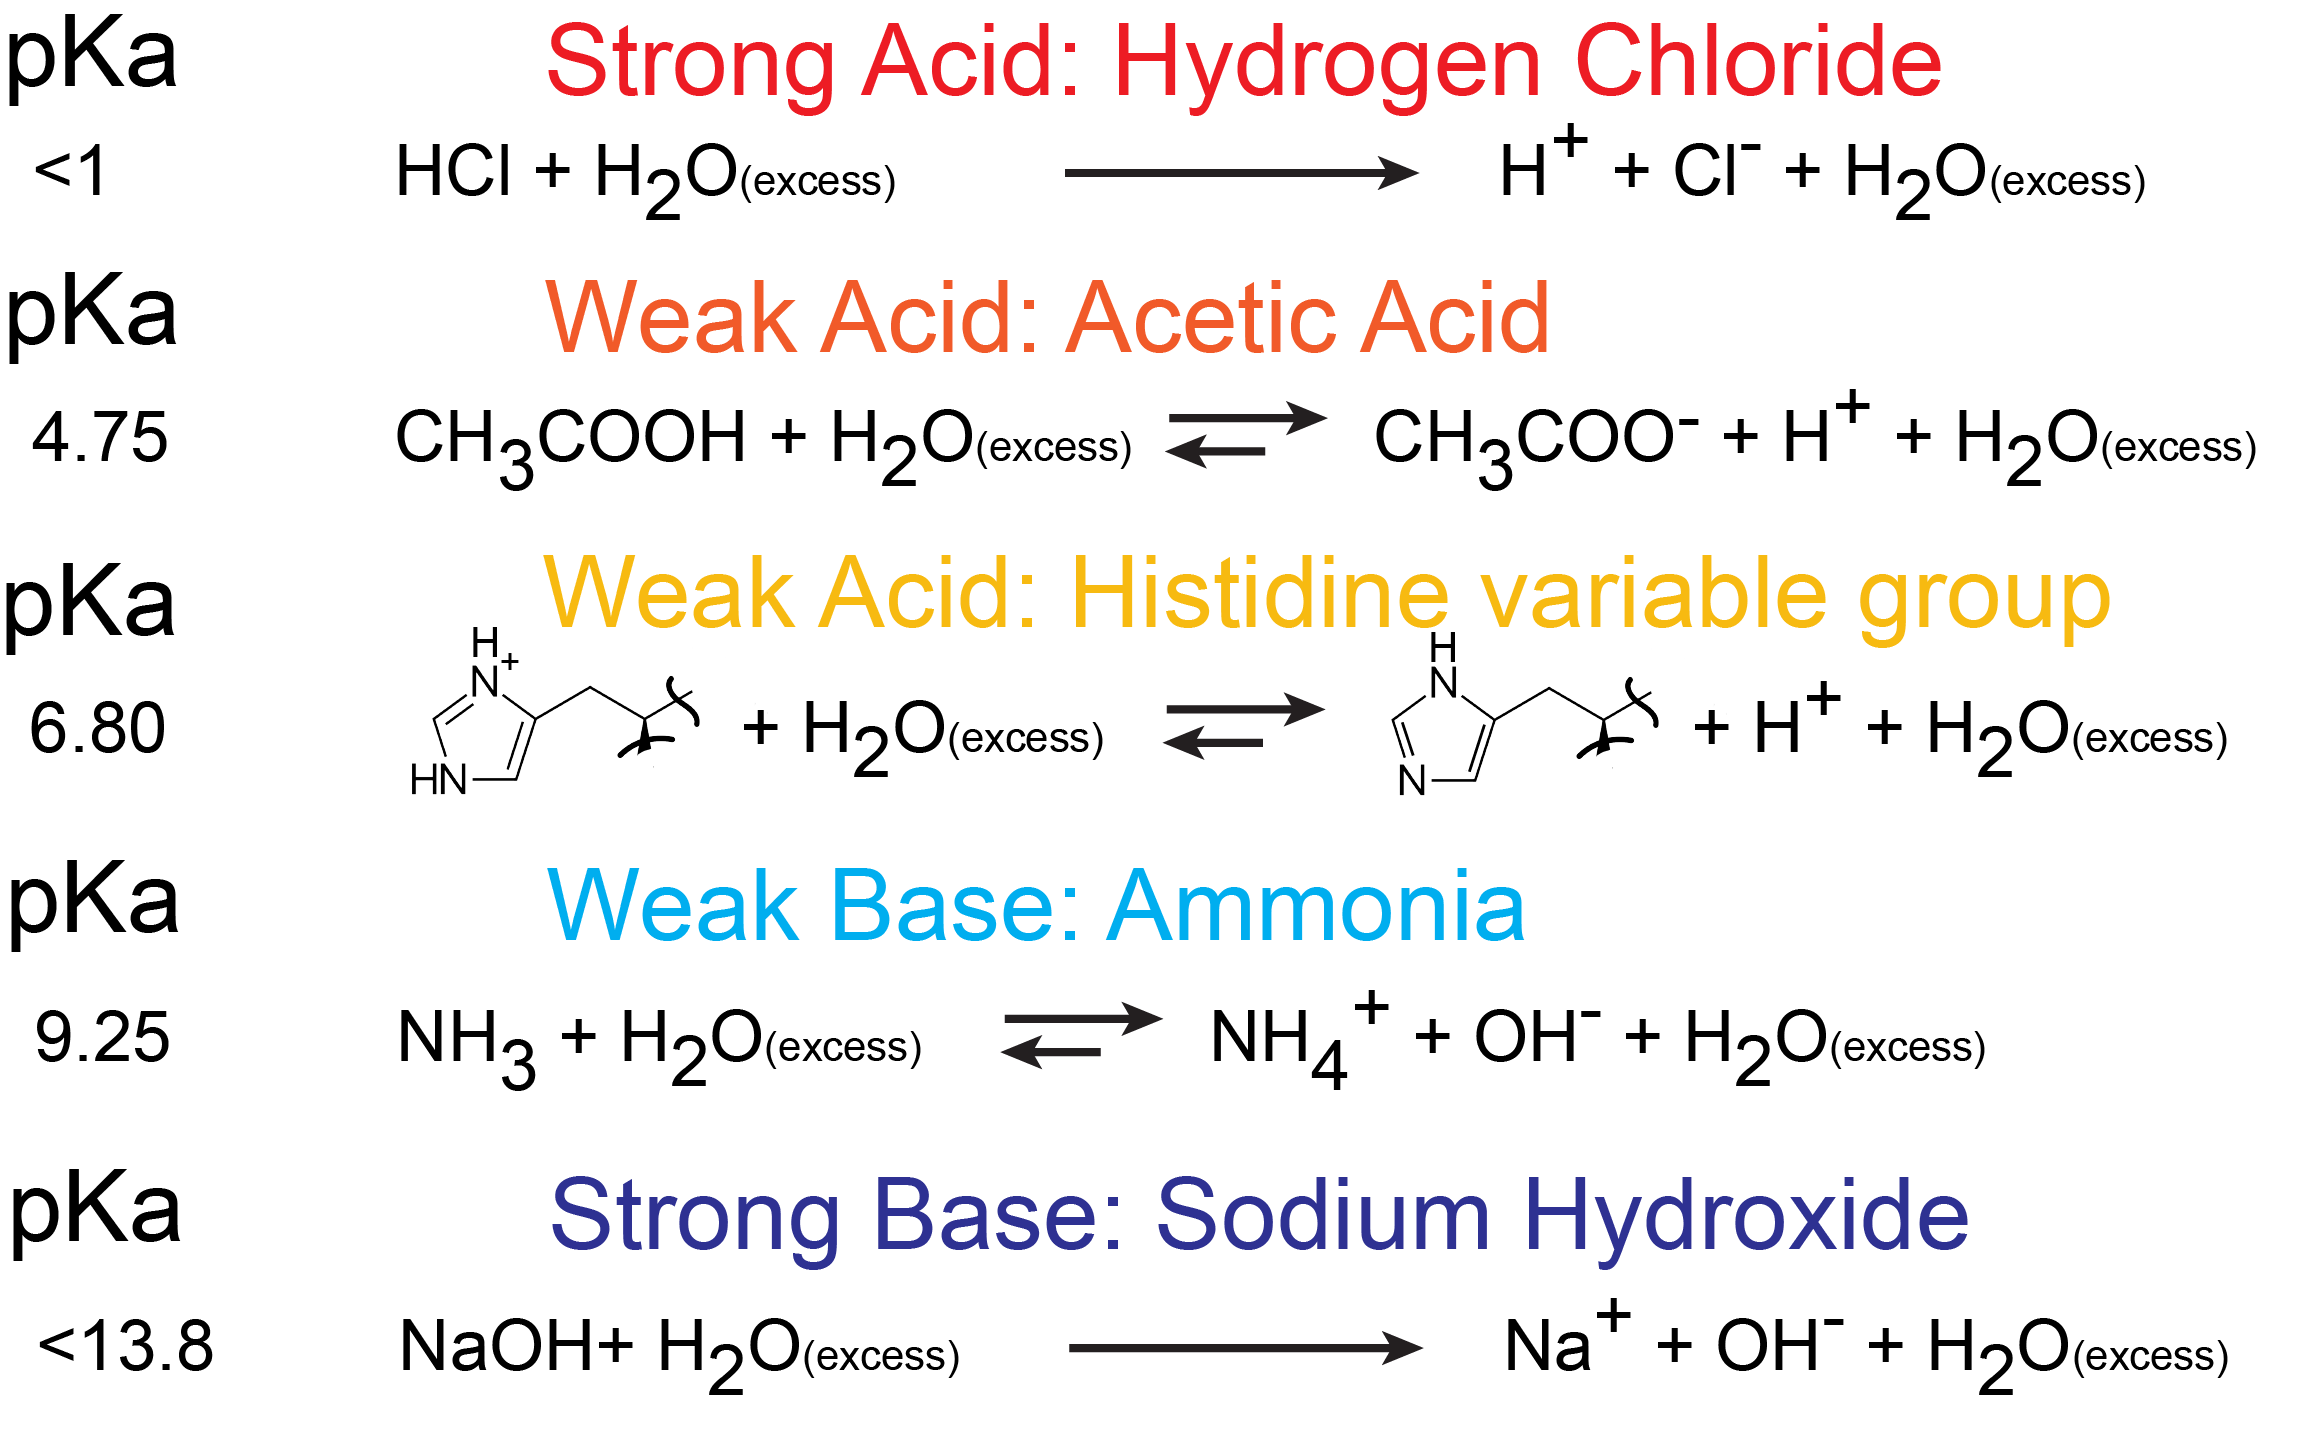
Figure 1. An example of strong acids, weak acids, strong bases, and weak bases in their biologically relevant protonated and deprotonated states. The value of their pKa is shown on the left. Attribution: Marc T. Facciotti.
In General Biology we ask you to relate pH and pKa to each other when discussing the protonation state of a weak acid or weak base in, for example, amino acids. How can we use the information given in this module to answer the question: Will the functional groups on the amino acid Glutamate be protonated or deprotonated at a pH of 2, at a pH of 8, or at a pH of 11?
To answer this kind of question, we need to create a relationship between pH and pKa. The relationship between pKa and pH is mathematically represented by the Henderson-Hasselbach equation shown below, where [A-] represents the deprotonated form of the acid and [HA] represents the protonated form of the acid.
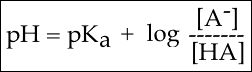
Figure 2. The Henderson-Hasselbach equation
This equation has three core "parts":
1. The pH;
2. The pKa; and
3. log10[A-]/[HA].
Part 1 tells you about the proton concentration. Part 2 tells you about a property of the acid - how likely it is to "give up" its protons to solution. Part 3 tells you about how much of the acid is in its deprotonated form [A-] and in its protonated form [HA]. In most experimental conditions we usually assume that the pKa doesn't change (after all, it's a property of the molecule). So, this equation tells us that the pH and the ratio of deprotonated [A-] and protonated [HA] form of the acid are related to one another. If you are able to independently control the pH by adding more acid or base, you can control the ratio of deprotonated [A-] and protonated [HA] forms of the acid. You can, of course, use the Henderson-Hasselbach equation to solve the problem of knowing the protonation state of Glutamate's functional groups at different pHs. However, we can also develop an intuition about the relationship between these three quantities.
Titrations can help develop an intuitive understanding
Another useful way to develop an intuitive understanding of the relationship between pH, pKa and the protonation states of functional groups is to think about the results of a titration. The titration experiment typically involves the slow, stepwise, and gradual addition of one reagent (e.g. Reagent #1) into a mixture of other molecules (e.g. Solution #1). The experimenter slowly adds Reagent #1 (independent variable) into Solution #1 and makes observations of one or more properties (dependent variables) of the mixture after every step. Depending on the reagents, observations can be things like a change in color, change in viscosity, change in taste, or change in pH. The experimental data is usually plotted in a graph with increasing Reagent #1 on the x-axis and the measured solution property (e.g pH, color, viscosity, etc.) plotted on the y-axis.
Interpreting a Titration Graph
Below is a graph showing the titration of a solution of acetic acid (Solution #1). Acetic acid, the acid found in vinegar, can also be represented by the chemical formula CH3COOH and contains a single carboxyl functional group. In this experiment, the acetic acid is titrated with a base, represented as “OH” (Reagent #1) in the figure. The graph when read from left to right reports the change in pH of the solution when base (OH) is slowly added. Examining the graph, you see three phases of pH change:
(a) Adding between 0 to about 3 equivalents of OH causes a rapid rise of the pH. At the molecular level, this rise can be explained by each additional base equivalent reacting with H3O+ to create two neutral water molecules. This reduces the [H+] and therefore increases the pH. At this pH, the molecule (CH3COOH) has the "strength" to hold onto its H+ ions.
(b) When between 3 and 7 equivalents of OH are added, the pH hardly changes; it stays stable around a value equivalent to the pKa of CH3COOH (4.76). In this zone of the chart, acetic acid molecules start to "let go" of their H+ ions when OH is added. Each OH added “grabs” a proton from solution which is replaced by a proton “released” by CH3COOH molecules in solution. When the pH = pKa (around 5 equivalents of OH-), the Henderson-Hasselbach equation tells us that 50% of the acetic acid molecules in solution are protonated and 50% are deprotonated. As more equivalents of OH are added, more acetic acid molecules become deprotonated until all acetic acid molecules become deprotonated.
(c) Once this happens, at 7 or more equivalents of OH, no more protonated molecules are available to neutralize added OH. Adding more OH therefore starts rapidly raising the pH again.
Building a mental picture of this process can be a powerful tool to help you intuitively solve the problem that started this discussion. If you want to intuit the protonation state of a functional group, with a known pKa, at a given pH, you can start by imagining the situation when the pH = pKa. At this point, you know that the functional group is 50% protonated and 50% deprotonated. Therefore, if the pH in question is below the pKa moving from the pH = pKa to the target pH requires adding protons to the solution. When the solution becomes more acidic, there will be more H+ ions ready to protonate deprotonated functional groups and thus increasing the amount of protonated functional groups. On the titration curve below, this is like starting at the center of the flat portion of the curve and moving to the left. When the target pH is higher than the pKa the solution must become more basic in the shift from the starting pH to the target pH. Here, there will be fewer H+ ions than at the beginning, meaning that the functional groups will start to deprotonate thus increasing the proportion of unprotonated functional groups.
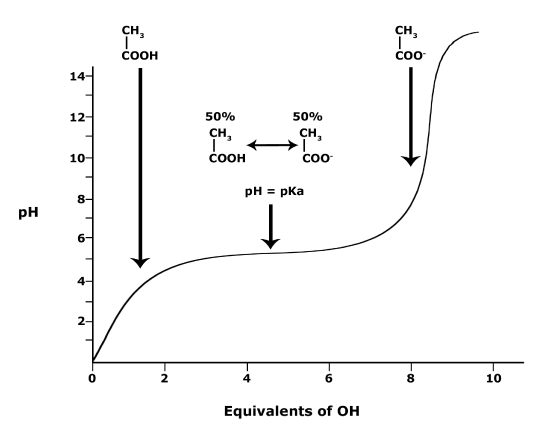
Figure 3. This graph depicts the protonation state of acetic acid as the pH changes. At a pH below the
This movie provides a visual demonstration of the explanation given above.
We close this section by returning to the original question: Will the functional groups on the amino acid glutamate be protonated or deprotonated at a pH of 2, at a pH of 8, at a pH of 11? In the example of acetic acid above, we developed an understanding of how to relate the protonation state of one functional group to its pKa and the pH of the solution its in to the balance/ratio of protonated to deprotonated state for a single functional group.
In biology, however, you will often be interested in the behavior of molecules with multiple functional groups, each with their own pKa values. An free amino acid like glutamate has three different functional groups, each with their own pKa. So, answering the question about the protonation state of glutamate at different pH values requires you to assess the protonation state and deprotonation state of each of those functional groups independently. The figure below shows a titration experiment for amino acid glutamate. Like the plot above, it shows the relationship between the pH and pKa for each of the three ionizable functional groups of glutamate. The protonation state of functional group can be evaluated independently at a specified pH value to ultimately determine the protonation state of the whole molecule.
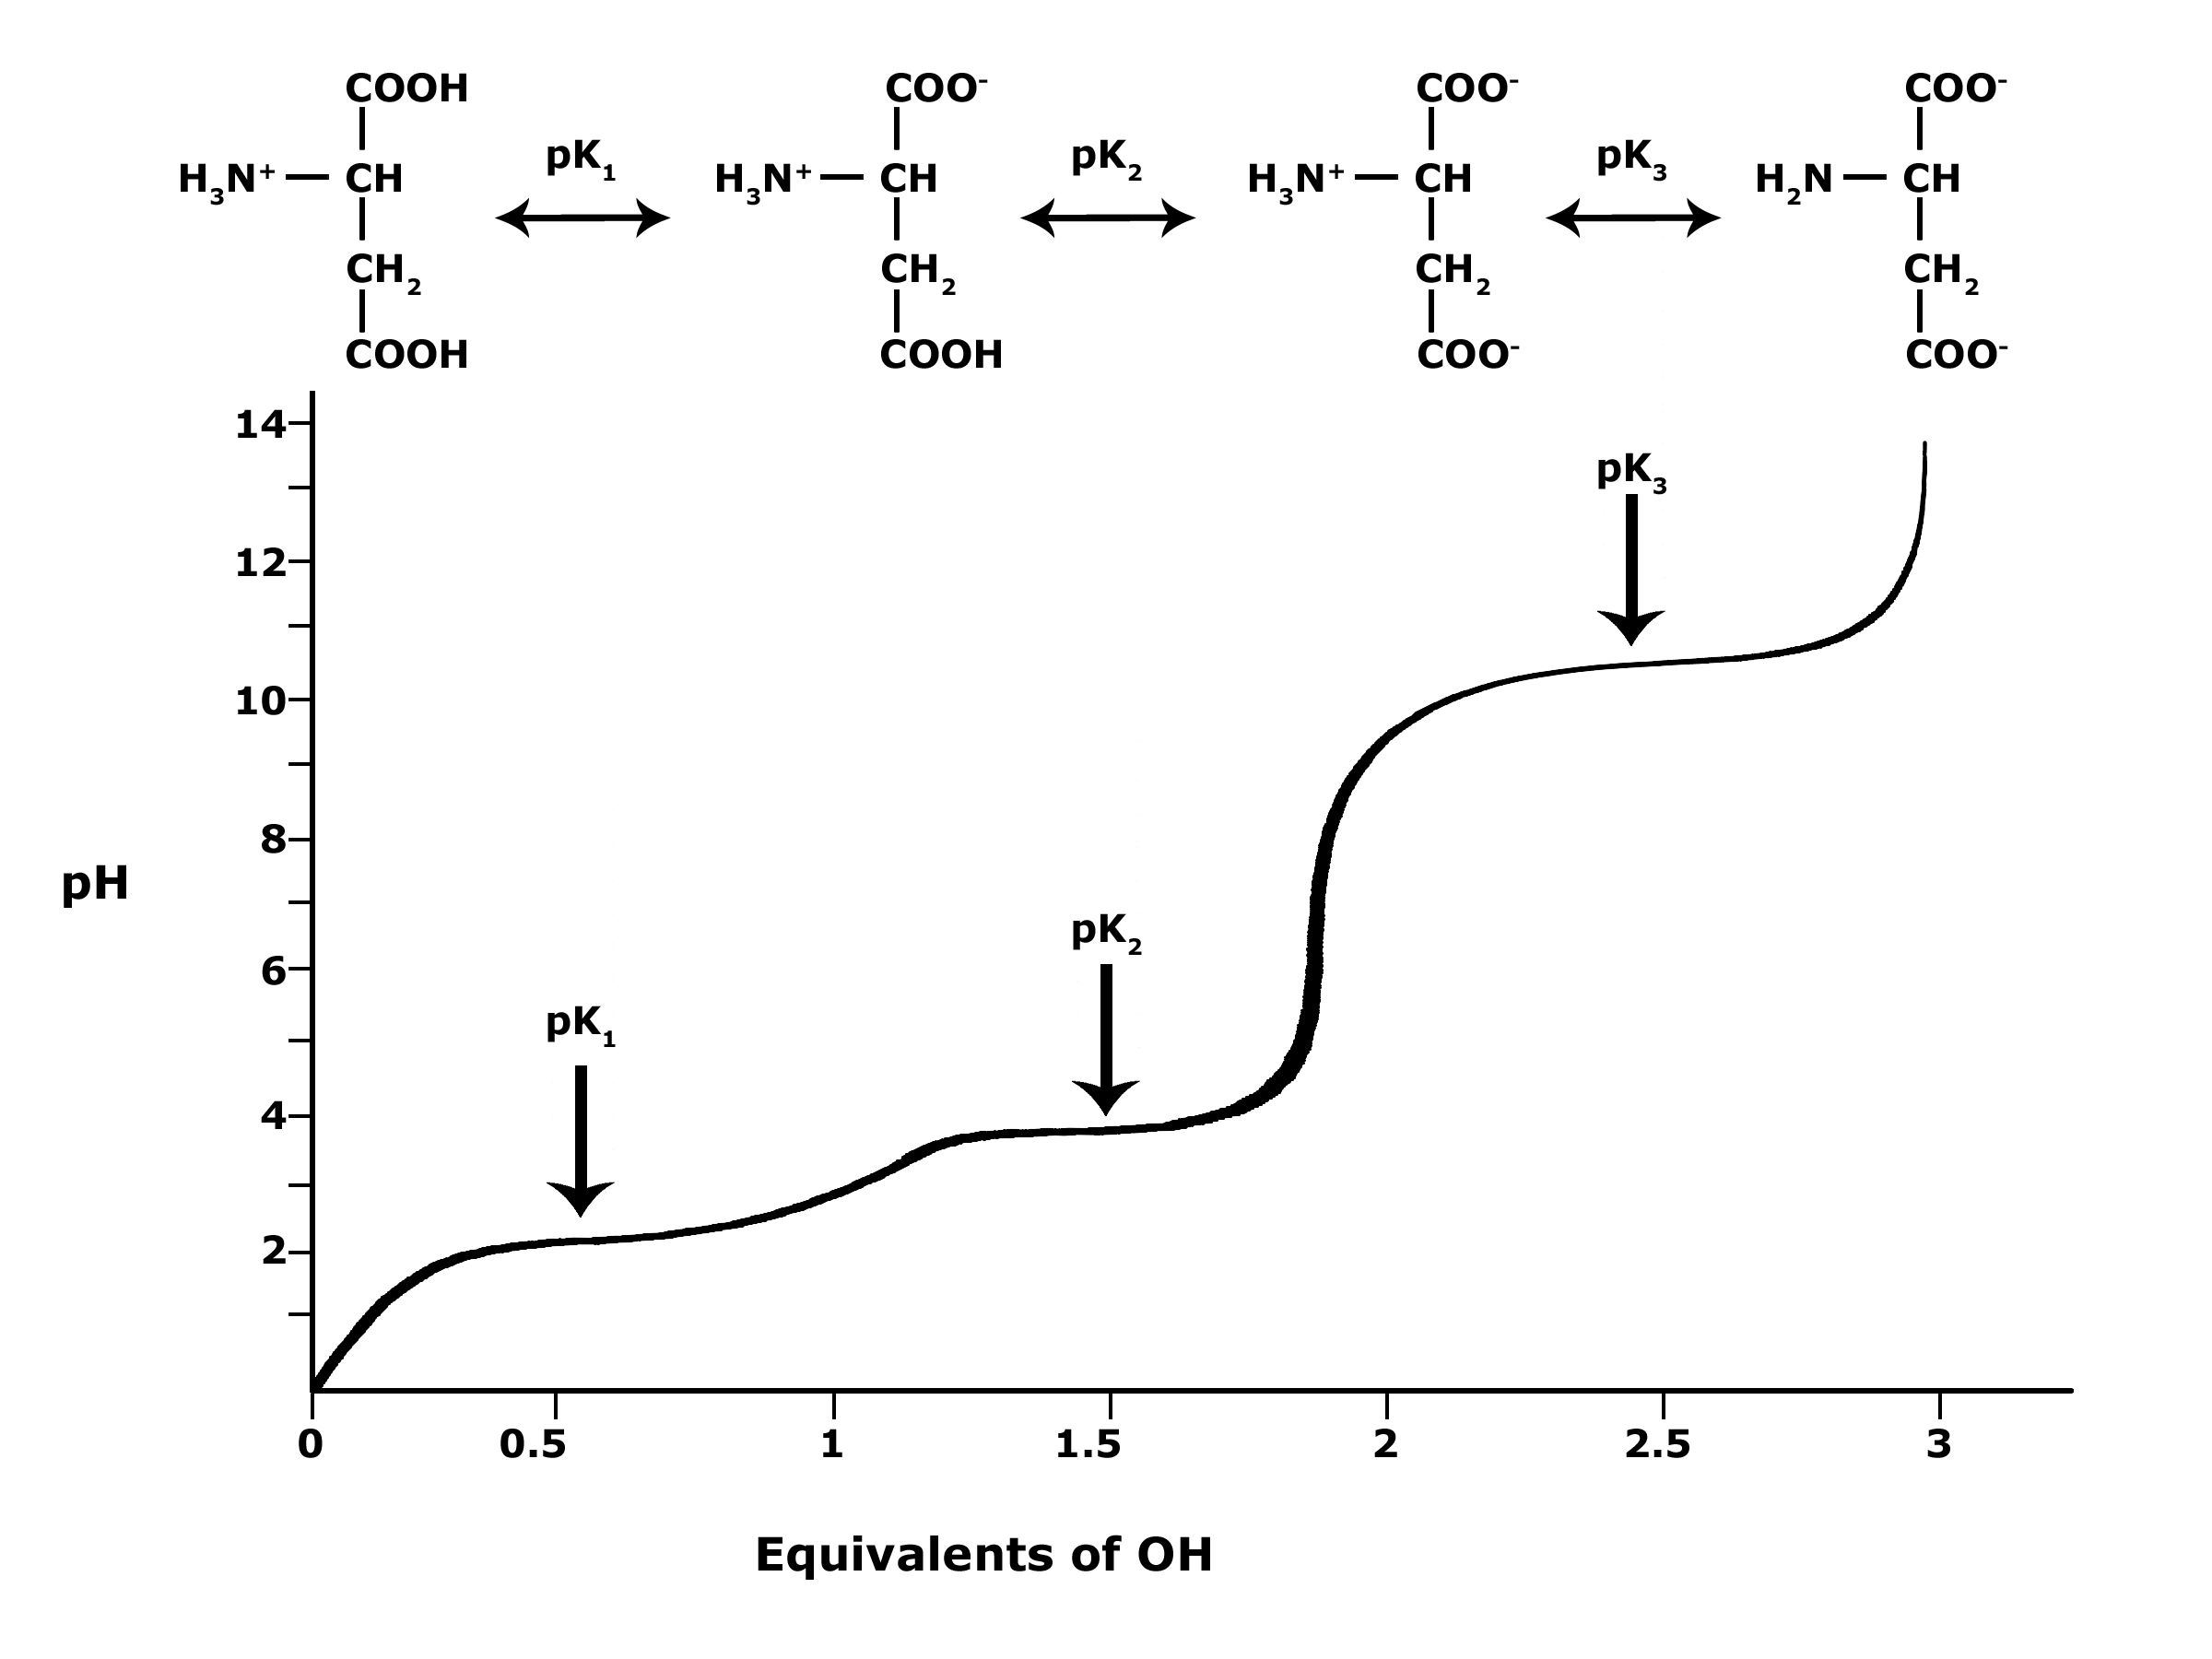
Figure 4. This graph depicts the protonation state of glutamate as the pH changes. At a pH below the pKa for each functional group on the amino acid, the functional group is protonated. At a pH above the pKa for the functional group it is deprotonated. If the pH equals the pKa, the functional group is 50% protonated and 50% deprotonated.
Attribution: Ivy Jose
Interactive Exercise
Quick Reference: pKa and pH Comparison Chart
| pKa | pH |
| pKa = -log10[Ka] | pH= −log10[H+] |
|
|
|
|
|
|
• While pKa depends largely on the physical properties of a molecule, it can also be influenced/changed by the local environment the molecule finds itself in. |
|