12.2.2: Tracking Infectious Diseases
- Last updated
- Save as PDF
- Page ID
- 42547
Learning Objectives
- Explain the research approaches used by the pioneers of epidemiology
- Explain how descriptive, analytical, and experimental epidemiological studies go about determining the cause of morbidity and mortality
Epidemiology has its roots in the work of physicians who looked for patterns in disease occurrence as a way to understand how to prevent it. The idea that disease could be transmitted was an important precursor to making sense of some of the patterns. In 1546, Girolamo Fracastoro first proposed the germ theory of disease in his essay De Contagione et Contagiosis Morbis, but this theory remained in competition with other theories, such as the miasma hypothesis, for many years (see What Our Ancestors Knew). Uncertainty about the cause of disease was not an absolute barrier to obtaining useful knowledge from patterns of disease. Some important researchers, such as Florence Nightingale, subscribed to the miasma hypothesis. The transition to acceptance of the germ theory during the 19th century provided a solid mechanistic grounding to the study of disease patterns. The studies of 19th century physicians and researchers such as John Snow, Florence Nightingale, Ignaz Semmelweis, Joseph Lister, Robert Koch, Louis Pasteur, and others sowed the seeds of modern epidemiology.
Pioneers of Epidemiology
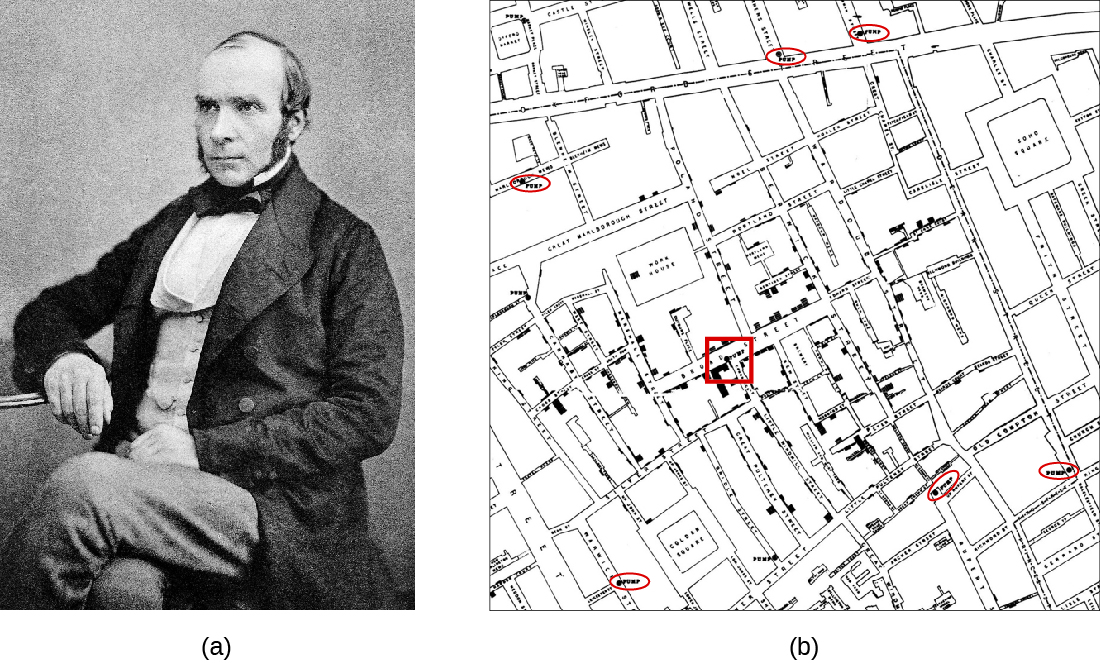
John Snow (Figure \(\PageIndex{1}\)) was a British physician known as the father of epidemiology for determining the source of the 1854 Broad Street cholera epidemic in London. Based on observations he had made during an earlier cholera outbreak (1848–1849), Snow proposed that cholera was spread through a fecal-oral route of transmission and that a microbe was the infectious agent. He investigated the 1854 cholera epidemic in two ways. First, suspecting that contaminated water was the source of the epidemic, Snow identified the source of water for those infected. He found a high frequency of cholera cases among individuals who obtained their water from the River Thames downstream from London. This water contained the refuse and sewage from London and settlements upstream. He also noted that brewery workers did not contract cholera and on investigation found the owners provided the workers with beer to drink and stated that they likely did not drink water.1 Second, he also painstakingly mapped the incidence of cholera and found a high frequency among those individuals using a particular water pump located on Broad Street. In response to Snow’s advice, local officials removed the pump’s handle,2 resulting in the containment of the Broad Street cholera epidemic.

Snow’s work represents an early epidemiological study and it resulted in the first known public health response to an epidemic. Snow’s meticulous case-tracking methods are now common practice in studying disease outbreaks and in associating new diseases with their causes. His work further shed light on unsanitary sewage practices and the effects of waste dumping in the Thames. Additionally, his work supported the germ theory of disease, which argued disease could be transmitted through contaminated items, including water contaminated with fecal matter.
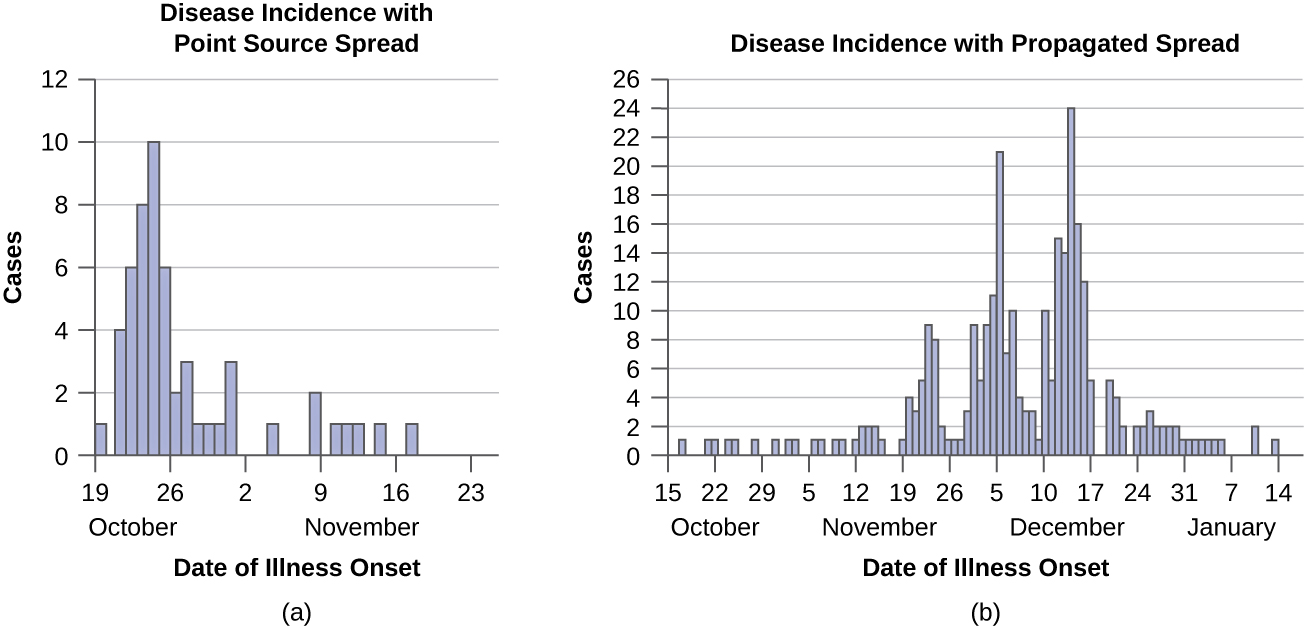
Snow’s work illustrated what is referred to today as a common source spread of infectious disease, in which there is a single source for all of the individuals infected. In this case, the single source was the contaminated well below the Broad Street pump. Types of common source spread include point source spread, continuous common source spread, and intermittent common source spread. In point source spread of infectious disease, the common source operates for a short time period—less than the incubation period of the pathogen. An example of point source spread is a single contaminated potato salad at a group picnic. In continuous common source spread, the infection occurs for an extended period of time, longer than the incubation period. An example of continuous common source spread would be the source of London water taken downstream of the city, which was continuously contaminated with sewage from upstream. Finally, with intermittent common source spread, infections occur for a period, stop, and then begin again. This might be seen in infections from a well that was contaminated only after large rainfalls and that cleared itself of contamination after a short period.
In contrast to common source spread, propagated spread occurs through direct or indirect person-to-person contact. With propagated spread, there is no single source for infection; each infected individual becomes a source for one or more subsequent infections. With propagated spread, unless the spread is stopped immediately, infections occur for longer than the incubation period. Although point sources often lead to large-scale but localized outbreaks of short duration, propagated spread typically results in longer duration outbreaks that can vary from small to large, depending on the population and the disease (Figure \(\PageIndex{2}\)). In addition, because of person-to-person transmission, propagated spread cannot be easily stopped at a single source like point source spread.

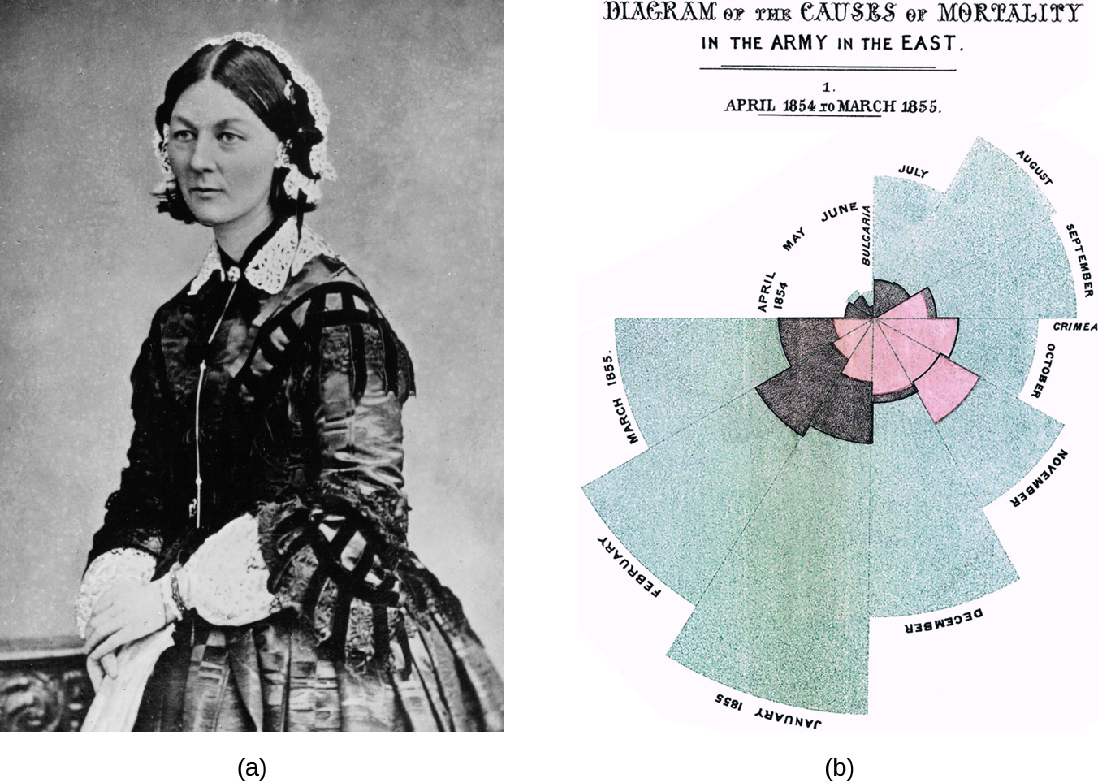
Florence Nightingale’s work is another example of an early epidemiological study. In 1854, Nightingale was part of a contingent of nurses dispatched by the British military to care for wounded soldiers during the Crimean War. Nightingale kept meticulous records regarding the causes of illness and death during the war. Her recordkeeping was a fundamental task of what would later become the science of epidemiology. Her analysis of the data she collected was published in 1858. In this book, she presented monthly frequency data on causes of death in a wedge chart histogram (Figure \(\PageIndex{3}\)). This graphical presentation of data, unusual at the time, powerfully illustrated that the vast majority of casualties during the war occurred not due to wounds sustained in action but to what Nightingale deemed preventable infectious diseases. Often these diseases occurred because of poor sanitation and lack of access to hospital facilities. Nightingale’s findings led to many reforms in the British military’s system of medical care.
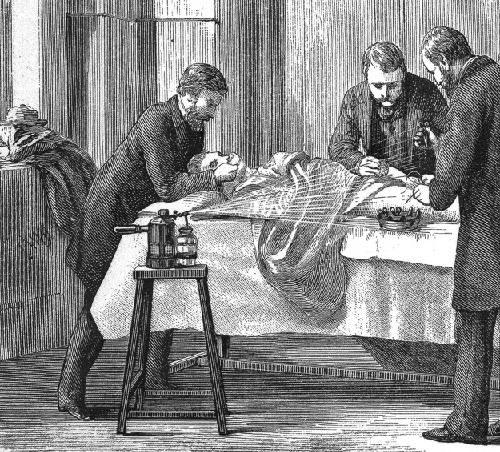
Joseph Lister provided early epidemiological evidence leading to good public health practices in clinics and hospitals. These settings were notorious in the mid-1800s for fatal infections of surgical wounds at a time when the germ theory of disease was not yet widely accepted (see Foundations of Modern Cell Theory). Most physicians did not wash their hands between patient visits or clean and sterilize their surgical tools. Lister, however, discovered the disinfecting properties of carbolic acid, also known as phenol (see Using Chemicals to Control Microorganisms). He introduced several disinfection protocols that dramatically lowered post-surgical infection rates.3 He demanded that surgeons who worked for him use a 5% carbolic acid solution to clean their surgical tools between patients, and even went so far as to spray the solution onto bandages and over the surgical site during operations (Figure \(\PageIndex{4}\)). He also took precautions not to introduce sources of infection from his skin or clothing by removing his coat, rolling up his sleeves, and washing his hands in a dilute solution of carbolic acid before and during the surgery.


Link to Learning
John Snow’s own account of his work has additional links and information.
This CDC resource further breaks down the pattern expected from a point-source outbreak.
Learn more about Nightingale’s wedge chart here.
Exercise \(\PageIndex{1}\)
- Explain the difference between common source spread and propagated spread of disease.
- Describe how the observations of John Snow, Florence Nightingale, and Joseph Lister led to improvements in public health.
Types of Epidemiological Studies
Today, epidemiologists make use of study designs, the manner in which data are gathered to test a hypothesis, similar to those of researchers studying other phenomena that occur in populations. These approaches can be divided into observational studies (in which subjects are not manipulated) and experimental studies (in which subjects are manipulated). Collectively, these studies give modern-day epidemiologists multiple tools for exploring the connections between infectious diseases and the populations of susceptible individuals they might infect.
Observational Studies
In an observational study, data are gathered from study participants through measurements (such as physiological variables like white blood cell count), or answers to questions in interviews (such as recent travel or exercise frequency). The subjects in an observational study are typically chosen at random from a population of affected or unaffected individuals. However, the subjects in an observational study are in no way manipulated by the researcher. Observational studies are typically easier to carry out than experimental studies, and in certain situations they may be the only studies possible for ethical reasons.
Observational studies are only able to measure associations between disease occurrence and possible causative agents; they do not necessarily prove a causal relationship. For example, suppose a study finds an association between heavy coffee drinking and lower incidence of skin cancer. This might suggest that coffee prevents skin cancer, but there may be another unmeasured factor involved, such as the amount of sun exposure the participants receive. If it turns out that coffee drinkers work more in offices and spend less time outside in the sun than those who drink less coffee, then it may be possible that the lower rate of skin cancer is due to less sun exposure, not to coffee consumption. The observational study cannot distinguish between these two potential causes.
There are several useful approaches in observational studies. These include methods classified as descriptive epidemiology and analytical epidemiology. Descriptive epidemiology gathers information about a disease outbreak, the affected individuals, and how the disease has spread over time in an exploratory stage of study. This type of study will involve interviews with patients, their contacts, and their family members; examination of samples and medical records; and even histories of food and beverages consumed. Such a study might be conducted while the outbreak is still occurring. Descriptive studies might form the basis for developing a hypothesis of causation that could be tested by more rigorous observational and experimental studies.
Analytical epidemiology employs carefully selected groups of individuals in an attempt to more convincingly evaluate hypotheses about potential causes for a disease outbreak. The selection of cases is generally made at random, so the results are not biased because of some common characteristic of the study participants. Analytical studies may gather their data by going back in time (retrospective studies), or as events unfold forward in time (prospective studies).
Retrospective studies gather data from the past on present-day cases. Data can include things like the medical history, age, gender, or occupational history of the affected individuals. This type of study examines associations between factors chosen or available to the researcher and disease occurrence.
Prospective studies follow individuals and monitor their disease state during the course of the study. Data on the characteristics of the study subjects and their environments are gathered at the beginning and during the study so that subjects who become ill may be compared with those who do not. Again, the researchers can look for associations between the disease state and variables that were measured during the study to shed light on possible causes.
Analytical studies incorporate groups into their designs to assist in teasing out associations with disease. Approaches to group-based analytical studies include cohort studies, case-control studies, and cross-sectional studies. The cohort method examines groups of individuals (called cohorts) who share a particular characteristic. For example, a cohort might consist of individuals born in the same year and the same place; or it might consist of people who practice or avoid a particular behavior, e.g., smokers or nonsmokers. In a cohort study, cohorts can be followed prospectively or studied retrospectively. If only a single cohort is followed, then the affected individuals are compared with the unaffected individuals in the same group. Disease outcomes are recorded and analyzed to try to identify correlations between characteristics of individuals in the cohort and disease incidence. Cohort studies are a useful way to determine the causes of a condition without violating the ethical prohibition of exposing subjects to a risk factor. Cohorts are typically identified and defined based on suspected risk factors to which individuals have already been exposed through their own choices or circumstances.
Case-control studies are typically retrospective and compare a group of individuals with a disease to a similar group of individuals without the disease. Case-control studies are far more efficient than cohort studies because researchers can deliberately select subjects who are already affected with the disease as opposed to waiting to see which subjects from a random sample will develop a disease.
A cross-sectional study analyzes randomly selected individuals in a population and compares individuals affected by a disease or condition to those unaffected at a single point in time. Subjects are compared to look for associations between certain measurable variables and the disease or condition. Cross-sectional studies are also used to determine the prevalence of a condition.
Experimental Studies
Experimental epidemiology uses laboratory or clinical studies in which the investigator manipulates the study subjects to study the connections between diseases and potential causative agents or to assess treatments. Examples of treatments might be the administration of a drug, the inclusion or exclusion of different dietary items, physical exercise, or a particular surgical procedure. Animals or humans are used as test subjects. Because experimental studies involve manipulation of subjects, they are typically more difficult and sometimes impossible for ethical reasons.
Koch’s postulates require experimental interventions to determine the causative agent for a disease. Unlike observational studies, experimental studies can provide strong evidence supporting cause because other factors are typically held constant when the researcher manipulates the subject. The outcomes for one group receiving the treatment are compared to outcomes for a group that does not receive the treatment but is treated the same in every other way. For example, one group might receive a regimen of a drug administered as a pill, while the untreated group receives a placebo (a pill that looks the same but has no active ingredient). Both groups are treated as similarly as possible except for the administration of the drug. Because other variables are held constant in both the treated and the untreated groups, the researcher is more certain that any change in the treated group is a result of the specific manipulation.
Experimental studies provide the strongest evidence for the etiology of disease, but they must also be designed carefully to eliminate subtle effects of bias. Typically, experimental studies with humans are conducted as double-blind studies, meaning neither the subjects nor the researchers know who is a treatment case and who is not. This design removes a well-known cause of bias in research called the placebo effect, in which knowledge of the treatment by either the subject or the researcher can influence the outcomes.
Exercise \(\PageIndex{2}\)
- Describe the advantages and disadvantages of observational studies and experimental studies.
- Explain the ways that groups of subjects can be selected for analytical studies.
Clinical Focus: Part 3
Since laboratory tests had confirmed Salmonella, a common foodborne pathogen, as the etiologic agent, epidemiologists suspected that the outbreak was caused by contamination at a food processing facility serving the region. Interviews with patients focused on food consumption during and after the Thanksgiving holiday, corresponding with the timing of the outbreak. During the interviews, patients were asked to list items consumed at holiday gatherings and describe how widely each item was consumed among family members and relatives. They were also asked about the sources of food items (e.g., brand, location of purchase, date of purchase). By asking such questions, health officials hoped to identify patterns that would lead back to the source of the outbreak.
Analysis of the interview responses eventually linked almost all of the cases to consumption of a holiday dish known as the turducken—a chicken stuffed inside a duck stuffed inside a turkey. Turducken is a dish not generally consumed year-round, which would explain the spike in cases just after the Thanksgiving holiday. Additional analysis revealed that the turduckens consumed by the affected patients were purchased already stuffed and ready to be cooked. Moreover, the pre-stuffed turduckens were all sold at the same regional grocery chain under two different brand names. Upon further investigation, officials traced both brands to a single processing plant that supplied stores throughout the Florida panhandle.
Exercise \(\PageIndex{3}\)
- Is this an example of common source spread or propagated spread?
- What next steps would the public health office likely take after identifying the source of the outbreak?
Key Concepts and Summary
- Early pioneers of epidemiology such as John Snow, Florence Nightingale, and Joseph Lister, studied disease at the population level and used data to disrupt disease transmission.
- Descriptive epidemiology studies rely on case analysis and patient histories to gain information about outbreaks, frequently while they are still occurring.
- Retrospective epidemiology studies use historical data to identify associations with the disease state of present cases. Prospective epidemiology studies gather data and follow cases to find associations with future disease states.
- Analytical epidemiology studies are observational studies that are carefully designed to compare groups and uncover associations between environmental or genetic factors and disease.
- Experimental epidemiology studies generate strong evidence of causation in disease or treatment by manipulating subjects and comparing them with control subjects.
Footnotes
- John Snow. On the Mode of Communication of Cholera. Second edition, Much Enlarged. John Churchill, 1855.
- John Snow. “The Cholera near Golden-Wquare, and at Deptford.” Medical Times and Gazette 9 (1854): 321–322. http://www.ph.ucla.edu/epi/snow/chol...densquare.html.
- O.M. Lidwell. “Joseph Lister and Infection from the Air.” Epidemiology and Infection 99 (1987): 569–578. www.ncbi.nlm.nih.gov/pmc/arti...00006-0004.pdf.


