
Lab 8 Muscle Physiology Measures of Strength Development & Fatigue
- Page ID
- 53334
Learning Objectives:
At the end of the lab each student will be asked to:
1) Determine the differences in strength development between subjects based on gender and between the concepts of “dominance” of use.
2) Observe, record, and correlate relative amount of total motor unit recruitment that occurs within a muscle group with increased strength production.
3) Distinguish between mechanical (peripheral) fatigue and cognitive (central) fatigue.
Pre-Lab:
1) What is the importance of a recovery period of 5-minutes for each participant?
2) What principle explains why strength increases when recruiting larger fibers in the muscle?
3) Complete your hypothesis to test in the lab.
Introduction:
Skeletal muscle is an excitable tissue made of several tubular cells (muscle fibers) that form a cylindrical collection of tissues (fascicles). These fascicles run the length of the muscle from the tendon of origin to the tendon of insertion see figure 1. Additionally, skeletal muscles possess unique characteristics. Skeletal muscles are voluntarily controlled tissue (needs nervous system control, whether the control is conscious or not) and exhibit electrical characteristics that make the tissues irritable (can change its membrane potential when stimulated). These two features enable us to explain the basis for the function of skeletal muscle through what is generally referred to as the excitation-contraction coupling of strength production. Additionally, skeletal muscle tissue is contractile (able to shorten when electrically stimulated), extensible (able to stretch beyond its resting length), elastic (able to return to its original shape), and plastic (able to change to meet new demands for strength, power, or work production). The principle of contractility, elasticity and extensibility explains how active (actin and myosin) and passive (connective proteins) forces form the tension within the fascicles and motor units of the skeletal muscle that results in the visible morphological changes of a muscle during active force production. The sequence events in force production, that leads to ever greater response from the muscle fiber, is based on a continuum of responses within the fascicles and motor units beginning with a twitch (due to a single contraction episode), and with continuous excitation progresses through Treppe effect (as the summation events occur within the fascicles and between motor units due to repeated excitations), eventually leading to the full muscle Tetany (whole muscle contraction) based on the pattern of recruitment, figure 2.
|
Figure 1. Anatomy of the skeletal muscle displaying the pattern of tissue interaction and divisions of the functional units of the muscle. |

|
Figure 2. The relationship between timing stimulation and the contraction strength (mechanical force) development within a muscle fiber based on the Treppe effect leading to tetany of contraction that we normally associate as a muscle contraction. |

Since the process of formation of a muscular contraction is under voluntary control and can be modified by cognitive desire or focus. As such, a person modulates the recruitment, and strength produced, from a muscle thereby leading to greater, or reduced, strength production based on desire for strength. All activity along the path of voluntary control is due to the excitation-contraction coupling between the skeletal muscle and the motor neuron that innervates that skeletal muscle’s motor end plate, all of which begins with the release of neurotransmitter acetylcholine (ACh) onto the skeletal muscle which leads to whole muscle fiber depolarization to threshold of stimulus and initiates the contraction of the muscle gaster. The way this interaction occurs is through the motor unit, single motor neuron and all fibers it innervations. Within each of muscle there will be a varying number of motor units (m.u.); the total number of m.u. within the muscle is dependent upon the type of muscle and the type of movement that is being controlled. Generally, the finer (more dexterous) the motor movement, the greater number of m.u. are involved (fewer muscle fibers per motor neuron) in the recruitment, while less motor control fewer units (fewer motor neurons per muscle fiber) in the recruitment.
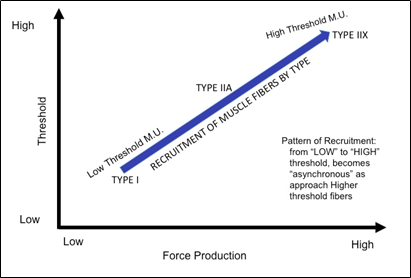
When developing contractile strength, units are selectively recruited based on a continuum of threshold for excitation (the Size Principle) from the lowest, easy to recruit, to the highest, hardest to recruit, threshold based on the amount of strength development necessary, figure 3. This pattern of recruitment is developed in relation to the diameter of the muscle fiber, with the larger cross-sectional area providing a greater strength capacity but also needing a higher level of stimulation to cause excitation of the membrane. This concept is referred to as Henneman’s size principle. Each muscle fiber is being recruited along a gradient of a threshold potential reached by the individual muscle fibers within the muscle gaster, see figure 4. The selection of recruitment for different m.u. will proceed to meet the demand for strength production in such a way that a continuous contraction can be maintained throughout the length of the muscle for the duration of contraction time, referred to as the time under tension. This pattern of contraction within the muscle is based on the recruitment of individual muscle fibers beginning from the central region of the muscle gaster and traversing laterally until the entire recruited muscle is contracting to meet the demand. Because of the plasticity that muscles show, as you learn to recruit the muscle to produce a desired level of strength, you alter the way that you recruit the muscle. Where instead of recruiting throughout the continuum, you only recruit what is needed at any point in time within the contraction for that amount of strength.
|
Figure 3. Graphical representation of the generalized pattern of recruitment of motor units of skeletal muscles based on fiber type, activation threshold, and force production capacity of the fiber type and motor units based on Henneman’s size principle.
|
|
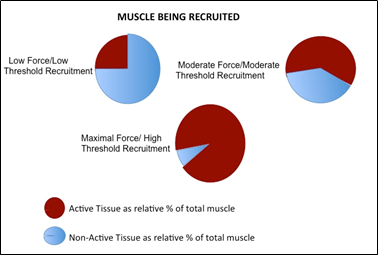
Figure 4. Overview of the relative activation/non-activation of skeletal muscle tissue) based excitation to match the demand for strength along with the relative threshold of activation of the motor unit within the skeletal muscle being recruited based on Henneman’s size principle. |
The pattern of recruitment throughout the muscle can be measured not only by the elicited motion, but also through the electrical activity at the muscle during activation, known as electromyography (EMG). This analysis of electrical activity gives insight into the amount of muscle recruitment that occurs during periods of rest versus periods of maximal and near maximal force production. For most clinical situations, such EMG analysis is performed via surface electrodes placed near the origin and insertion tendons of single muscles or groups of muscles. These electrodes do two things: 1) record the change in electrical activity across the muscle and 2) indicate the relative amount of muscle being recruited in relation to either the external load being applied, or the stimulation of a motor neuron linked with a nerve conduction velocity test. When coupled with a recording of force production (via dynamometry), this gives a clinician an integrated level of data to determine the amount of muscle being recruited and thus the maximal volitional contraction (MVC). This understanding of MVC provides both clinician and patient with an understanding of differential recruitment during biofeedback within a course of neurological treatment, and, in addition, provides insight into the course of degeneration and atrophy that accompanies many degenerative neurological diseases.
A combination of muscle contraction patterns is involved in most EMG studies. Typically, they involve the use of a prolonged isometric (no movement) contraction. The use of the isometric contraction allows for the recruitment of various m.u. to provide the constant state of tension throughout the length of contraction time. This graph of force production is generally noted by a gradual “ramping up” to “plateau” to rapid “ramping down” graph of strength, see figure 5. In creating this graph, the individual and clinician obtain an understanding of recruitment, as well understanding the general order of fiber recruitment based on the fundamentals of the size principle. This pattern of recruitment and graph will mirror the continuum of increasing force production and the inverse relationship with respect to time needed to fatigue the fibers.
|
Figure 5. Graphical representation of the isometric contraction based on the time of contraction and the maximal force.
|

Additionally, discussion of any unit must also find the rate of twitch formation, i.e. slow-twitch and fast-twitch. Twitch formation describes the rate that the excitation-contraction coupling occurs, or how quickly the binding sites on the actin become exposed once exposed to calcium (Ca++) ions and the movement of the myosin heads. The rate of twitch formation within the muscle fiber will be influenced by the metabolic process utilized to regenerate ATP necessary for the contraction. When combined, the relative thresholds, the twitch speed and the metabolic process for regenerating ATP gives rationale to how the continuum of motor units seen within the size principle and the progressive loss of strength that is demonstrated in sustained isometric contractions. As those small fibers and units have a low force capacity but is long to fatigue whereas the larger fibers and units that have high force capacity but are quick to fatigue. The skeletal muscle is thus recruited to provide the force for movement with the smaller fibers and unit continually recruited and the progressively larger ones being selectively and intermittently recruited to meet the requirement for the activity and relative to the level of fatigue, see figure 6.
|
Figure 6. Description of the relationship between muscle fiber recruitment relative to the maximal force production (%1RM) and time to fatigue. |

There are key aspects to responses noted in relation to EMG studies. First, there is often a relationship that shows that men are able to produce greater force than women. This gender difference is based on a) the larger muscle mass that men tend to have compared to women, and b) the basal level of testosterone and integrated testosterone response to periods of exertion leading to greater muscle excitation. Second, the cognitive involvement controlling the recruitment of the skeletal muscle means that changing cognitive involvement (or encouragement) to develop the skeletal muscle force will modulate. As such, EMG activity, force development and time to fatigue can all be adjusted; where fatigue is any reduction of force capacity across the muscle from the level of force produced at the beginning of the sustained contraction. This fatigue in contraction is based on several aspects of muscle anatomy and physiology. There is only a limited concentration of ATP within the skeletal muscle of the body (enough to perform less than a few seconds of cellular activities) and as ATP is required to sustain the energetics of the muscle contraction it must be regenerated, regardless of the type of motor unit being recruited. It begins with the use of the ATP-cP pathway and then progresses into catabolism of molecules to provide the free energy required to regenerate ATP for the cell. The very moment that the skeletal muscle changes to the use of catabolism for ATP regeneration, the muscle has entered fatigue (as there is a delay in the cycle of ATP to allow for muscle contraction to continue). This reduction of force capacity continues as the catabolic pathways of energetics proceeds into what are called the aerobic pathways. This is not due to the “accumulation of metabolic wastes” but instead due to the smaller fibers that are being recruited for force production, see figure 6. Since the aerobic pathways require a high concentration of oxygen within the cell, these aerobic muscle fibers must remain relatively close to the capillaries within the skeletal muscle and thus have a limited CSA. As there is less CSA, these fiber types have a lower force capacity than the large fibers that were being recruited at the maximal level of force production; resulting in the progressive decrease in force from the maximum that is seen in sustained “isometric” contractions. Along with this issue of ATP regeneration comes the idea of cognitive recruitment (i.e. central drive) and cognitive withdrawal from exercise (i.e. central fatigue). When performing sustained contractions, these central issues focus on the sensation of wanting to do the activity. Central fatigue is due to several factors: changes in the muscle morphology (microdamage from the contraction), accumulation of heat within the muscle (byproduct of metabolic processes not being 100% efficient), or even boredom. It is not due to what some text ascribes to accumulation of metabolites (most discuss lactate, which is shuttled out of the fiber and transported to other tissues) or restriction of blood flow (which does occur but only after extremely prolonged, whole gaster isometric contraction), figure 7. More importantly, when there is high self-efficacy, or external motivation for the exertion, central drive will override many peripheral signals that would normally lead to central fatigue and allow for prolonged sustained contraction at moderately elevated levels from the point where fatigue first is noticed.
|
Figure 7. Feedback initiating muscle inhibition leading to the onset of fatigue through reduced activation and recruitment of the muscle due to the accumulation of metabolic wastes, intracellular damage and alteration of temperature following sustained muscle contraction. |

Strength Comparison
Along with examining the changes in strength that occurs during sustained contractions, we can also use isometric contractions for comparison of strength between individuals. In this case, we will examine how strength of contractions can vary based on the use of the limb (i.e. dominant versus non-dominant hand) as well as between genders (i.e. males versus females). In these comparisons there are several concepts of muscle physiology that are important to recall. First of which is related to the concept of the S.A.I.D. (Specific Adaptations to Imposed Demands) principle and muscle adaptations that will occur with greater use. Based on this principle, the more often we use a muscle or pattern of recruitment within the muscle, more efficient we are at recruiting the muscle and the larger the muscle will become (hypertrophy). As such, the more used a muscle is the greater the work and strength capacity the muscle will exhibit. Therefore, one might expect that the dominant hand would be more efficiently recruited than the non-dominant hand in the analysis of the handgrip strength leading to lower EMG recordings at relatively the same level of strength seen in the non-dominant hand. Secondly, there are gender differences in muscle cross-sectional areas stemming from residual effects of higher levels of testosterone. As such, males tend to have higher latent strength capacity than females. These gender differences are noted in the standardized grip-strengths used to establish aspects of fitness for individuals. Additionally, using these normative we can also gradate how individual compare to the whole population, table 1. In which, lower (i.e. “weaker”) handgrip is associated with poor musculoskeletal fitness and linked with impaired health status issues associated with overfatness. From which one can evaluate and determine one aspect of their overall relative fitness. Within these normative values, secondary demographic aspects of muscle physiology can be seen, as grip strength reduces (along with overall musculoskeletal fitness) with age. Studies show that among men, peak values of 49–52 kg/cm2 are reached in the fourth decade of life, whereas females exhibit peak values of 31 kg/cm2 in third to fourth decade. In which these demographic differences can be attributed to sarcomere and muscle fascicle CSA, use and disuse of digital flexors and overall robustness of anabolic and growth signals across the life span. Moreover, based on differences in growth signals and responses to use and disuse it would not be surprising to see those that regularly stress the muscles (i.e. physical activity and recruitment of the muscle) to exhibit higher levels of strength, S.A.I.D. principle adaptations, relative to those muscles less regularly recruited.
Table 1. Grip strength (kg/cm2) norms and classifications for musculoskeletal fitness by age and gender.
|
Age (year) |
Gender |
Grip Strength |
||
|
“Weak” |
“Normal” |
“Strong” |
||
|
18-19 |
Female |
< 19.2 kg/cm2 |
19.2-31.0 kg/cm2 |
> 31.0 kg/cm2 |
|
Male |
< 35.7 kg/cm2 |
35.7-55.5 kg/cm2 |
> 55.5 kg/cm2 |
|
|
20-24 |
Female |
< 21.5 kg/cm2 |
21.5-35.3 kg/cm2 |
> 35.3 kg/cm2 |
|
Male |
< 36.8 kg/cm2 |
36.8-56.6 kg/cm2 |
> 56.6 kg/cm2 |
|
|
25-29 |
Female |
< 25.6 kg/cm2 |
25.6-41.4 kg/cm2 |
> 41.4 kg/cm2 |
|
Male |
< 37.7 kg/cm2 |
37.7-57.5 kg/cm2 |
> 57.5 kg/cm2 |
|
|
30-34 |
Female |
< 21.5 kg/cm2 |
21.5-35.3 kg/cm2 |
> 35.3 kg/cm2 |
|
Male |
< 36.0 kg/cm2 |
36.0-55.8 kg/cm2 |
> 55.8 kg/cm2 |
|
|
35-39 |
Female |
< 20.3 kg/cm2 |
20.3-34.1 kg/cm2 |
> 34.1 kg/cm2 |
|
Male |
< 35.8 kg/cm2 |
35.8-55.6 kg/cm2 |
> 55.6 kg/cm2 |
|
|
40-44 |
Female |
< 18.9 kg/cm2 |
18.9-32.7 kg/cm2 |
> 32.7 kg/cm2 |
|
Male |
< 35.5 kg/cm2 |
35.5-55.3 kg/cm2 |
> 55.3 kg/cm2 |
|
|
45-49 |
Female |
< 18.6 kg/cm2 |
18.6-32.4 kg/cm2 |
> 32.4 kg/cm2 |
|
Male |
< 34.7 kg/cm2 |
34.7-54.5 kg/cm2 |
> 54.5 kg/cm2 |
|
|
50-54 |
Female |
< 18.1 kg/cm2 |
18.1-31.9 kg/cm2 |
> 31.9 kg/cm2 |
|
Male |
< 32.9 kg/cm2 |
32.9-50.7 kg/cm2 |
> 50.7 kg/cm2 |
|
Thus, the purpose of the experiment is to examine the aspects of strength development and fatigue of forearm flexors. In which we will examine the relationship between strength and fatigue based on the gender of the participants (male/female), regularity of having to lift a heavy object each day, days of weight training (resistance training) per week, and age. In this we will have a secondary purpose of examining the role that central drive has on the development and then maintaining of maximal contraction.
References:
Aagaard P. 2004. Making muscles “stronger”: exercise, nutrition, drugs. J Musculoskelet Neuronal Interact. 4(2). 165-174.
Clark JE, Rompolski K, Comstock BA. 2018. Rethinking how we talk about and teach muscle fatigue. HAPS Educator 22(3).229-241.
Henneman E, Olson CB. 1965. Relations between structure and functions in design of skeletal muscles. J Neurophysiol. 28; 581-598.
Henneman E. 1985. The size-principle: a deterministic output emerges from a set of probabilistic connections. J. Exp. Biol. 115; 105-112
Keener J, Sneyd J. ED. 2009. Ch. 15: Muscle, from Mathematical Physiology I: Cellular Physiology. Springer. 717-772
Massy-Westropp NM, Gill TK, Taylor AW, Bohannon RW, Hill CL. 2011. Hand grip strength age and gender stratified normative data in a population-based study.BMC Research Notes 4:127
Narici M, Maganaris C. 2006. Ch. 9: Muscle architecture and adaptations to functional requirements, from: Skeletal Muscle Plasticity in Health and Disease, From Genes to Whole Muscle, ED: Bottinelli R and Reggiani. Springer, 265-288
Pette D. 2006. Ch.1: Skeletal muscle plasticity- history, facts and concepts, from: Skeletal Muscle Plasticity in Health and Disease, From Genes to Whole Muscle, ED: Bottinelli R and Reggiani. Springer, 1-27Sandri M. 2008. Signaling in muscle atrophy and hypertrophy. Physiology (Bethesda) 23; 160-170
Roberts HC, Denison HJ, Martin HJ, Patel HP, Syddall H, Cooper C, Sayer AA. 2011. A review of the measurement of grip strength in clinical and epidemiological studies: towards a standardized approach. Age Ageing 40 (4): 423-429
Schiaffino S, Sandri M, Murgia. 2006. Ch. 4: Signalling pathways controlling muscle fiber size and type in response to nerve activity, from: Skeletal Muscle Plasticity in Health and Disease, From Genes to Whole Muscle, ED: Bottinelli R and Reggiani. Springer, 91-119
Hypothesis:
Procedures:
Materials:
Handgrip dynameter
Stopwatch
Methods:
PART 1: Maximal Volitional Contraction:
1. Explain to the test subject that they will now be performing the strength-testing portion of the experiment. In the test, they will begin to squeeze the dynamometer without allowing for any movement or deviation from the testing position. The clench should build up over a 5-second period with a hold for 10-seconds and then a ramp down over 5-seconds
|
Figure 8 Positioning for testing of strength via handgrip dynamometer, note that you may have subject either standing or seated (but seated in unsupported position) |
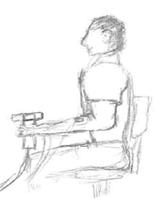
2. After explaining the process, have the test subject assume the position shown in figure 8
a. Give the subject a countdown, “3… 2… 1… GO!” where on “GO” then begin to squeeze, at 5-seconds give encouragement to “squeeze as hard as possible” and then continued encouragement to “Keep holding” for the 5-second isometric hold
b. Record the grip force (strength) during 5-second hold
c. As they get toward 5-sconds of holding, give the cue to “slowly start relaxing” and give count down of “4…3…2…1…Relax”
3. Have subject 1 rest for 2-minutes. During the rest, have subject 2 perform their isometric grip test
4. After 2-minute rest, repeat step 2 for the non-dominant side
5. Repeat for subject 2.
6. Repeat for 3 total trials, for each hand and each subject. Average the three trials
7. Determine the 100%, 50% and 25% grip strength
a. 100% is the maximal strength that was obtained during the maximal isometric hold
b. 50% is ½ of that number and 25% is ¼ of that number
SUBJECT 1:
Dominant:100 % = kg/cm2; 50%= kg/cm2; 25%= kg/cm2
Non-Dominant:100 % = kg/cm2; 50%= kg/cm2; 25%= kg/cm2
SUBJECT 2:
Dominant:100 % = kg/cm2; 50%= kg/cm2; 25%= kg/cm2
Non-Dominant:100 % = kg/cm2; 50%= kg/cm2; 25%= kg/cm2
PART 2: Time to Fatigue
1. Following 5-minutes of rest, have the test subject grasp the handgrip dynameter with their dominant-hand and assume the testing position that has been used throughout the experiment
2. Make sure that the instructor has started the “Workout Music” so that the testing environment provides an external motivation to allow for maximal performance
3. Explain to the test subject that they’re now going to be performing a prolonged maximal clench where they need to “squeeze as hard as possible” for the entirety of the test either until they are no longer able to continue to hold the clench or you have instructed them to relax as they are no longer able to maintain a clench strength of at least 25% of their MVC
4. Giving a countdown “3…2…1… GO!” Have your test subject now clench (keeping upper extremity in the neutral testing position) to maximal force as measured previously obtained in part 2. As they clench their fist, click “Start” on the stopwatch and give them constant encouragement “Keep Squeezing” as they ramp up to maximal strength.
a. Once maximal force had been reached start the stopwatch and continue to have test subject clench at what they perceive to be maximal force until they are unable to maintain 25% of MVC. (Note that force will waiver as contraction continues, note the number of times that the subject is able to get force above 50% MVC until force production is at 25% MVC and unable to return to 25% MVC)
i. Once the test subject is unable to maintain 50% MVC record the time from the stopwatch, do not stop the timer on the stopwatch and the grip strength
b. As contraction continues past the first few seconds, the test subject will need continuous encouragement that cannot be solely provided by the “Workout Music” in the lab room
i. (Using positive and negative reinforcements) provide constant positive encouragement to the test subject “You got this… don’t stop”; “Don’t let (fill-in name) beat you”
c. Remind them to breathe throughout the hold
d. As contraction continues allow the subject to get feedback from the computer screen as you both see a reduction in contraction strength, verbally cue them to get the strength curve back towards maximal force.
e. Once test subject is consistently below 25% MVC, tell them to “Stop” note that some test subjects may have stopped before this time. Click “stop” on the stopwatch and record the time and grip strength and the moment that the subject stopped holding the squeeze.
5. Give your test subject 5-minutes of rest. While resting, have the second test subject complete their dominant hand grip test
6. Repeat steps 4-6 for the non-dominant hand.
7. Input data into large group data tables (Google Doc), based on where subject falls for gender and determine averages for contraction strength, EMG activity, and times to fatigue.
Results:
Demographic Information:
Gender:
Age:
Days of Weightlifting/week:
Regularly Required to Carry Objects Heavier than 20-lbs.: (Yes/No)
Table 2. Grip strength (kg/cm2) produced via handgrip dynamometer during the test for maximal volitional contraction.
|
|
SUBJECT 1 |
SUBJECT 2 |
||
|
Measurement Segment |
Dominant Hand Strength (kg/cm2) |
Non-dominant Hand Strength (kg/cm2) |
Dominant Hand Strength (kg/cm2) |
Non-dominant Hand Strength (kg/cm2) |
|
Grip 1 |
|
|
|
|
|
Grip 2 |
|
|
|
|
|
Grip 3 |
|
|
|
|
|
Average Isometric |
|
|
|
|
|
Maximal Volitional Contraction |
|
|
|
|
Table 3. Results for the measures of maximal strength (MVC) production via handgrip dynamometer (kg/cm2) and time (seconds) for subject to degrade in force production from 100% MVC to 50 % MVC and then 25% MVC.
|
SUBJECT 1 |
100% MVC (kg/cm2) |
50% MVC (kg/cm2) |
25% MVC (kg/cm2) |
Time of contraction 100%-to-50% MVC (sec) |
Time of contraction 50%-to-25% MVC (sec) |
Total time of contraction 100-to-25% MVC (sec) |
|
Dominant
|
|
|
|
|
|
|
|
Non-Dominant |
|
|
|
|
|
|
|
SUBJECT 2 |
100% MVC (kg/cm2) |
50% MVC (kg/cm2) |
25% MVC (kg/cm2) |
Time of contraction 100%-to-50% MVC (sec) |
Time of contraction 50%-to-25% MVC (sec) |
Total time of contraction 100-to-25% MVC (sec) |
|
Dominant
|
|
|
|
|
|
|
|
Non-Dominant |
|
|
|
|
|
|
Note time is in seconds, convert each minute to 60 seconds: Time of Contraction= (# minutes*60) + seconds of the minute
Example: 3:30 contraction time has a Time= (3x60) + 30=180+30 = 210 seconds
**Upload your data to the data table in Google Documents for Analysis and Lab Report**
Discussion: Using the Google Doc Data Tables for group data and analysis.
In at least 2 well-formulated and coherent paragraphs, discuss the findings of the experiment based on the concepts of muscle physiology related to strength, recruitment, and fatigue. (In the analysis of results and presentation of findings think about do not answer as individual questions: What differences can be seen between dominant and non-dominant sides for the test subjects? To what can you ascribe these differences in observations? What gender differences are observed? What can be a possible explanation for the differences observed between genders? What are other factors that can influence the results observed in your experiment? Why would there be variability in someone’s ability to produce additional force after “fatigue” has begun? What factors are involved in that variability of force production? Why?)