
Lab 11 Nervous Physiology Testing Sensations: Hearing and Vision
- Page ID
- 59151
Objectives:
At the end of this lab, you will be able to…
- Use appropriate terminology to correctly discuss hearing and vision responses
- Determine if a response is normal or an altered response due to overstimulation
- Explain if responses might indicate an abnormal responses or loss, or if irregular responses due to desensitization
Pre-Lab Exercises:
After reading through the lab activities prior to lab, complete the following before you start your lab.
1. To differentiate between tonal deafness, sensorineural deafness, and conductive deafness you need conduct three tests:
2. True/False: A reading for a threshold above 50dB between 750 Hz and 4000 Hz would indicate that the person has normal hearing.
3. The Snellen eye chart is set at 20-feet because .
4. The Snellen test of 20/40 indicates that .
5. The reason for having a negative afterimage because of the while a positive afterimage occurs because of the .
Part 1: Testing Hearing
Humans hear frequencies from 20 Hz up to 20,000 Hz, but an audiogram only shows a subset of our hearing range: it focuses on the frequencies that are the most important for a clear understanding of speech (the spoken words). The volume (loudness) required to reach a person's hearing threshold is expressed in decibels(dB). dB are not absolute loudness levels but represent a difference between your hearing and the average "normal" hearing. When scoring 0 dB, you are hearing exactly matches the norm; higher values are signs of hearing loss. There are tolerances though: normal hearing is defined by thresholds lower than 15 dB at all frequencies, not strictly at 0 dB. The loudness scale goes from very soft sounds on top (-5 dB) to loud sounds at the bottom (80 dB). The test will examine the minimal threshold (energy of sound wave, decibels, or dB) for hearing in both left and right ears at the following frequencies (250 Hz, 500 Hz, 1000 Hz, 2000 Hz, 4000 Hz, and 8000 Hz). At each frequency, you will determine the level at which the sound can just be heard. The level below this will not be heard and the level of above will result in a greater response in the cochlea leading to a response within the cochlea or a sense of the sound being “louder”. By determining the minimal threshold, you will be able to develop an audiogram that maps the function of the cochlea or the ability for the person to hear or their level of deafness. Subjects should be able to respond at energy levels of at most 50dB between 750 and 4000 Hz, the normal range of frequencies of speech. Anything above this threshold level can be seen as an indication of receptor desensitization and can progress to deafness at the frequency.
There are several factors that can lead to changes in the responsiveness of the cochlea that include, history of loud noise exposure and age (just to name a few). Based on noise in the lab-room, results you obtain in the laboratory do not accurately reflect your hearing ability due to extraneous noise. When determining issues of deafness that might arise, there are two issues to keep in mind. Conductive deafness issues for the subject occurs when soundwaves are unable to cause the Ossicles to vibrate (due to sounds interacting with the tympanic membrane). Whereas sensorineural deafness issues for the subject occurs when the cochleae are unable to convert the soundwave that has passed through the conductive structures into neural pulses. This sensorineural deafness can be tonal (at specific frequencies) and typically occurs at higher frequency sounds as a person ages, or it can be complete sensorineural deafness that does not allow the person to hear at any frequencies. The audiometer allows us to determine if there are any tonal deafness issues occurring, but unless the person is completely unresponsive it cannot determine total deafness or the type of deafness for the person that is unresponsive. To differentiate between conductive and sensorineural we use two associated tests the Weber and Rinne tests.
Methods:
1. Follow the link to the online audiometer
2. Plug the headset into the computer’s audio jack
3. Make sure that the audio output is not muted and run the calibration file making sure that the audio output is at a level that the calibration sound can be heard. This should not be at 100% maximum output.
4. Position your subject so that they cannot see the computer screen, or you when you operate the sound files.
5. In form the test subject that they will be testing hearing in both their right and left ear. When they hear the sound in the ear, they are to raise their index finger to the ear that they are hearing the sound.
6. Without telling the subject which ear you are going to test, start at a frequency (Hz) of 250, and at random intervals, trigger the computer to send a tone at the lowest energy (dB) into the headphones of your subject.
7. If the subject hears the tone have them raise the index finger of the hand to match the side that they heard the sound. If no sound was heard, increase the energy (dB) of the sound wave to the next level and repeat until the subject indicates hearing the sound.
8. Record energy (dB) necessary to hear at that frequency in table 1.
9. Repeat steps 7-9 for remaining frequencies.
10. After completing all frequencies switch and repeat steps 6-10 for the other ear.
11. Following completing tests for both ears; switch roles for within your partner group and repeat steps 2-11
12. After both partners have completed the tests, graph your results.
Results:
Table 1. Results of the threshold energy (dB) required for interpretation of sound at various frequencies (Hz) during audiogram analysis
|
|
Subject 1 |
Subject 2 |
||
|
Frequency (Hz) |
Threshold Energy (dB) |
Threshold Energy (dB) |
||
|
|
R |
L |
R |
L |
|
250 |
|
|
|
|
|
500 |
|
|
|
|
|
1000 |
|
|
|
|
|
2000 |
|
|
|
|
|
4000 |
|
|
|
|
|
8000 |
|
|
|
|
Discussion: In a cohesive paragraph, discuss the findings of the experiment as it relates to the physiology of hearing and deafness. (Use the following think about questions to guide your discussion: What can you determine about your ability to hear? What about your partner? If there was any apparent loss, is it confined to one ear or both ears equally? If you have any apparent hearing loss describe the frequencies that are most affected? Why is there a loss at these specific frequencies? Relate the results to the other tests of the auditory responsiveness. Describe the results of this test if one of the subjects exhibited “sensorineural” versus “conductive” deafness. Can you tell from this experiment if any apparent hearing loss is due to sensorineural or conductive deafness? Why/Why not?)
Part 2: Testing Vision
Snellen Eye Test
Snellen eye test is used to examine the visual acuity at a standard distance. Visual acuity is the ability of the eye to adjust the curvature of the lens to ensure that the image will strike the retina on the fovea centralis. When performing the Snellen Test, it is important to set up the chart at 20-feet from the person. This distance is based on the curve of Earth that gives 0o horizontal inclination (appearance of flatness). When you score the test, it is about the scale difference of the images on each line of the test and not being the difference between seeing something at 20-feet versus someone else seeing at a different distance. So, if a subject has a reading of 20/40 that would mean they are reading images that are two times larger (both height and width) then would be seen at 20/20.
Materials
Snellen Eye Chart for Distance
Chair
Procedures:
1. Place a chair 20-feet from a wall
2. Have one partner sit in a chair with back fully supported, and the other partner place the eye chart at eye-level on a wall so that it is at eye level to the seated partner
3. Cover right eye and attempt to read the largest line from right to left (if all correct move to the next line below and repeat)
4. Continue until either read the complete smallest line or make more than 1 error. If more than 1-error record the line above the line with 1-error.
5. Record your score
6. Repeat steps 4-6 for the left eye.
Results:
Right Eye:______ /20
Left Eye: //20
Afterimage Testing
Afterimage occurs when the retina has been over stimulated and goes into a temporary state of desensitization. The state of afterimage leads to the “illusion” of seeing distinct colors based on the overstimulation of the cones of the retina not being able to respond correctly as excessive energy needs to be dissipated following the removal of a robust stimulus. The state of being over stimulated leaves the cones unable to be correctly activated and thus cannot propagate the signal through the visual pathway into the cerebral cortex when stimulated again. Based on the cones being over stimulated and the level of external stimulus two distinct afterimages can be generated, considered as either a positive or a negative afterimage. The afterimage may be positive, corresponding in color or brightness to the original image, and occurs when light is absent following overstimulation. On the other hand, a negative afterimage will occur when the eye is stimulated with light following the test and involves “seeing” colors that are deemed complementary to the original color that caused the overstimulation.
Materials
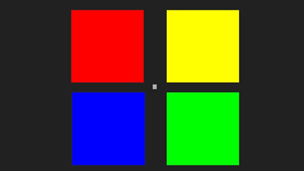
Color boards
Procedures:
1. Record the arrangement of the colors of the image
2. Play the 30-second exposure to the color board.
3. Stare at the center of the image until the image changes to a white screen. Do not blink
4. Stare at the white screen until it changes to a black screen. Do not blink.
Remember what happens to the arrangement of colors
5. Stare at the black screen until the show test ends. Do not blink.
Remember what happens to the arrangement of colors
6. Record your responses in the data table
The subject should note that the colors are no longer in the same arrangement, this is deemed the “after image” and relates to the temporary desensitization of the cone cells within the retina. The new arrangement on white paper is the “negative after image” (colors are in opposition to original) while the arrangement seen on the black paper is the “positive after image” (colors in the same arrangement to the original). This rearrangement is based on stimulus (or lack of stimulus) on the temporarily desensitized cones.
7. Repeat steps 1-6 for the second test subject
Figure 1. Position of the four distinct colors on the color board based on the original arrangement and in response to the two after images based on the white paper (Negative) and Black (Positive) following overexposure of the retina and temporary desensitization.
Subject 1
|
ORIGINAL ARRANGEMENT |
Negative AFTERIMAGE ARRANGEMENT |
Positive AFTERIMAGE ARRANGEMENT |
|
|
|
|
|
|
|
|
|
|
|
|
|
|
Subject 2
|
ORIGINAL ARRANGEMENT |
Negative AFTERIMAGE ARRANGEMENT |
Positive AFTERIMAGE ARRANGEMENT |
|
|
|
|
|
|
|
|
|
|
|
|
|
|
Discussion: In a cohesive paragraph, discuss the findings of the experiment as it relates to the physiology of vision. (Use the following think about questions to guide your discussion: What effect did staring at the color board have on what was seen on the white paper afterwards? How would you classify this finding (i.e. “positive” or “negative” afterimage), what is the most plausible reason for this occurring?)