
1.1: Scientific Investigation
- Page ID
- 75779

What is science and how do we “do” science?
Science is how we gain knowledge about the natural world. Typically, it pertains only to what we can investigate or observe using our senses – or instruments that extend the ability of our senses. As a science, biology concerns itself with understanding the unity and diversity of living things – the 2,300,00, or so, described (and millions of undescribed) species with which we share planet earth.
Ideally, the SCIENTIFIC METHOD is a process that describes how scientists perform investigations to provide a systematic and rational approach to answer questions about the natural world. One goal is to eliminate bias – and be as objective as possible in what we study. That being said, bias cannot ever be fully removed, but the goal is to recognize and minimize it as much as possible. Ideas that can’t be tested, directly observed, or measured in some way should not be subjected to the scientific method. There are certainly other ways to obtain knowledge (cultural, emotional, etc) they usually do not qualify as science because they do not follow the axioms of science. An axiom in a general sense, is a truth that is accepted without proof. It might seem that science does not assume anything but there are many assumptions that are often ignored such as the relationship between cause and effect, and that our senses and measurements accurately represent reality.
The goal of today’s lab is to familiarize you with the idealized steps of the scientific method but it's important to recognize that science rarely proceeds so linearly.
You will use these steps to determine the effects of caffeine and ethanol on the heart rate of a small aquatic organism known by the Latin name Daphnia magna (common name: “water flea”; Fig. 1).
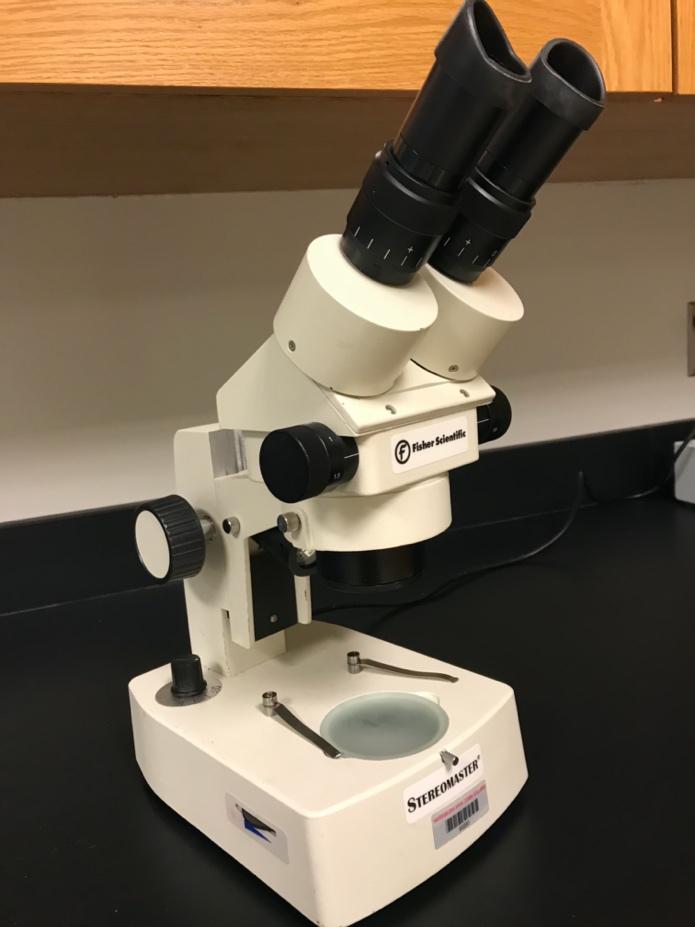
This is an ideal model organism because its body is transparent, allowing its internal organs to be viewed with the help of a dissecting microscope (Fig. 2).
Model organisms are non-human species used in research to investigate biological processes. Information learned in studies of model organisms can often be applied to other species, including humans. We use model organisms to learn about many different processes, including genetics, cellular mechanisms, and growth and development. There are certain characteristics that make a species an ideal model organism. For example, it must be easy to manipulate for study, inexpensive and easy to cultivate, and produce lots of offspring. Some commonly used model organisms include Drosophila melanogaster (fruit fly), Caenorhabditis elegans (C. elegans, roundworm), and Escherichia coli (E. coli, bacteria). The best model organism to use for a study depends upon the question being investigated. In this study, Daphnia magna is a good model organism because of its transparent body, which allows for ease of measuring heart rate and gathering data on the effects of caffeine and ethanol.
Steps of the Scientific Method
The scientific method consists of the following steps:
- Making an observation
- Asking a question based on that observation
- Forming a logical AND testable answer to that question (stated in terms of a hypothesis)
- Designing a controlled experiment to see if the hypothesis is supported or rejected
- Collecting, analyzing, and interpreting the data generated by the experiment
If the conclusion of an experiment is such that a hypothesis is not supported, then another hypothesis must be developed along with another experiment designed to test it. Ultimately, the results of experimentation are often published in peer-reviewed journals (along with detailed methods used to obtain them) so that other researchers can verify or replicate the experiment, and build on that work.
An idealized version of the scientific method is demonstrated in Figure 3. It is considered “idealized” because it is important to note that chance plays an important role in science. Often, the initial observations that result in important discoveries are stumbled upon by accident rather than sought out. Also remember that the scientific method does not apply to observational or discovery science, which is descriptive in nature.
MATERIALS AND METHODS
Materials and Supplies:
- Daphnia magna specimens
- Compound light microscope
- Concavity slides
- Disposable transfer pipettes
- Test solutions (water and caffeine and ethanol in varying concentrations)
- Paper towels / Kimwipes
- Stopwatch / clock (with second hand)
- Scissors
- Sharpie and plain paper
- Dissecting probe
- Diagram of Daphnia magna anatomy
PROCEDURE
Step 1: Making an Observation
Making and recording observations (often referred to as DESCRIPTIVE SCIENCE) is the first step in the scientific method. Start by making general observations of the Daphnia in a watch glass.
- Remove a compound light scope from the storage cabinet as instructed and plug it in.
- Obtain a concavity slide.
- Obtain a transfer pipette. Cut off the tip with a pair of scissors. This will prevent the Daphnia from being crushed when forced through a tip that is too narrow.
- Use the transfer pipette to remove the Daphnia, and some of the water it is in, from the specimen jar and place it on the concavity slide. Make sure that the Daphnia is totally covered by water.
- Take the Daphnia specimen back to your lab bench and place the slide on the stage of your microscope. Make sure that the 4X objective lens is over the stage.
- Use the dissecting probe to gently maneuver the Daphnia onto its side so that you can clearly view its heart.
- View your Daphnia under the microscope. Refer to the anatomy chart and identify the animal’s various parts.
- Make a sketch of the Daphnia in the circle below. Label the following parts:
- head region
- antennae
- compound eye
- heart
- digestive tract (midgut)
- thoracic appendages (leg-like structures that function as gills)
- shell spine
- Answer the following questions.
- Which body parts are moving?
- Do you see any eggs or young?
- Once you have found and observed your Daphnia’s heart, count the number of heart beats in one minute. The heartbeat of a healthy specimen is about 2 to 5 beats per second. Because it is so fast, count the heartbeat for 15 seconds and then multiply that number by 4. If necessary, you can keep track of the heart beats by tapping a marker onto a blank sheet of paper and then counting up the number of tap marks.
- Record the following information:
- Heart beats per 15 seconds: ____________________________
- Heart beats per one minute: _____________________________
Steps 2 and 3: Formulating a Question and Stating a Hypothesis
In science, observations often lead to the formulation of questions that generate hypotheses – and associated predictions that are testable. In today’s lab, we are considering the following question: “What is the effect of commonly consumed chemicals on Daphnia heart rate”?
A hypothesis is a testable explanation of a set of observations based on available data. It is a tentative answer to the question you are asking based on knowledge about what you're observing and asking. This knowledge can be pre-existing or information from a published resource. For these reasons, it is NOT correct to say that a hypothesis is an educated guess.
In this lab, you need to formulate several hypotheses about how you believe various test solutions will affect the heart rate of a Daphnia based on your prior knowledge of how these solutions affect humans. After you formulate the hypotheses, you will test predictions based on these hypotheses. Hypotheses can be rephrased as predictions and can be written as “If…., then….”statements.
For example: “If I put Daphnia in ice water, then their heart rates will decrease since decreasing temperatures slow down the movement of molecules.”
It’s important to note that the “If…, then…” statement is not the hypothesis, it is a prediction made about the hypothesis.
Formulate a hypothesis to describe what you predict will happen to the Daphnia in each of the following test solutions.
- Water (from the Daphnia culture jar):
- Ethyl alcohol (in increasing concentrations: 2%, 4%, 6%, and 8%):
- Caffeine (in increasing concentrations: 1%, 2%, and 3%):
Step 4: Designing a Controlled Experiment
The next step in the scientific method is to test the predictions based on your hypotheses by designing one or more experiments that allow you to collect the best data to answer your question.
Before doing this, it is necessary to determine the factors (or variables) you are interested in testing. There are several variables to consider when designing an experiment.
- An independent variable is the condition or event under study. It is the predetermined condition the investigator sets (and can vary). Only one independent variable is tested at a time, so that an observed response is attributable to just that variable.
- A dependent variable is the condition or event that occurs (the data collected) in response to the specified, predetermined, independent variables that are set.
- Controlled variables are any conditions or events that could potentially affect the outcome of an experiment. Consequently, they must be held constant (controlled) and never varied. In the case of our Daphnia experiment, an example of a controlled variable would be the temperature of the water in which the Daphnia are tested. This variable needs to be controlled because Daphnia hearts beat faster in warm water than they do in cold water.
In the spaces below, define the variables that will be considered in your experiment today:
- What will be the independent variables in the Daphnia experiments? List all of them.
- What will be the dependent variables in the Daphnia experiments? Be specific with your answers.
- Apart from water temperature, what other variables should be controlled? List at least 3 controlled variables.
Importance of a Control Group
Most well-planned experiments contain a control group in addition to an experimental group. The experimental group is the group whose experience is manipulated – usually by only one variable at a time. The control group is the group used for a comparison; it serves as a baseline against which the effects of a treatment can be evaluated. A control group should be as much like the experimental group as possible. It should be treated in every way like the experimental group except for one manipulated factor (the independent variable).
Performing the Experiment
- Your group will test the effects of:
- plain water (from the Daphnia culture jar)
and
- JUST ONE of the test solutions (at all concentrations listed): Either -
- Ethyl alcohol (2%, 4%, 6%, and 8%)
or
- Caffeine (1%, 2%, 3%, 4%)
- To test a solution, you will need to remove most of the existing water covering the Daphnia in your concavity slide. “Wick it away” with a Kimwipe at the same time you add your test solution with a transfer pipette. Determine the volume of water needed to fill the concavity slide and cover the Daphnia. Use this same volume of water for each treatment. Make sure to keep the Daphnia submerged in fluid! If your Daphnia dies at any point, you need to re-start the experiment with a new specimen from the culture jar.
- You will subject the Daphnia to water for a replicate of 8 treatments. Add the first treatment (water from the Daphnia culture jar), wait 1 minute, and count the heartbeats for 15 seconds. Record your data in Table 1 (Step 5) and calculate the number of beats per minute.
- Add the second treatment (more water from the Daphnia culture jar) by wicking the previous water sample away as described above. Wait 1 minute, then count the heartbeats for 15 seconds. Record your data in Table 1 and calculate the number of beats per minute.
- Repeat these steps 6 more times. Use your data to calculate an average value for the effects of water on the heart rate of your Daphnia. This part of the experiment is the control for your experiment. It serves as the baseline against which you can compare the results from the Daphnia you subject to the ethyl alcohol or caffeine.
- Next, test all the other solutions your group has been assigned (either ethyl alcohol or caffeine). Start with the lowest concentration of the test solution and progress to the highest concentration.
- Note: Be sure to keep all the steps of your experimental protocols exactly the same (add the same volume of test solution, equivalent to the volume of water added in the control treatments). Always wait one minute before counting, and record the heartbeats for 15 seconds (just as performed in the control experiment). Due to time constraints, do only one run (treatment) for each test solution. Record your data in Table 2 (Step 5).
- When your tests have been completed, use a pipe test to transfer your Daphnia to the recovery beaker (as indicated by the instructor).
- Wash and dry all the glassware you used and put it back where you found it. Dispose of the used pipettes in the trash. Make sure the lids are placed back on all of your solution bottles. Clean up any mess you may have made and wipe down the lab benches with the paper towels.
- Compile your class data as directed by the instructor.
Step 5: Collecting, Analyzing, and Interpreting the Data
|
Water Treatment # |
Beats per 15 seconds |
Beats per 1 minute |
|---|---|---|
|
Treatment #1 |
||
|
Treatment #2 |
||
|
Treatment #3 |
||
|
Treatment #4 |
||
|
Treatment #5 |
||
|
Treatment #6 |
||
|
Treatment #7 |
||
|
Treatment #8 |
||
|
Average of 8 treatments |
Substance tested by your group: ______________________________________
*Start with the lowest concentration of the test solution, followed by the next higher concentration (lowest to highest concentrations).
|
Substance Concentration |
Beats per 15 seconds |
Beats per 1 minute |
|---|---|---|
|
Drug Concentration |
Group #1 |
Group #2 |
Group #3 |
Group #4 |
Group #5 |
Group #6 |
Class Average |
|---|---|---|---|---|---|---|---|
|
2% Alcohol |
|||||||
|
4% Alcohol |
|||||||
|
6% Alcohol |
|||||||
|
8% Alcohol |
|||||||
|
1% Caffeine |
|||||||
|
2% Caffeine |
|||||||
|
3% Caffeine |
|||||||
|
4% Caffeine |
Experimental data and results must be displayed in a clear logical manner. Tables, charts, and graphs are usually the most effective tools to provide a concise summary of the type of numerical data you collected today.
A graph is a diagram showing the relationship between independent and dependent variables.
When making graphs, the following rules should be observed:
- The independent variable is usually plotted on the X-axis (horizontal axis) and the dependent variable is plotted on the Y-axis (vertical axis).
- Each axis should be labeled properly with the name of the variable and the units of measurement.
- Data intervals must be evenly spaced across the axes, usually beginning with zero and increasing in consistent even increments.
- All graphs should have a title or caption to describe the information presented. Capitalize the first word in the title and place a period at the end.
- Choose a graph that best represents the type of data you collected:
- Line graphs show changes in the quantity of the chosen variable and emphasize the rise and fall of the values over their range.
- Bar graphs are used for data that represent separate or discontinuous groups or non-numerical categories, thus emphasizing the discrete differences between the groups.
*Refer to the Graphing Grading Rubric at the end of this lab.
Graph Your Results:
Discuss with your group how to design the graph so it best represents your data and ultimately the conclusions you draw.
Use the grid below to graph your group’s results:
Title:
Interpret Your Results:
Once you have collected your data and summarized it as a graph, the last step is to analyze and interpret your results. Ultimately, you have reached the stage in the scientific method process where you need to determine whether the hypothesis you initially generated has been supported or refuted (not supported).
Questions for Review
- What is the difference between a control group and a controlled variable?
- What are some types of questions science can’t answer?
- Where would you find an independent variable on a line graph?
- What are ‘levels of treatment’?
- Much like citing your sources, making a graph usually follows format guidelines. What is the correct way to format a graph in APA style?
Practical Challenge
- Give an example of a well written hypothesis and a prediction based on this hypothesis.
- What kind of data would be appropriate to use for a bar graph?
- Did the results of your experiments support or refute your hypothesis?