
5.4.1: Water Usage
- Page ID
- 75086

Freshwater supply is one of the most important ecosystem services. In 2014, global water consumption was 3999 km3 per year (over 1,000 trillion gallons!). The greatest use of this water is for irrigation in agriculture, but significant quantities of water are also extracted for public and municipal use, as well as industrial applications and power generation (figure \(\PageIndex{a}\)).
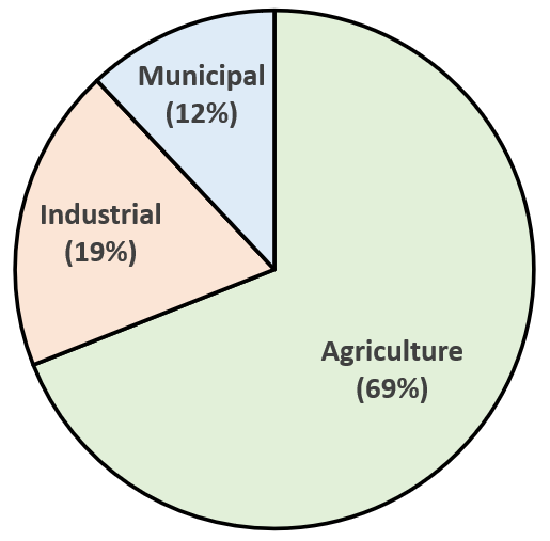
Figure \(\PageIndex{a}\): Global water usage by sector. Municipal refers to domestic use, such as by local businesses and households. Data from FAO. Image by Melissa Ha (CC-BY-NC).
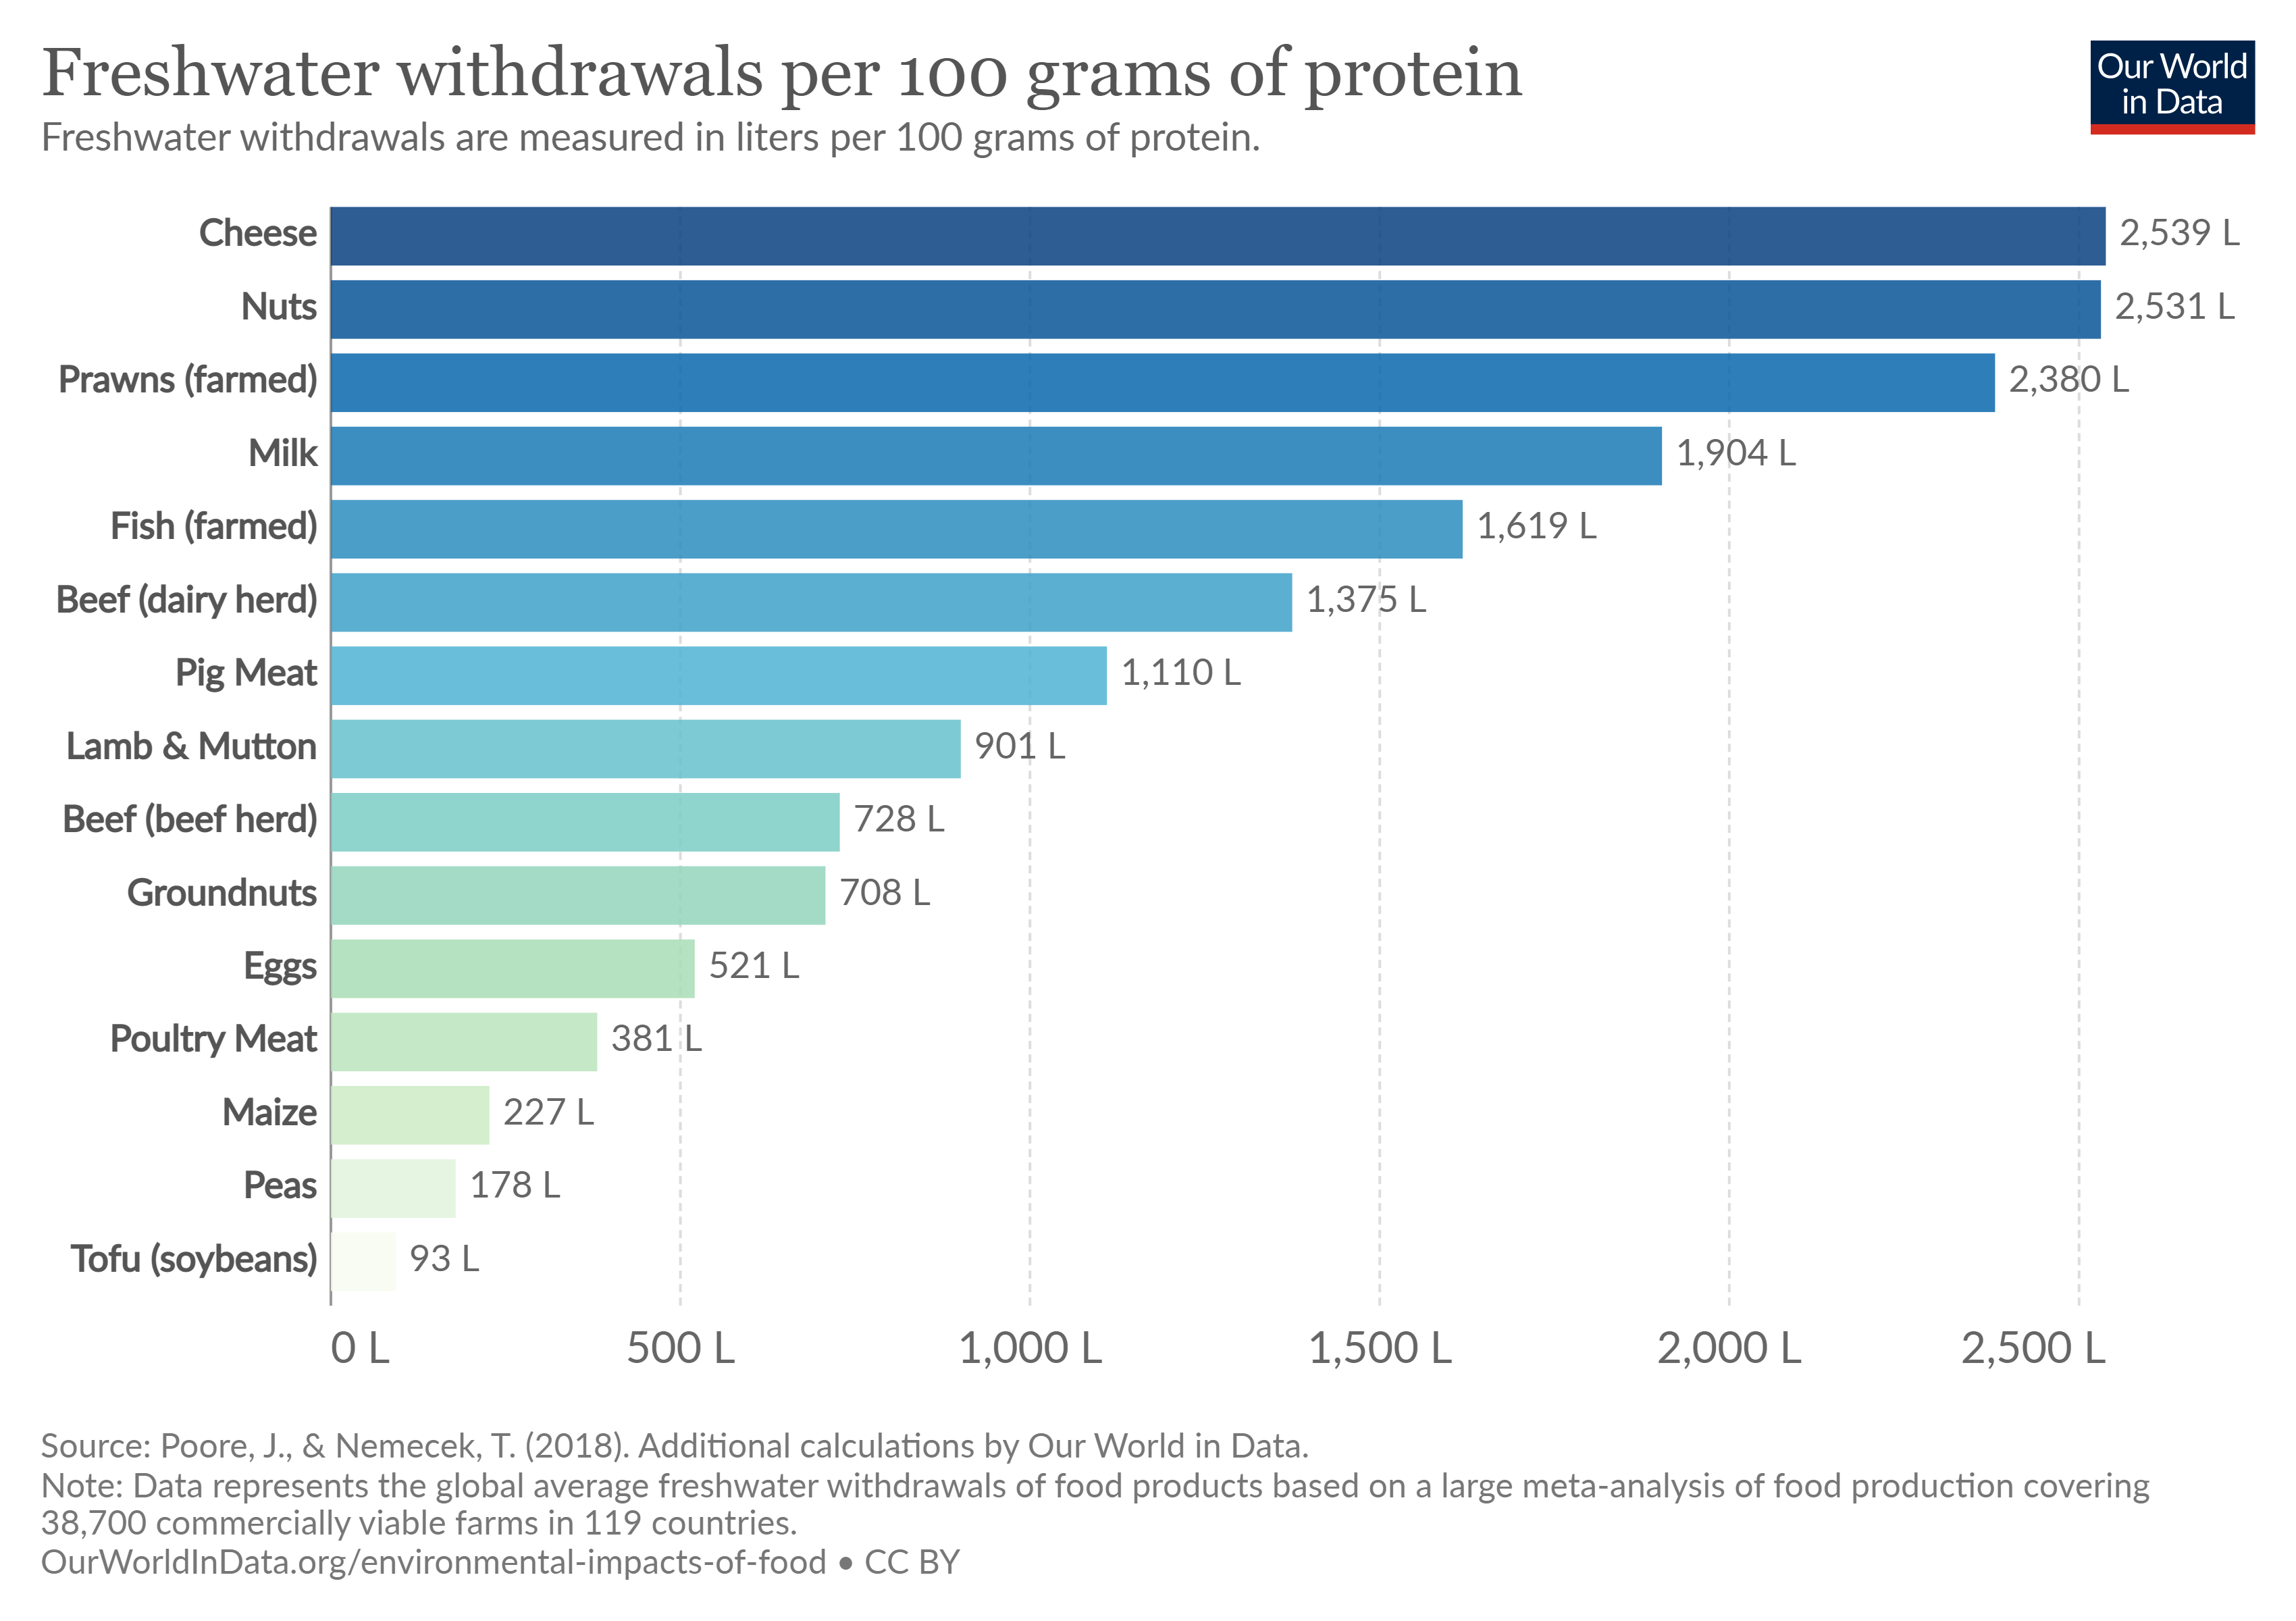
Humans require only about 1 gallon per day to survive, but a typical person in a U.S. household uses approximately 80-100 gallons per day, which includes cooking, washing dishes and clothes, flushing the toilet, and bathing. Additionally, we rely on the food, energy, and mineral resources, which all require water to produce. For example, approximately three gallons are needed to produce a tomato, 150 gallons for a loaf of bread, and 1,600 for a pound of beef. (You can learn more about the water footprint of different foods using this interactive website.) Figure 5.4.1.d compares water requirements for different crops. Twenty-one gallons are needed to produce one kilowatt-hour (kWh) of electricity from a traditional power plant (about 1 kWh is needed to heat an oven for 30 minutes), and one ton of steel consumes about 63,000 gallons of water. The water demand of an area is a function of the population and other uses of water.
In the United States, 281 billion gallons of water were withdrawn per day in 2015, of which 82 billion gallons are fresh groundwater (figure \(\PageIndex{b}\)). The state of California accounts for 9% of national water withdrawal (figure \(\PageIndex{c}\)).
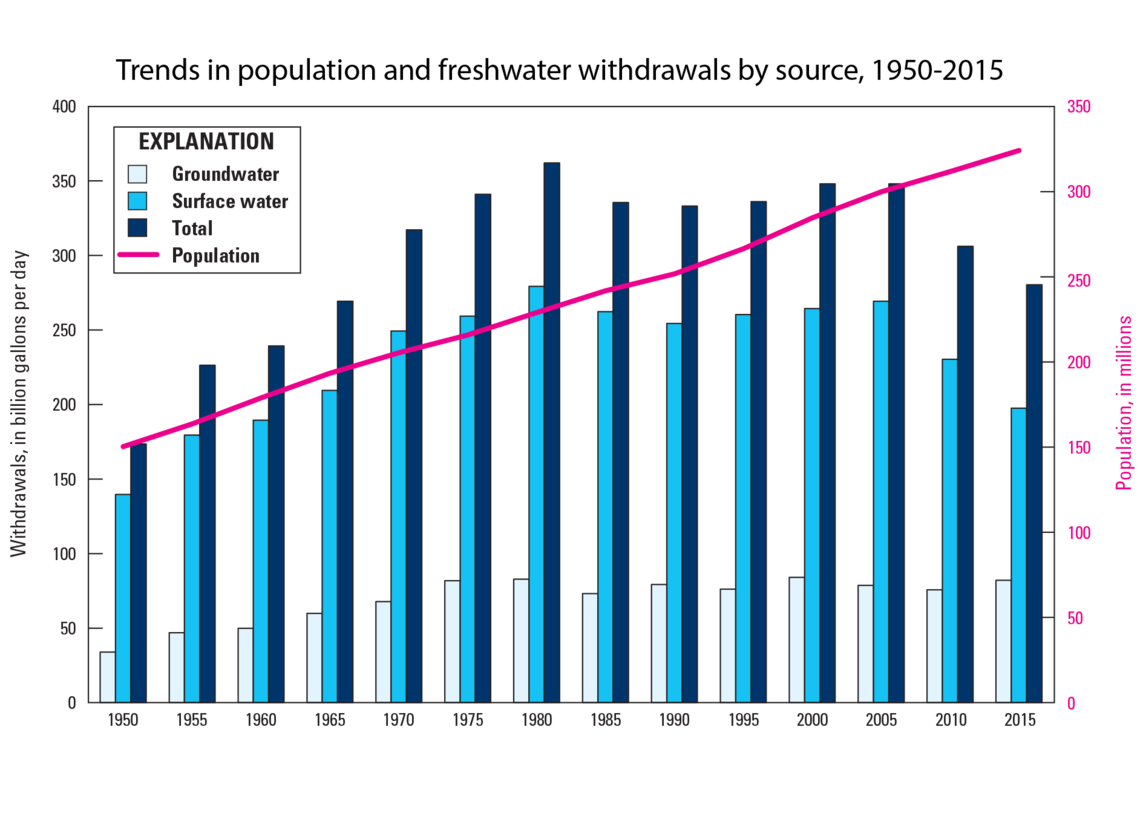
Figure \(\PageIndex{b}\): Average daily freshwater withdrawals (in billion gallons per day, left y-axis) over time (x-axis) in the United States. Light blue bars (left) represent groundwater withdrawals, medium blue (middle) represents withdrawals from surface water, and dark blue bars (right) represent total withdrawals in billions of gallons per day. In 1950, total withdrawals were around 170 billion gallons per day. This gradually increased until 1980 at just over 350 billion gallons per day. In 1985, total withdrawals dropped to around 325 billion gallons and stayed relatively constant until decreasing in 2010. In 2015, total withdrawals were around 260 billion gallons. Most of the changes in withdrawals overtime were due to changes in surface water withdrawals rather than groundwater withdrawals. Surface water withdrawals have generally been 2-3 times greater than groundwater withdrawals. The pink line represents the United States population size in millions (right y-axis), which has increased from roughly 170 million in 1950 to about 325 million in 2015. Image by USGS (public domain).
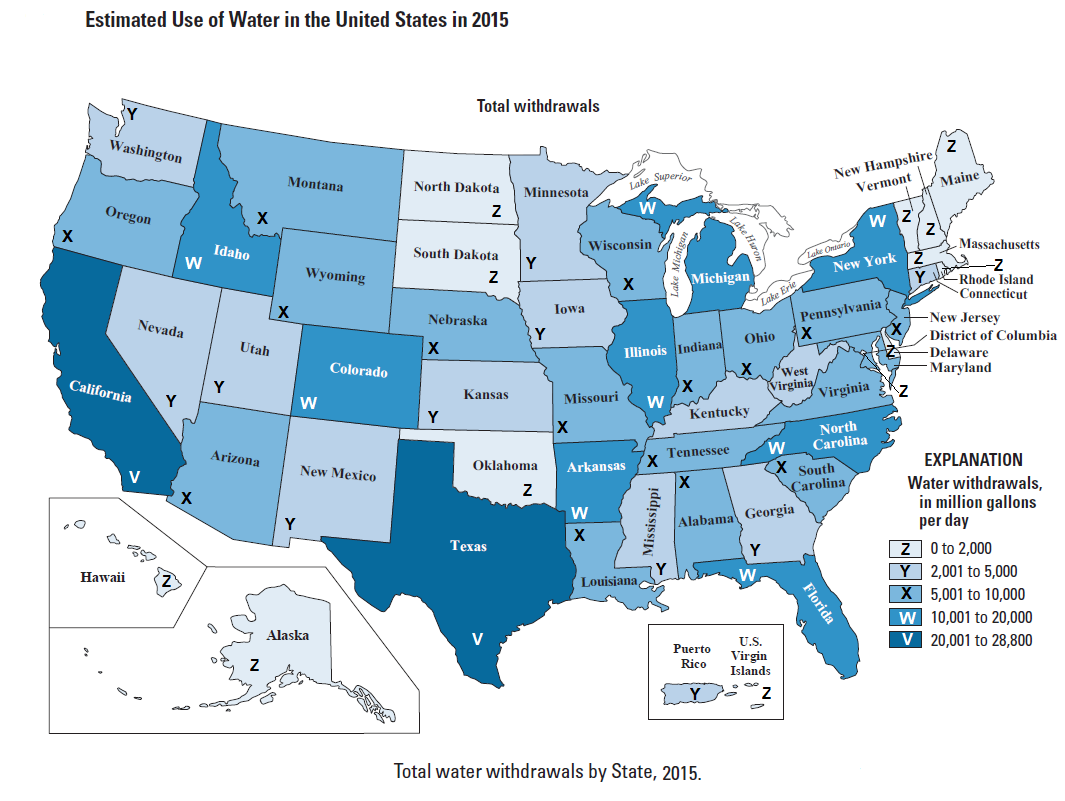
Figure \(\PageIndex{c}\): Total water withdrawals by state in 2015. The lightest blue (Z) indicates 0-2,000 million gallons per day, and the darkest blue (V) indicates 20,001-28,800 million gallons per day. California and Texas consume the most water, and Alaska, Hawaii, the Dakotas, Oklahoma, and some New England states consume the least. Image modified from USGS (public domain).
Attributions
Modified by Melissa Ha from the following sources
- Water Use and Distribution from An Introduction to Geology by Chris Johnson et al. (licensed under CC BY-NC-SA)
- Water Cycle and Fresh Water Supply from Environmental Biology by Matthew R. Fisher (licensed under CC-BY)
- Biogeochemical Cycles and the Flow of Energy in the Earth System from Sustainability: A Comprehensive Foundation by Tom Theis and Jonathan Tomkin, Editors (licensed under CC-BY). Download for free at CNX.