
4.3: Data Dive- Bison Impacts In Prairies
- Page ID
- 70812

Overview
In many grassland ecosystems the activities of large grazers, like bison, play a key role in shaping grassland habitat structure and diversity. A 2017 study sought to investigate how bison in tall-grass prairies affect local plant competition. Specifically, they wanted to know if bison have a positive impact on herbaceous forbs (non-woody flower species). To investigate this, they observed plant communities in tall-grass prairies in the presence and absence of bison. The two graphs below display some of the results in this study:
Questions
- What kind of graphs are these?
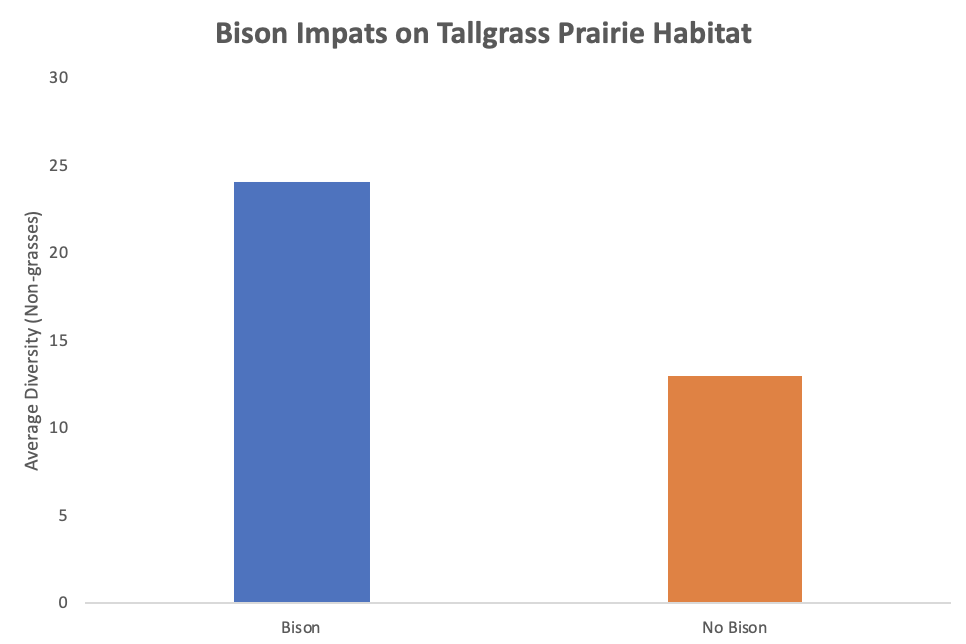
- Does the presence of bison increase diversity? How do you know this? Which graph(s) support this?
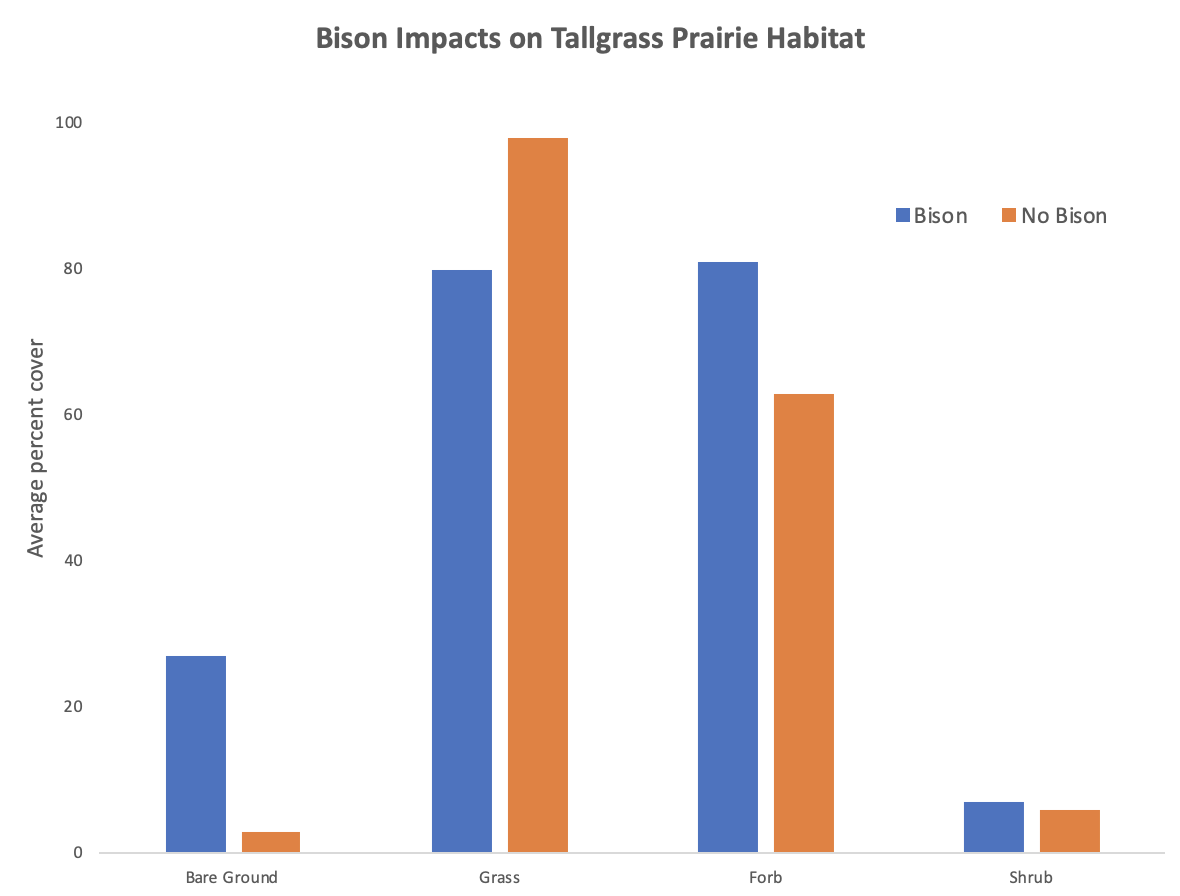
- How does the presence of bison affect the percent cover of bare ground, grasses, forbs, and shrubs?
- Based on the authors objectives/predictions described above, do the results of these graphs support them? Why/why not?
- How can we use the results of this graph to inform conservation projects for tallgrass prairies in the future?
- What does the results of this graph make you curious about?
Raw Data From Above Graph(s)
Table \(\PageIndex{2a}\): Raw data for average percent covers (aka what percent of an area a species took up) for grasses, forbs, shrubs, and bare ground in tall-grass prairies with and without bison. Graph by Rachel Schleiger (CC-BY-NC) modified from data in Elson A and Hartnett D, 2017.
| Status | Average Percent Cover With Bison | Average Percent Cover With No Bison |
|---|---|---|
| Bare Ground | 27 | 3 |
| Grass | 80 | 98 |
| Forb | 81 | 63 |
| Shrub | 7 | 6 |
Table \(\PageIndex{b}\): Raw data for average diversity of non-grasses in tall-grass prairies with and without bison. Graph by Rachel Schleiger (CC-BY-NC) modified from data in Elson A and Hartnett D, 2017.
| Average Diversity (Non-Grasses) With Bison | Average Diversity (Non-Grasses) With No Bison |
|---|---|
| 24 | 13 |
Attributions
Rachel Schleiger (CC-BY-NC)