
3.3.6: Data Dive- World Population Densities
- Page ID
- 70833

\( \newcommand{\vecs}[1]{\overset { \scriptstyle \rightharpoonup} {\mathbf{#1}} } \) \( \newcommand{\vecd}[1]{\overset{-\!-\!\rightharpoonup}{\vphantom{a}\smash {#1}}} \)\(\newcommand{\id}{\mathrm{id}}\) \( \newcommand{\Span}{\mathrm{span}}\) \( \newcommand{\kernel}{\mathrm{null}\,}\) \( \newcommand{\range}{\mathrm{range}\,}\) \( \newcommand{\RealPart}{\mathrm{Re}}\) \( \newcommand{\ImaginaryPart}{\mathrm{Im}}\) \( \newcommand{\Argument}{\mathrm{Arg}}\) \( \newcommand{\norm}[1]{\| #1 \|}\) \( \newcommand{\inner}[2]{\langle #1, #2 \rangle}\) \( \newcommand{\Span}{\mathrm{span}}\) \(\newcommand{\id}{\mathrm{id}}\) \( \newcommand{\Span}{\mathrm{span}}\) \( \newcommand{\kernel}{\mathrm{null}\,}\) \( \newcommand{\range}{\mathrm{range}\,}\) \( \newcommand{\RealPart}{\mathrm{Re}}\) \( \newcommand{\ImaginaryPart}{\mathrm{Im}}\) \( \newcommand{\Argument}{\mathrm{Arg}}\) \( \newcommand{\norm}[1]{\| #1 \|}\) \( \newcommand{\inner}[2]{\langle #1, #2 \rangle}\) \( \newcommand{\Span}{\mathrm{span}}\)\(\newcommand{\AA}{\unicode[.8,0]{x212B}}\)
Overview
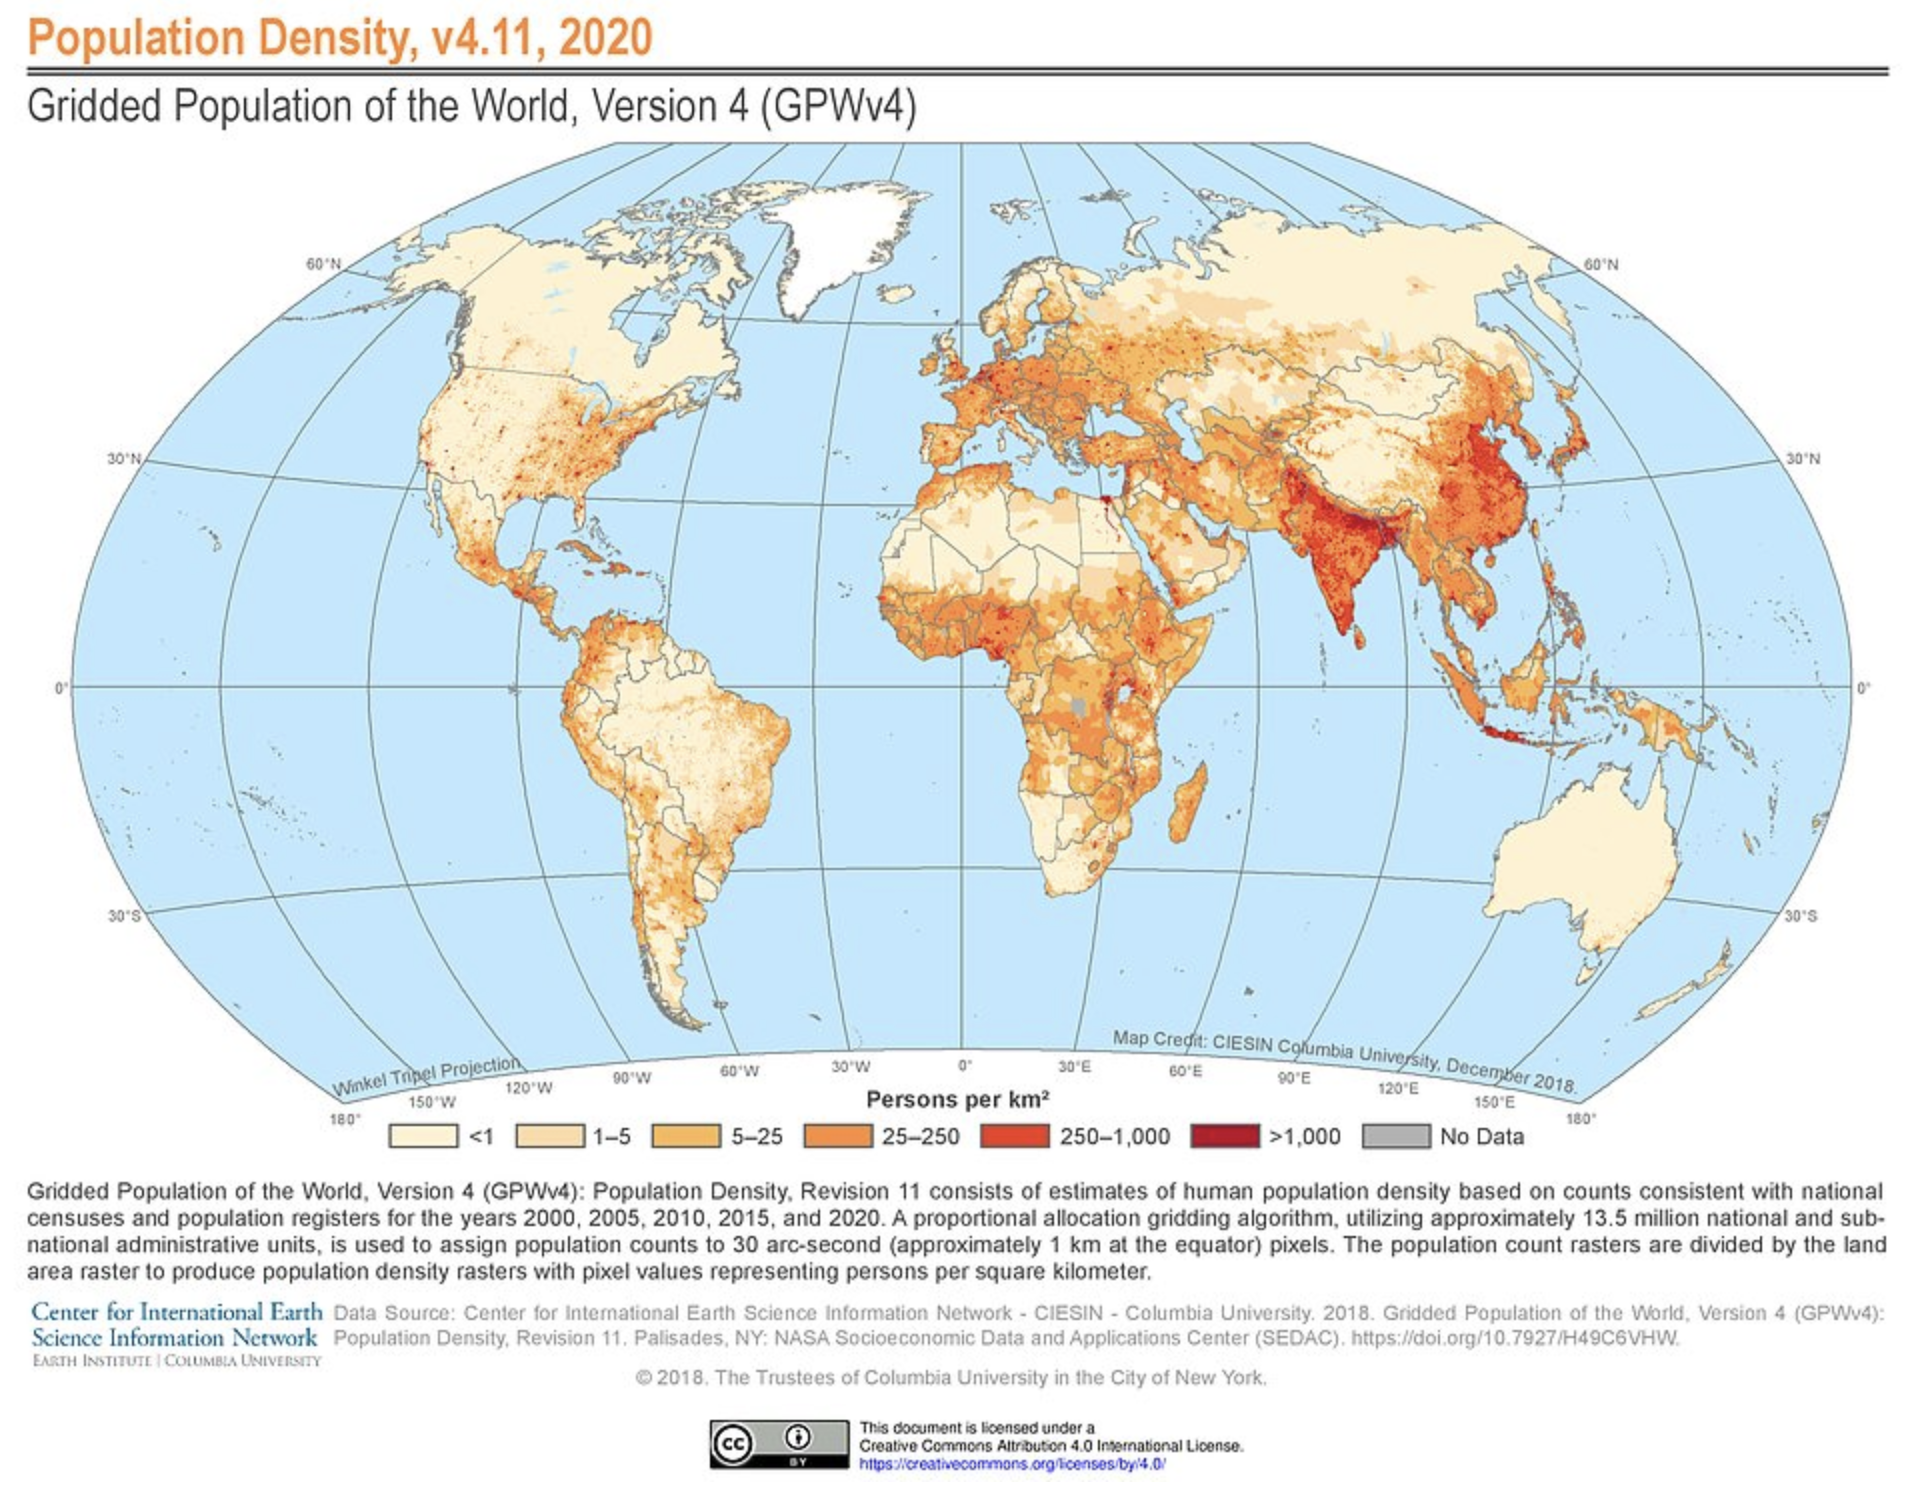
The Socioeconomic Data and Applications Center (SEDAC), is one of the Distributed Active Archive Centers (DAACs) in the Earth Observing System Data and Information System (EOSDIS) of the U.S. National Aeronautics and Space Administration (NASA). Its main objective is to investigate human interactions in the environment and to develop and operate applications that support the integration of socioeconomic and earth science data and to serve as an "Information Gateway" between earth sciences and social sciences. One of the projects it continually updates is creating global population density maps. Their 2020 map can be observed below:
Questions
- The data on the above graph is overlaid onto a world map. Why do you think this is a powerful way to display data?
- What question(s) are the authors trying to answer with this graph and table?
- Which areas of the globe have the highest density levels (darkest density shading)?
- Are there any areas of the globe that surprise you (either high or low) with their density? Why?
- How can policy makers/world leaders/health organizations use this information? Provide at least 3 ideas.
- What is missing from this map? Hint: It’s very large!
Attribution
Rachel Schleiger (CC-BY-NC)