
3.3.4: Looking Ahead
- Page ID
- 70832

Population Projections
A consequence of exponential human population growth is that is takes less time to add a particular number of humans to our Earth. Figure \(\PageIndex{a}\) shows that 123 years were necessary to add 1 billion humans in 1930, but it only took 24 years to add two billion people between 1975 and 1999. As already discussed, at some point it would appear that our ability to increase our carrying capacity indefinitely on a finite world is uncertain. Without new technological advances, the human growth rate has been predicted to continue to slow in the coming decades. However, the population will still be increasing and the threat of overpopulation remains.

Figure \(\PageIndex{a}\): The time between the addition of each billion human beings to Earth decreases over time. By 1800, there were about a billion people on Earth. It took 130 years, until 1930, for the number to reach two million. Thirty years later, in 1960, the number reached three billion, and 15 years after that, in 1975, the number reached four billion. The population reached five billion in 1987, and six billion in 1999, each twelve years apart. Currently, the world population exceeds seven billion. The population is projected to reach 8 billion in 2028, and 9 billion in 2054. (credit: modification of work by Ryan T. Cragun)
Exponential growth cannot continue indefinitely. If the current world value for r (1.075% in 2019) remains unchanged, the global population would grow from its current 7.8 billion (August 2020) to 9.7 billion by 2050. Experts predict that the global population will continue to grow until 2100, reaching a peak of almost 11 billion. So this begs the question(s)... What is the carrying capacity for humans on Earth? How long until we reach it, or have we already surpassed it? Then finally, what are the consequences of our current and projected populations?
Long-term Consequences
Humans are not unique in their ability to alter their environment. For example, beaver dams alter the stream environment where they are built. Humans, however, have the ability to alter their environment to increase its carrying capacity, sometimes to the detriment of other species. Earth’s human population and their use of resources are growing rapidly, to the extent that some demographers say that humans have already exceeded our carrying capacity. This would mean that the Earth cannot indefinitely support our current population size. Long-term exponential growth carries with it the potential risks of famine, disease, and large-scale death, as well as social consequences of crowding such as increased crime.
The impact of humans on our environment depends not only on population size but also on resource use. The ecological footprint is a measure of the area of land needed to support an individual or country. This includes agricultural lands used to provide food, other lands used to provide goods (such as forests to provide timber) and fuels (such as oil fields to provide fossil fuels), and the land needed to dispose of wastes.
Countries differ in the average ecological footprint per person, and these differences are associated with region (figure \(\PageIndex{b}\)). For example, in 2017, the ecological footprint per person in the United States was 8.1 global hectares compared to only 1.2 global hectares in India. (Visit footprintnetwork.org to see ecological footprints and related metrics for all countries.) Many factors affect the size of an ecological footprint from economic development to resource conservation to individual product choice. Reducing our ecological footprints can increase our carrying capacity and decrease environmental impact. So maybe we should update the question of, "What the Earths carrying capacity for humans," to, "What is the carrying capacity of people on Earth at which we can provide a fair and decent life for all humans while causing the minimum impact on the environment?
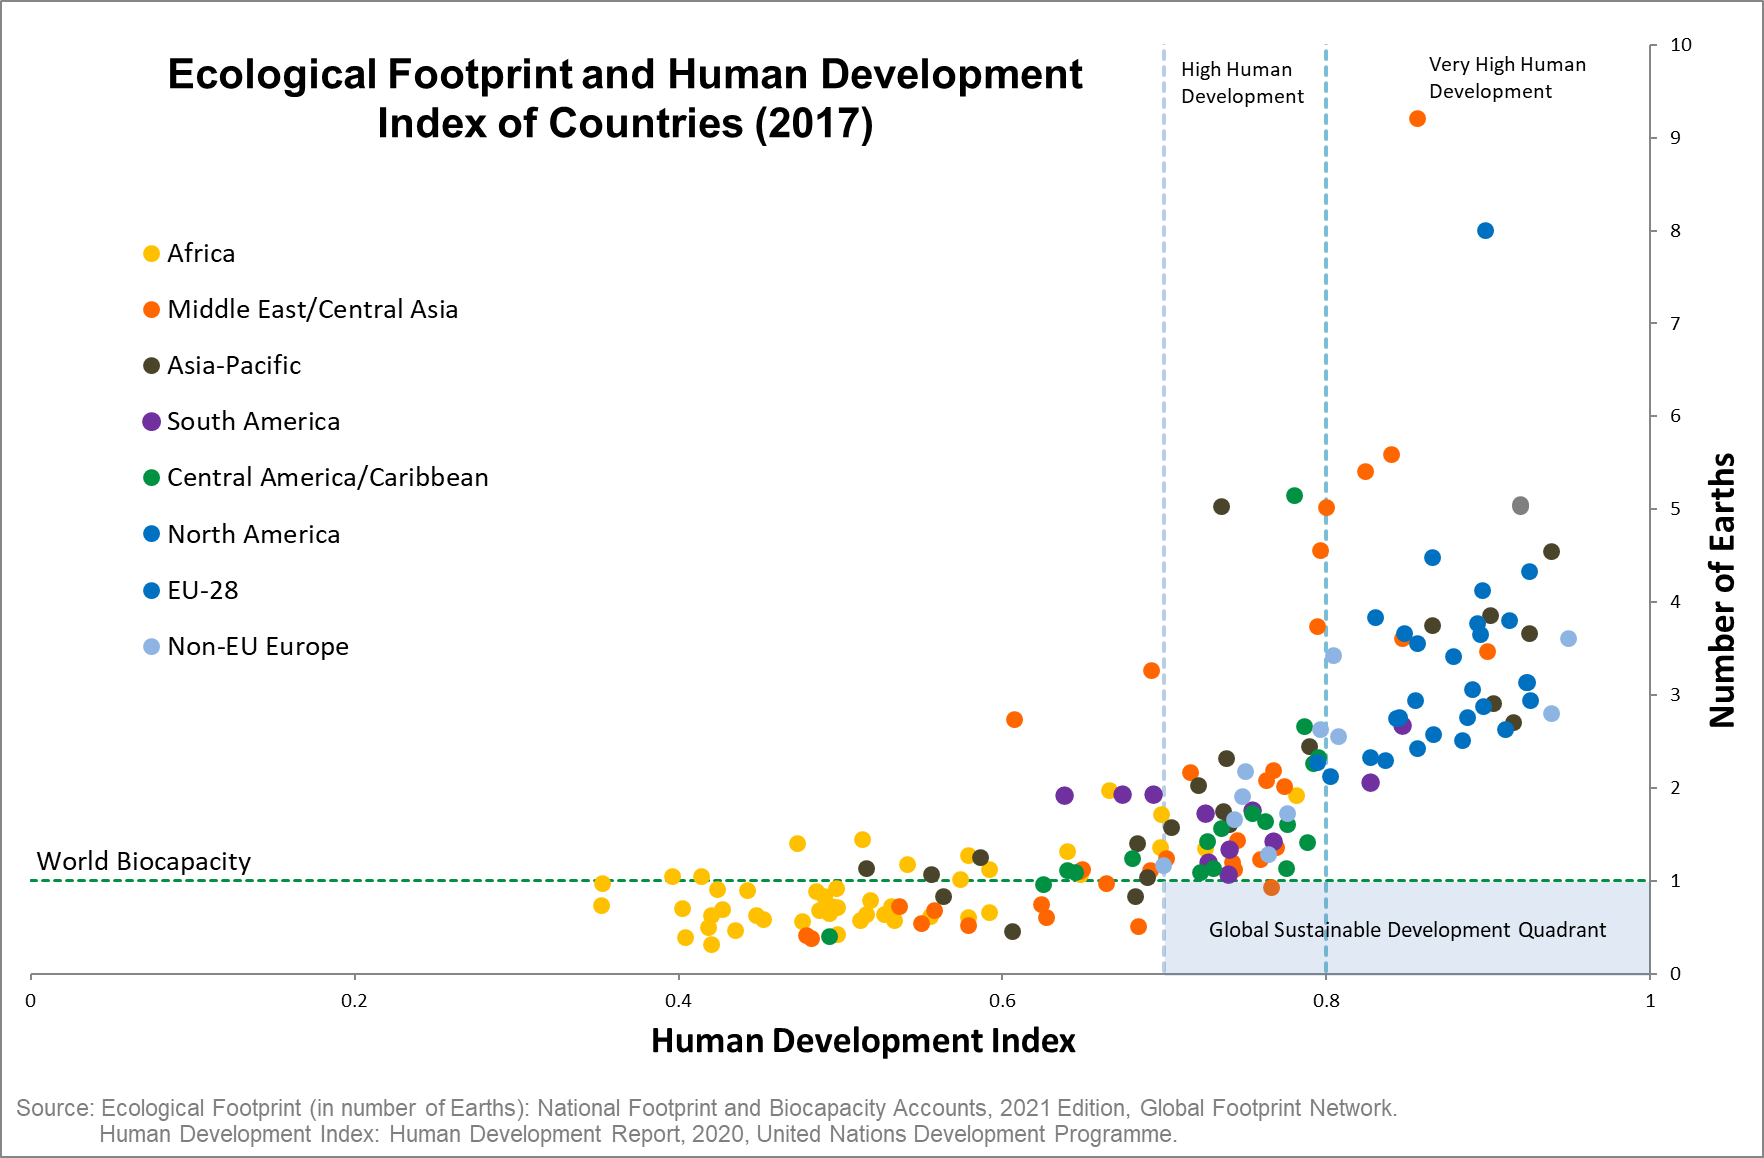
Figure \(\PageIndex{b}\): The ecological footprint per person in relation to the U.N. human development index for each country coded by region. Countries in some regions of the world have low ecological footprints per person, but this is because people are living in poverty (points in lower left of graph). This pattern is characteristic of many African countries. Other countries have large ecological footprints and live affluently (points in upper right of graph), including many European countries. To sustainably meet human needs, countries must achieve a high human development index and low ecological footprint (points in lower right of graph). (York University Ecological Footprint Initiative & Global Footprint Network. National Footprint and Biocapacity Accounts, 2021 edition. Produced for the Footprint Data Foundation and distributed by Global Footprint Network. Available online at: https://data.footprintnetwork.org. CC-BY-SA 4.0).
Are you wondering about the size of your ecological footprint? You can estimate it here.
Regulation
Reducing the population growth rate will limit the consequences of overpopulation; however, regulation of the human population is a complex issue that presents ethical considerations.
Efforts to moderate population control led to the 1979 One-Child Policy in China, which imposed fines on urban couples who had more than one child (figure \(\PageIndex{c}\)). Additionally, only a couple's first child was granted educational and health care benefits. The effectiveness of the policy in limiting overall population growth is controversial, as was the policy itself. Tragically, this policy combined with the desire of many couples to have a male heir led to female infanticide. Furthermore, enforcement of the policy led to human rights abuses including forced sterilizations and forced abortions. Over the years, some restrictions associated with the One-Child Policy were lifted. For example, in 2013, an adult who was an only child was allowed to have two children. The policy ended in 2016, and as of May 2021, each couple is now permitted to have up to three children.

Figure \(\PageIndex{c}\): A poster explaining and promoting the One-Child Policy. Image by Arian Zwegers (CC-BY).
Zero population growth occurs when the birth rate equals the death rate such that the rate of population growth is zero. Logically, this would occur when total fertility rate equals replacement fertility rate, but as described in the previous section, this depends on the age structure of a population.
All else being equal, reductions in total fertility rate will slow human population growth. Total fertility rate is negatively correlated with improved standard of living, access to health care, and gender equality. As countries develop economically, individuals become increasingly dependent on urban jobs rather than the family farm for income and provisions. While a large family would be needed to tend the family farm, supporting many children in an urban area is expensive. As a result, economic development is associated with couples choosing to have fewer children.
Access to healthcare decreases childhood mortality and provides the option of birth control. While decreased infant and childhood mortality alone would increase the population growth rate, people tend to have fewer children when they can be confident that all of their children are likely to survive; thus, as childhood mortality declines, total fertility rate also declines, lowering the population growth rate.
The education of women and girls is also associated with a decreased total fertility rate. Furthermore, family planning education programs have had highly positive effects in some countries on limiting population growth rates and increasing standards of living. When women have knowledge of family planning, power to make decisions about their family size, and a variety of career options, fertility rate declines. In regions that have made recent strides in educating girls, families more often choose to have a small number of children so that they can afford to pay for their education regardless of gender.
References
Population Growth (Annual %). 2019 World Bank Group. Accessed 29 August 2020.
Growing at a slower pace, world population is expected to reach 9.7 billion in 2050 and could peak at nearly 11 billion around 2100. 2019. United Nations Department of Economic and Social Affairs. Accessed 29 August 2020.
Attributions
Modified by Melissa Ha from the following sources:
- The Human Population from Environmental Biology by Matthew R. Fisher (licensed under CC-BY)
- The Human Population from Biology by John W. Kimball (licensed under CC-BY)
- Human Population Growth from General Biology by OpenStax (licensed under CC-BY)