9.3: Evidence for Evolution
- Last updated
- Save as PDF
- Page ID
- 22503
A Horse Is a Horse, of Course, of Course
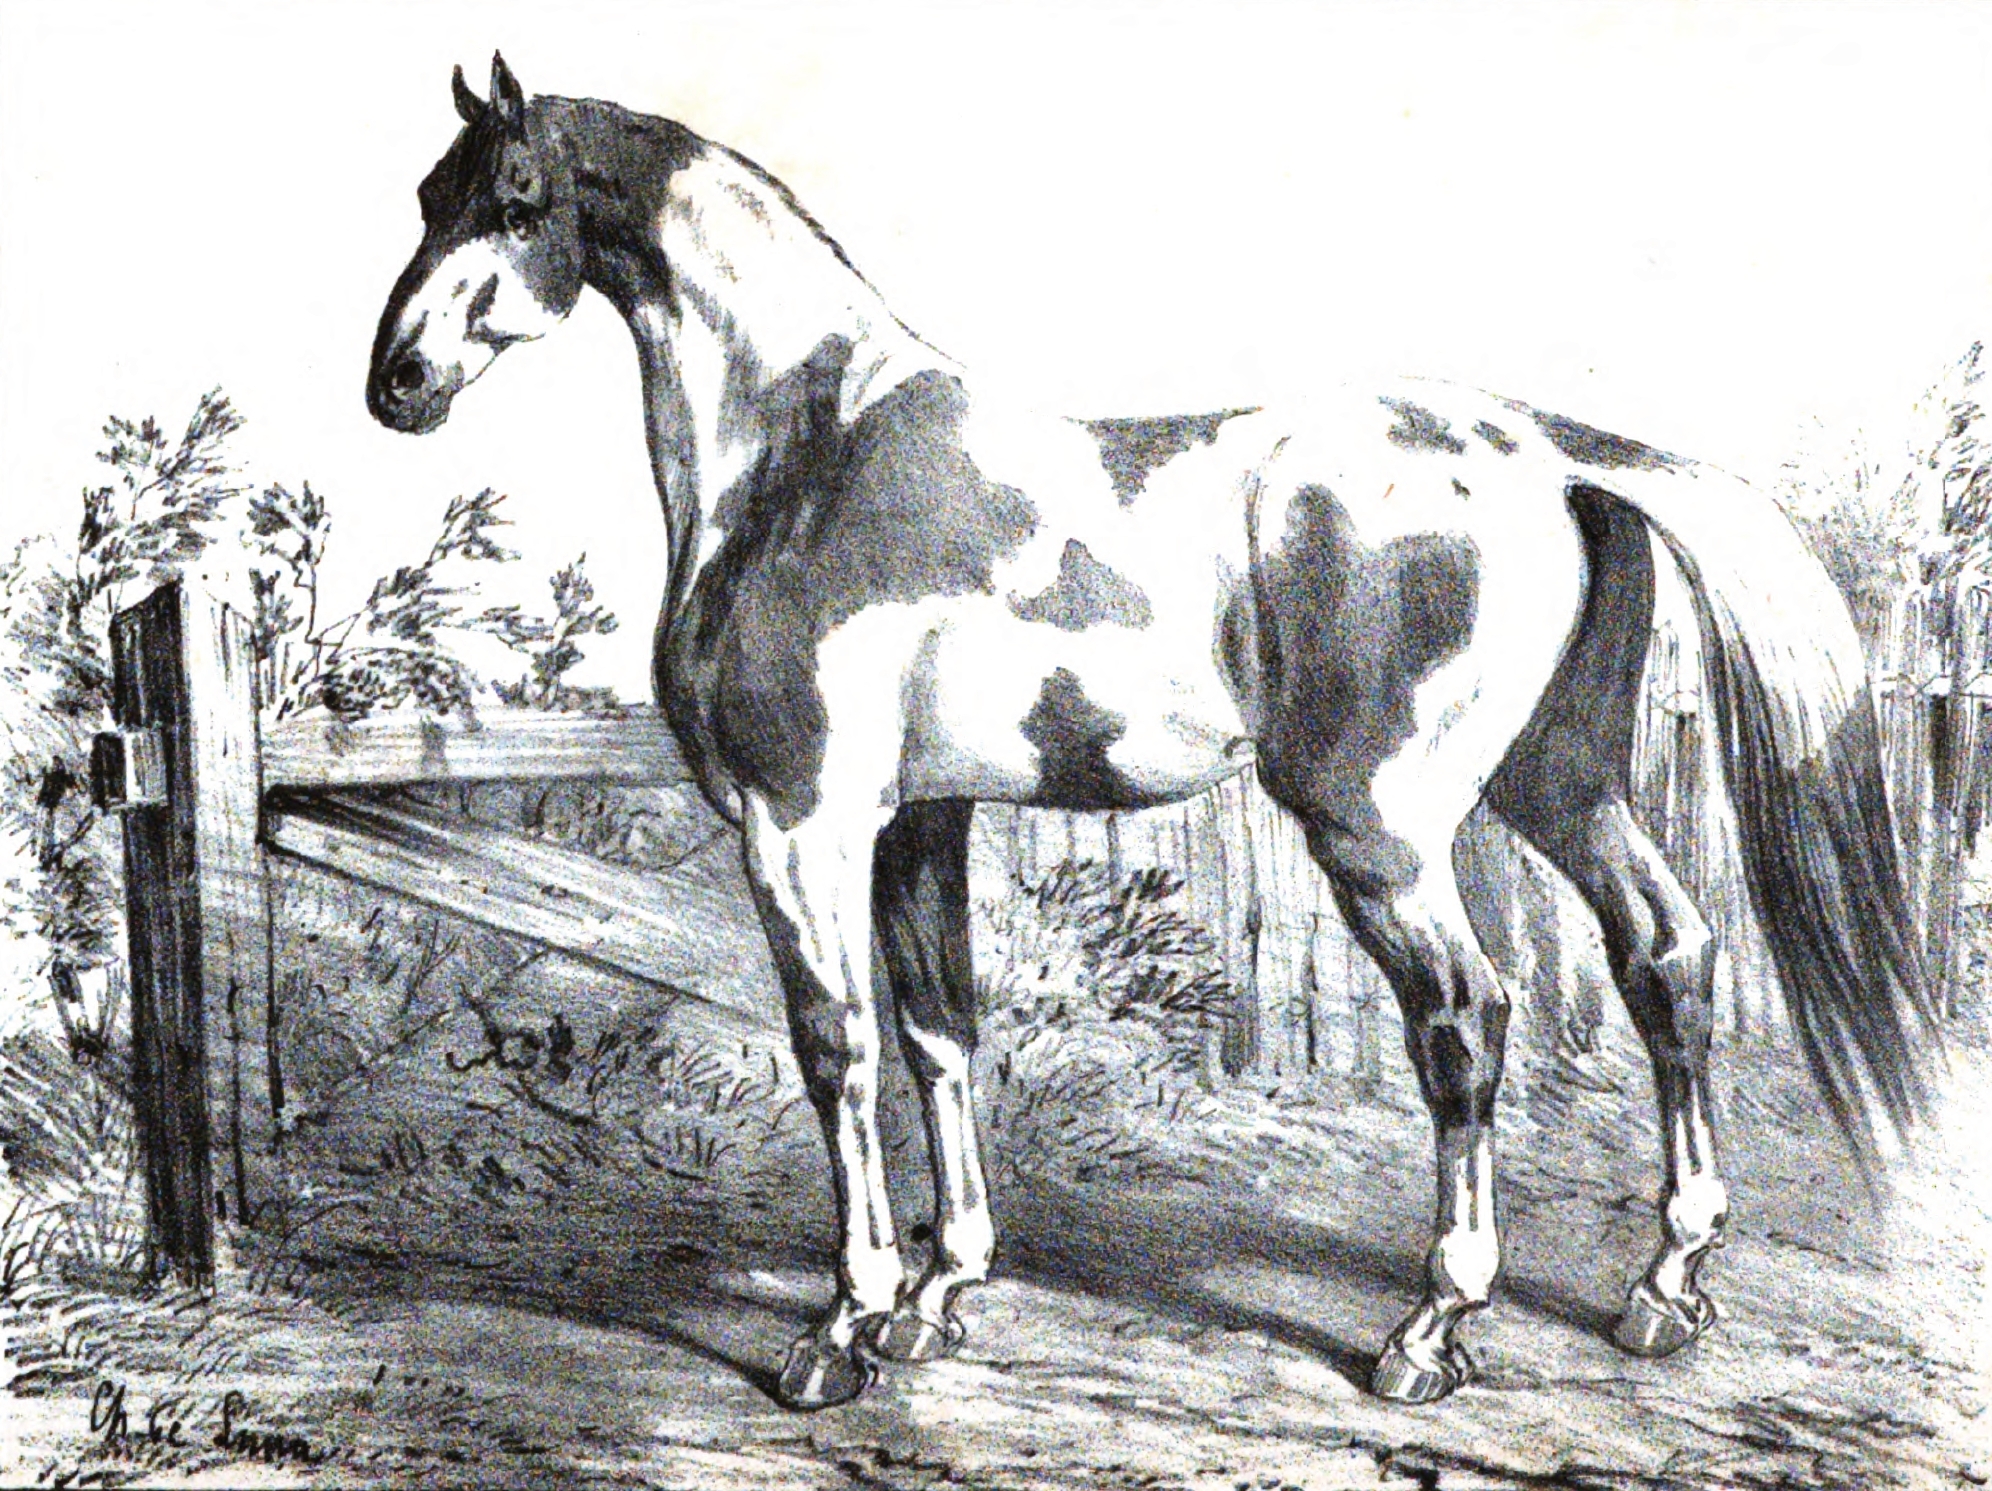
This drawing was created in 1848, but it's likely that you recognize the animal it depicts as a horse. Although horses haven't changed that much since this drawing was made, they have a long evolutionary history during which they changed significantly. How do we know? The answer lies in the fossil record.
Evidence from Fossils
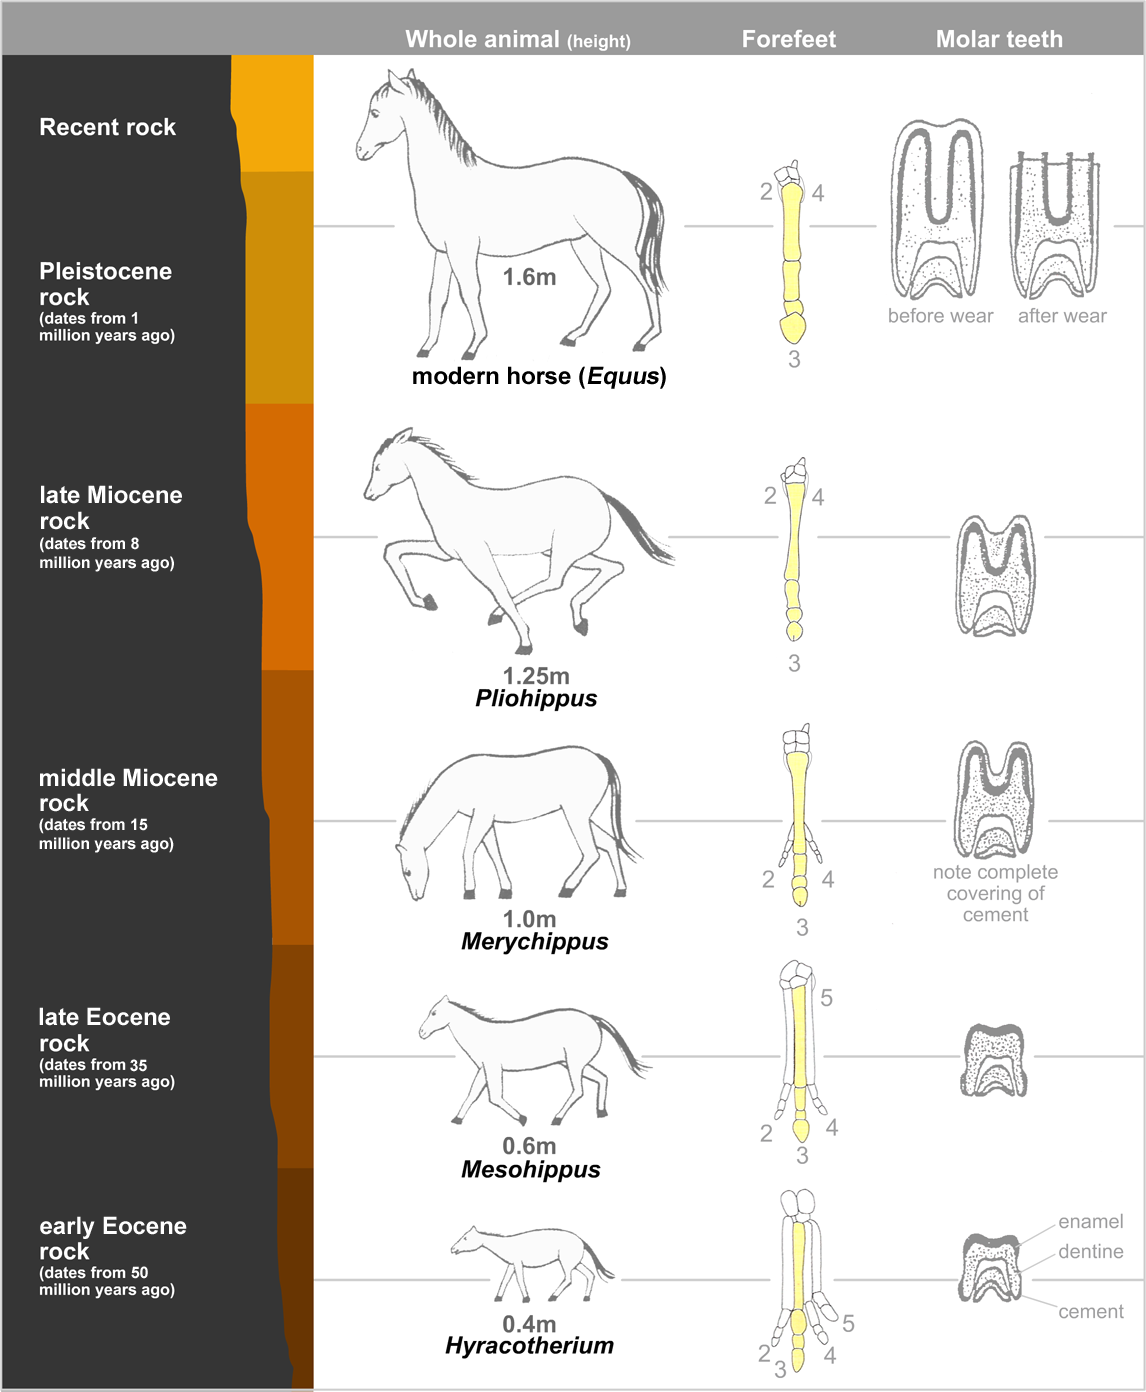
Fossils are a window into the past. They provide clear evidence that evolution has occurred. Scientists who find and study fossils are called paleontologists. How do they use fossils to understand the past? Consider the example of the horse, outlined in figure \(\PageIndex{2}\). Fossils spanning a period of more than 50 million years show how the horse evolved.
The oldest horse fossils show what the earliest horses were like. They were only 0.4 m tall, or about the size of a fox, and they had four long toes. Other evidence shows they lived in wooded marshlands, where they probably ate soft leaves. Over time, the climate became drier, and grasslands slowly replaced the marshes. Later fossils show that horses changed as well.
- They became taller, which would help them see predators while they fed in tall grasses. Eventually, they reached a height of about 1.6 m.
- They evolved a single large toe that eventually became a hoof. This would help them run swiftly and escape predators.
- Their molars (back teeth) became longer and covered with hard cement. This would allow them to grind tough grasses and grass seeds without wearing out their teeth.
Evidence from Living Species
Scientists can learn a great deal about evolution by studying living species. They can compare the anatomy, embryos, and DNA of modern organisms to help understand how they evolved.
Comparative Anatomy
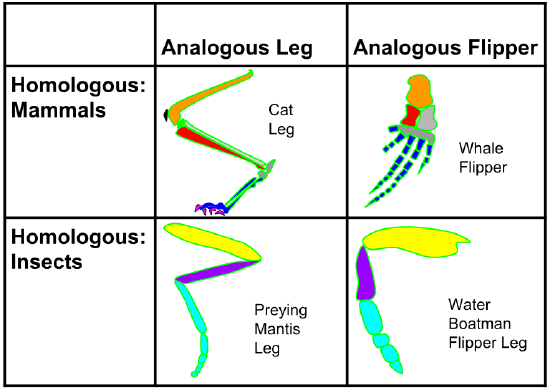
Comparative anatomy is the study of the similarities and differences in the structures of different species. Similar body parts may be homologous structures or analogous structures. Both provide evidence for evolution.
Homologous structures are structures that are similar in related organisms because they were inherited from a common ancestor. These structures may or may not have the same function in the descendants. Figure \(\PageIndex{3}\) shows the upper appendages of several different mammals. They all have the same basic pattern of bones, although they now have different functions. All of these mammals inherited this basic bone pattern from a common ancestor.
Analogous structures are structures that are similar in unrelated organisms. The structures are similar because they evolved to do the same job, not because they were inherited from a common ancestor. For example, the wings of bats and birds, shown in the figure that follows, look similar on the outside and have the same function. However, wings evolved independently in the two groups of animals. This is apparent when you compare the pattern of bones inside the wings.
Comparative Embryology
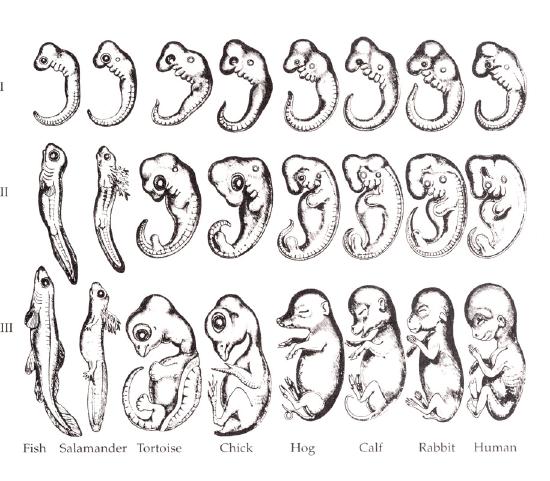
Comparative embryology is the study of the similarities and differences in the embryos of different species. Similarities in embryos are likely to be evidence of common ancestry. All vertebrate embryos, for example, have gill slits and tails. All of the embryos in Figure \(\PageIndex{4}\), except for fish, lose their gill slits by adulthood, and some of them also lose their tail. In humans, the tail is reduced to the tail bone. Thus, similarities organisms share as embryos may no longer be present by adulthood. This is why it is valuable to compare organisms in the embryonic stage.
Vestigial Structures
Structures like the human tail bone are called vestigial structures. Evolution has reduced their size because the structures are no longer used. The human appendix is another example of a vestigial structure. It is a tiny remnant of a once-larger organ. In a distant ancestor, it was needed to digest food, but it serves no purpose in the human body today. Why do you think structures that are no longer used shrink in size? Why might a full-sized, unused structure reduce an organism’s fitness?
Comparing DNA
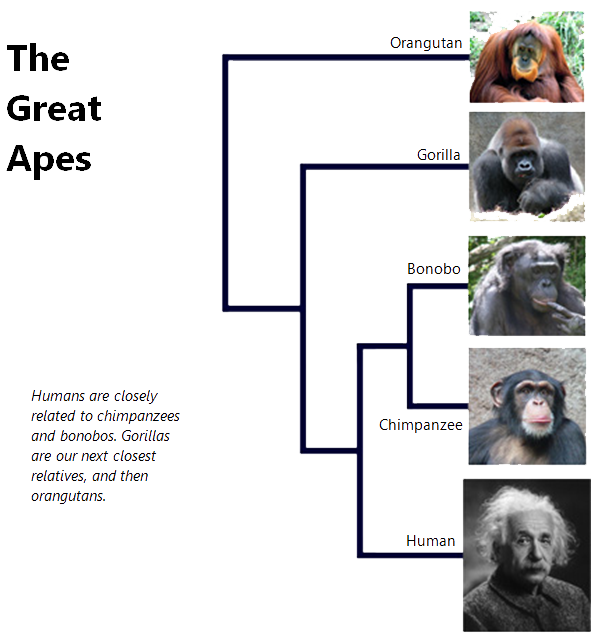
Darwin could compare only the anatomy and embryos of living things. Today, scientists can compare their DNA. Similar DNA sequences are the strongest evidence for evolution from a common ancestor. Look at the diagram in Figure \(\PageIndex{5}\). The diagram is a cladogram, a branching diagram showing related organisms. Each branch represents the emergence of new traits that separate one group of organisms from the rest. The cladogram in the figure shows how humans and apes are related based on their DNA sequences.
Evidence from Biogeography
Biogeography is the study of how and why organisms live where they do. It provides more evidence for evolution. Let’s consider the camel family as an example.
Biogeography of Camels: An Example
Today, the camel family includes different types of camels (Figure \(\PageIndex{6}\)). All of today’s camels are descended from the same camel ancestors. These ancestors lived in North America about a million years ago.
Early North American camels migrated to other places. Some went to East Asia via a land bridge during the last ice age. A few of them made it all the way to Africa. Others went to South America by crossing the Isthmus of Panama. Once camels reached these different places, they evolved independently. They evolved adaptations that suited them for the particular environment where they lived. Through natural selection, descendants of the original camel ancestors evolved the diversity they have today.

Island Biogeography
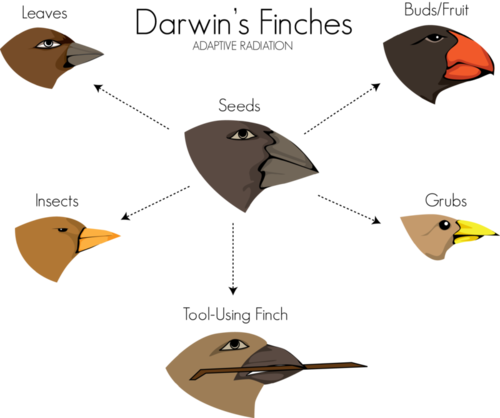
The biogeography of islands yields some of the best evidence for evolution. Consider the birds called finches that Darwin studied on the Galápagos Islands (Figure \(\PageIndex{7}\))). All of the finches probably descended from one bird that arrived on the islands from South America. Until the first bird arrived, there had never been birds on the islands. The first bird was a seed eater. It evolved into many finch species, each adapted for a different type of food. This is an example of adaptive radiation. This is the process by which a single species evolves into many new species to fill available ecological niches.
Eyewitnesses to Evolution
In the 1970s, biologists Peter and Rosemary Grant went to the Galápagos Islands to re-study Darwin’s finches. They spent more than 30 years on the project, but their efforts paid off. They were able to observe evolution by natural selection actually taking place.
While the Grants were on the Galápagos, a drought occurred, so fewer seeds were available for finches to eat. Birds with smaller beaks could crack open and eat only the smaller seeds. Birds with bigger beaks could crack open and eat seeds of all sizes. As a result, many of the smaller-beaked birds died in the drought, whereas birds with bigger beaks survived and reproduced. As shown in Figure \(\PageIndex{8}\), within 2 years, the average beak size in the finch population increased. In other words, evolution by natural selection had occurred.
Review
- How do paleontologists learn about evolution?
- Describe what fossils reveal about the evolution of the horse.
- What are vestigial structures? Give an example.
- Define biogeography.
- Describe an example of island biogeography that provides evidence of evolution.
- Humans and apes have five fingers they can use to grasp objects. Are these analogous or homologous structures? Explain.
- Compare and contrast homologous and analogous structures. What do they reveal about evolution?
- Why does comparative embryology show similarities between organisms that do not appear to be similar as adults?
- What does a cladogram show?
- Explain how DNA is useful in the study of evolution.
- A bat wing is more similar in anatomical structure to a cat forelimb than to a bird wing. Answer the following questions about these structures.
- Which pairs are homologous structures?
- Which pairs are analogous structures?
- Based on this, do you think a bat is more closely related to a cat or to a bird? Explain your answer.
- If you wanted to test the answer you gave to part c, what is a different type of evidence you could obtain that might help answer the question?
- True or False. Fossils are the only type of evidence that supports the theory of evolution.
- True or False. Adaptive radiation is a type of evolution that produces new species.
Explore More
The Galapagos finches remain one of our world's greatest examples of adaptive radiation. Watch as these evolutionary biologists detail their 40-year project to document the evolution of these famous finches:
Attributions
- Cheval de Dongolah by F Joseph Cardini, released into the public domain via Wikimedia Commons
- Horse evolution by Mcy jerry licensed CC BY-SA 3.0 via Wikimedia Commons
- Analogous & Homologous Structures by Vanessablakegraham, CC BY-SA 3.0 via Wikimedia Commons
- Haeckel drawings by Romanes, G. J, released into the public domain via Wikimedia Commons
- The great apes by Merrilydancingape, CC BY-SA 3.0 via Wikimedia Commons
- Map by CK-12 foundation licensed CC BY-NC 3.0
- Finch Beaks by Christopher Auyeung vua CK-12 foundation licensed CC BY-NC 3.0
- Evolution of finch beaks by Lumen Learning, CC BY-SA 3.0
- Text adapted from Human Biology by CK-12 licensed CC BY-NC 3.0


