
9.4: Implications of Climate Change
- Page ID
- 94423

Past and Present-day GHG Emissions Will Affect Climate Far into the Future
Many greenhouse gases stay in the atmosphere for long periods of time. As a result, even if emissions stopped increasing, atmospheric greenhouse gas concentrations would continue to remain elevated for hundreds of years. Moreover, if we stabilized concentrations and the composition of today’s atmosphere remained steady (which would require a dramatic reduction in current greenhouse gas emissions), surface air temperatures would continue to warm. This is because the oceans, which store heat, take many decades to fully respond to higher greenhouse gas concentrations. The ocean’s response to higher greenhouse gas concentrations and higher temperatures will continue to impact climate over the next several decades to hundreds of years.
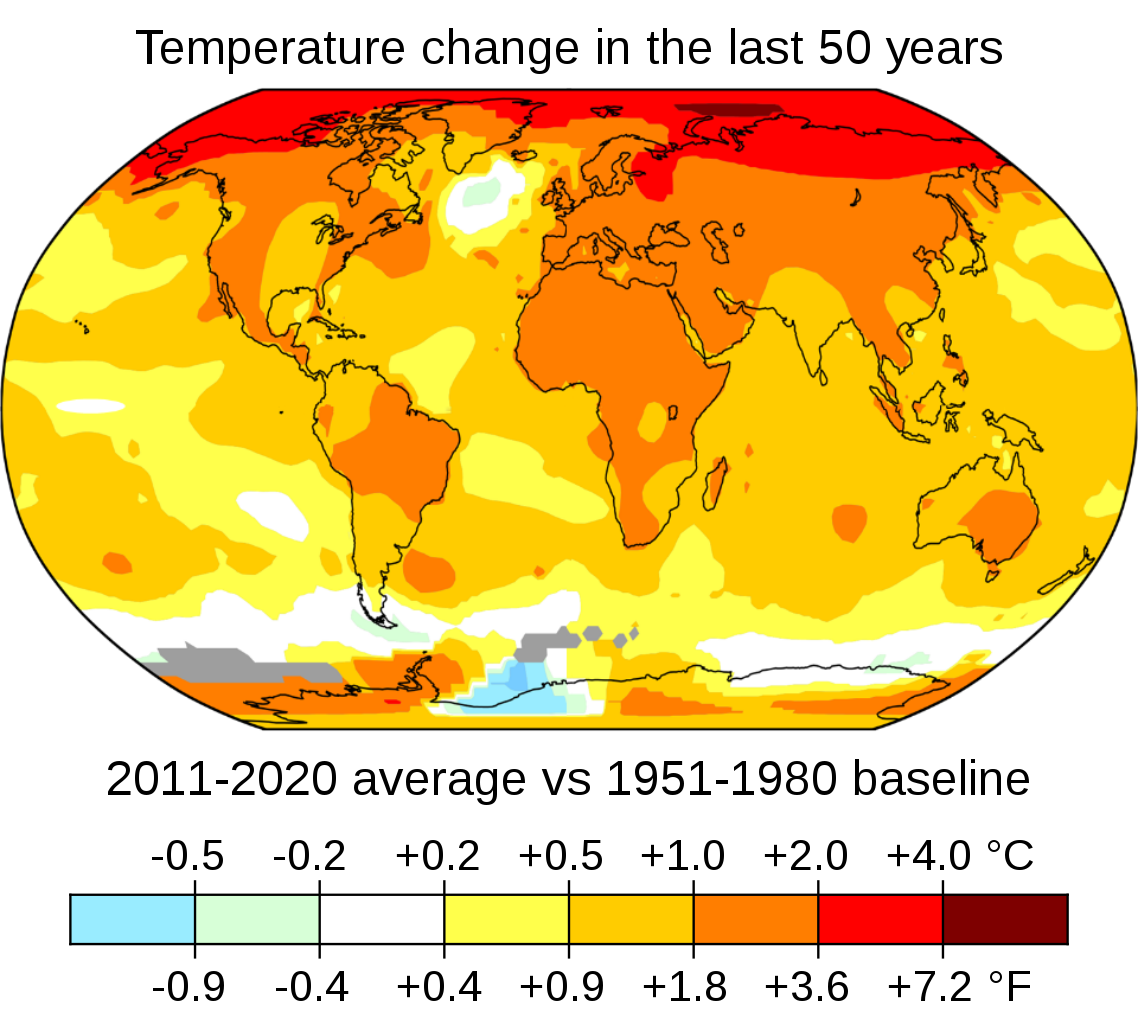
Figure \(\PageIndex{1}\): Temperature increases have been most pronounced in northern latitudes and over land masses. The colors represent the temperature difference between the 2011-2020 average and the 1951-1980 baseline, with warmer colors (yellow, orange, red) representing increases, and cool colors (green, blue) representing decreases. The image uses longer term averages of at least a decade to smooth out climate variability due to factors such as El Niño. Grey areas in the image have insufficient data for rendering. Image and caption (modified) from NASA’s Scientific Visualization Studio/Eric Fisk (public domain).
Future Temperature Changes
Climate models project the following key temperature-related changes:
- Average global temperatures are expected to increase by 2°F to 11.5°F by 2100, depending on the level of future greenhouse gas emissions, and the outcomes from various climate models.
- By 2100, global average temperature is expected to warm at least twice as much as it has during the last 100 years.
- Ground-level air temperatures are expected to continue to warm more rapidly over land than oceans.
- Some parts of the world are projected to see larger temperature increases than the global average.
These changes will impact our food supply, water resources, infrastructure, ecosystems, and even our own health. The magnitude and rate of future climate change will primarily depend on the following factors:
- The rate at which levels of greenhouse gas concentrations in our atmosphere continue to increase,
- How strongly features of the climate (e.g., temperature, precipitation, and sea level) respond to the expected increase in greenhouse gas concentrations,
- Natural influences on climate (e.g., from volcanic activity and changes in the sun’s intensity) and natural processes within the climate system (e.g., changes in ocean circulation patterns).
Future Precipitation and Storm Events
Patterns of precipitation and storm events, including both rain and snowfall are likely to change. However, some of these changes are less certain than the changes associated with temperature. Because warm air is able to hold more water than cold air, the general global trend over the past century has been one of increasing precipitation (Figure \(\PageIndex{2}\)).
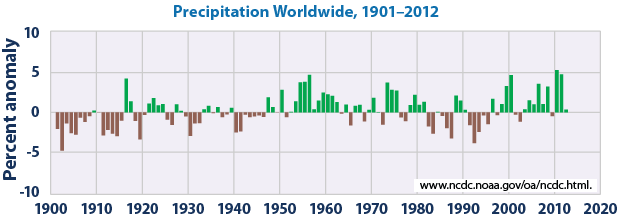 Figure \(\PageIndex{2}\): Global precipitation anomalies compared with the average over the period from 1901 to 2012.
[“Precipitation Worldwide, 1901-2013” by NASA. Public domain.]
Projections show that future precipitation and storm changes will vary by season and region. Some regions may have less precipitation, some may have more precipitation, and some may have little or no change. The amount of rain falling in heavy precipitation events is likely to increase in most regions, while storm tracks are projected to shift towards the poles. Climate models project the following precipitation and storm changes:
- Global average annual precipitation through the end of the century is expected to increase, although changes in the amount and intensity of precipitation will vary by region.
- The intensity of precipitation events will likely increase on average. This will be particularly pronounced in tropical and high-latitude regions, which are also expected to experience overall increases in precipitation.
- The strength of the winds associated with tropical storms is likely to increase. The amount of precipitation falling in tropical storms is also likely to increase.
- Annual average precipitation is projected to increase in some areas and decrease in others.
Occurrence and intensity of extreme weather events such as hurricanes, precipitation, and heatwaves are increasing [3; 6]. Since the 1980s, hurricanes, which are generated from warm ocean water, have increased in frequency, intensity, and duration and connections to a warmer climate are likely. Since 1910, average precipitation has increased by 10% in the contiguous United States, and much of this increase is associated with heavy precipitation events like storms [18]. However, the distribution is not even and more precipitation is projected for the northern United States while less precipitation is projected for the already dry southwest [3]. Further, heatwaves have increased and rising temperatures are already affecting crop yields in northern latitudes [6]. Increased heat allows for greater moisture capacity in the atmosphere, increasing the potential for more extreme events [19].
One of the other risks for coastal populations, besides sea-level rise, is that climate warming is also associated with an increase in the intensity of tropical storms (e.g., hurricanes or typhoons), which almost always bring serious flooding from intense rain and storm surges. Some recent examples are New Orleans in 2005 with Hurricane Katrina, and New Jersey and New York in 2012 with Hurricane Sandy (Figure \(\PageIndex{3}\)).
![Figure 19.14 Damage to the Casino Pier, Seaside Heights, New Jersey, from Hurricane Sandy, November 2012 [https://upload.wikimedia.org/Wikipedia/commons/c/cb/Hurricane_Sandy_New_Jersey_Pier.jpg]](http://opentextbc.ca/geology/wp-content/uploads/sites/110/2015/08/Damage-to-the-Casino-Pier.jpg)
Figure \(\PageIndex{3}\): Damage to the Casino Pier, Seaside Heights, New Jersey, from Hurricane Sandy, November 2012
[“Hurricane Sandy New Jersey Pier” © Master Sgt. Mark C. Olsen/U.S. Air Force/New Jersey National Guard. CC BY.]
Tropical storms get their energy from the evaporation of warm seawater in tropical regions. In the Atlantic Ocean, this takes place between 8° and 20° N in the summer. Figure \(\PageIndex{4}\) shows the variations in the sea-surface temperature (SST) of the tropical Atlantic Ocean (in blue) versus the amount of power represented by Atlantic hurricanes between 1950 and 2008 (in red). Not only has the overall intensity of Atlantic hurricanes increased with the warming since 1975, but the correlation between hurricanes and sea-surface temperatures is very strong over that time period.

Figure \(\PageIndex{4}\): Relationship between Atlantic tropical storm cumulative annual intensity and Atlantic sea-surface temperatures
[“Atlantic sea-surface T vs. tropical storm power” © Steven Earle. CC BY.
Based on data from Papers, Data, and Graphics Pertaining to Tropical Cyclone Trends and Variability.]
For several weeks in July and August of 2010, a massive heat wave affected western Russia, especially the area southeast of Moscow, and scientists have stated that climate change was a contributing factor. Temperatures soared to over 40°C, as much as 12°C above normal over a wide area, and wildfires raged in many parts of the country. Over 55,000 deaths are attributed to the heat and to respiratory problems associated with the fires. A summary of the impacts of climate change on natural disasters is given in Figure \(\PageIndex{5}\). The major types of disasters related to climate are floods and storms, but the health implications of extreme temperatures are also becoming a great concern. In the decade 1971 to 1980, extreme temperatures were the fifth most common natural disasters; by 2001 to 2010, they were the third most common.

We’ve all experienced the effects of climate change over the past decade. However, it’s not straightforward for climatologists to make the connection between a warming climate and specific weather events, and most are justifiably reluctant to ascribe any specific event to climate change. In this respect, the best measures of climate change are those that we can detect over several decades, such as the temperature changes shown in Figure \(\PageIndex{1}\), or the sea level rise shown in Figure \(\PageIndex{8}\).
Future Ice, Snowpack, and Permafrost
Arctic sea ice is already declining. The area of snow cover in the Northern Hemisphere has decreased since 1970. Permafrost temperature has increased over the last century, making it more susceptible to thawing. Over the next century, it is expected that sea ice will continue to decline, glaciers will continue to shrink, snow cover will continue to decrease, and permafrost will continue to thaw.
For every 2°F of warming, models project about a 15% decrease in the extent of annually averaged sea ice and a 25% decrease in September Arctic sea ice. The coastal sections of the Greenland and Antarctic ice sheets are expected to continue to melt or slide into the ocean. If the rate of this ice melting increases in the 21st century, the ice sheets could add significantly to global sea level rise. Glaciers are expected to continue to decrease in size. The rate of melting is expected to continue to increase, which will contribute to sea level rise.
Glaciers are ice on top of the land. Alpine glaciers, ice sheets, and sea ice are all melting. Almost all major alpine glaciers are shrinking, deflating, and retreating and the rate of ice mass loss is unprecedented (never observed before) since the 1940’s when quality records for most began.Before anthropogenic warming, glacial activity was variable with some retreating and some advancing [17]. The extent of spring snow cover has decreased. Satellites have recorded that Antarctica is melting at 118 gigatons per year and Greenland is melting at 281 gigatons per year (1 gigaton is over 2 trillion pounds) (Figure \(\PageIndex{6}\)).

Figure \(\PageIndex{6}\): Decline of Antarctic ice mass from 2002 to 2016
In addition, the extent of sea ice is shrinking. Sea ice is ice floating in the ocean (not on land like a glacier). Most sea ice is at the North Pole which is only occupied by the Arctic Ocean and sea ice [3; 6]. Below, the NOAA animation shows how perennial sea ice has declined from 1987 to 2015. The oldest ice is white and the youngest (seasonal) ice is dark blue. The amount of old ice has declined from 20% in 1985 to 3% in 2015.
This loss of ice is leading to increases in the global sea level. On average, the sea is rising at a rate of 1.8 mm per year. However, between 1993 and 2010 the rate of sea level increase ranged between 2.9 and 3.4 mm per year. A variety of factors affect the volume of water in the ocean, including the temperature of the water (the density of water is related to its temperature) and the amount of water found in rivers, lakes, glaciers, polar ice caps, and sea ice. As glaciers and polar ice caps melt, there is a significant contribution of liquid water that was previously frozen.
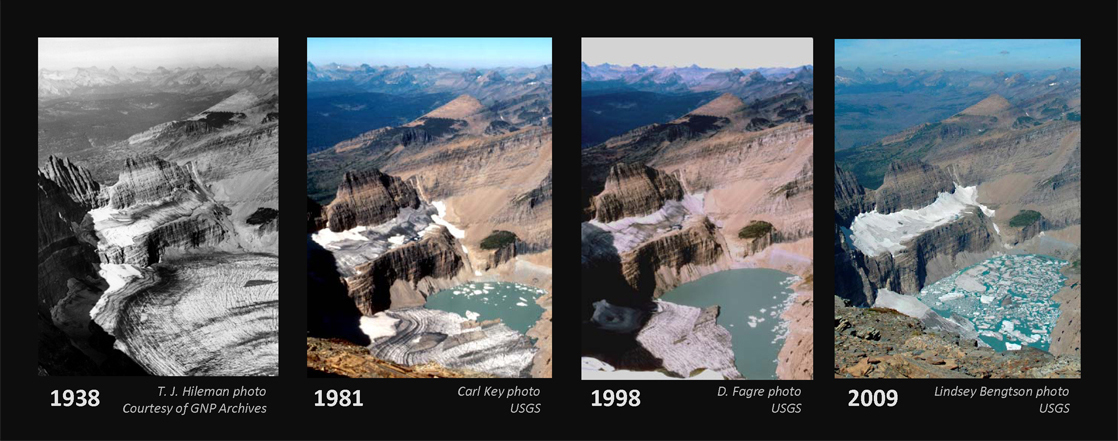
A number of global events have occurred that may be attributed to climate change during our lifetimes. Explore melting glaciers at NASA’s interactive Global Ice Viewer. Glacier National Park in Montana is undergoing the retreat of many of its glaciers, a phenomenon known as glacier recession. In 1850, the area contained approximately 150 glaciers. By 2010, however, the park contained only about 24 glaciers greater than 25 acres in size. One of these glaciers is the Grinnell Glacier (Figure \(\PageIndex{7}\)) at Mount Gould. Between 1966 and 2005, the size of Grinnell Glacier shrank by 40 percent. Similarly, the mass of the ice sheets in Greenland and the Antarctic is decreasing: Greenland lost 150–250 km3 of ice per year between 2002 and 2006. In addition, the size and thickness of the Arctic sea ice is decreasing.
Future Sea Level Change
Warming temperatures contribute to sea level rise by expanding ocean water, melting mountain glaciers and ice caps, and causing portions of the Greenland and Antarctic ice sheets to melt or flow into the ocean. Since 1870, global sea level has risen by about 8 inches. Estimates of future sea level rise vary for different regions, but global sea level for the next century is expected to rise at a greater rate than during the past 50 years. The contribution of thermal expansion, ice caps, and small glaciers to sea level rise is relatively well-studied, but the impacts of climate change on ice sheets are less understood and represent an active area of research. Thus, it is more difficult to predict how much changes in ice sheets will contribute to sea level rise. Greenland and Antarctic ice sheets could contribute an additional 1 foot of sea level rise, depending on how the ice sheets respond.
Sea-level is rising 3.4 millimeters (0.13 inches) per year and has risen 0.19 meters (7.4 inches) from 1901 to 2010 (Figure \(\PageIndex{8}\)). This is thought largely to be from both the melting of glaciers and thermal expansion. Thermal expansion means that as objects such as solids, liquids, and gases heat up, they expand in volume. Since 1970, the melting of glaciers and thermal expansion account for 75% of the sea-level rise [6].
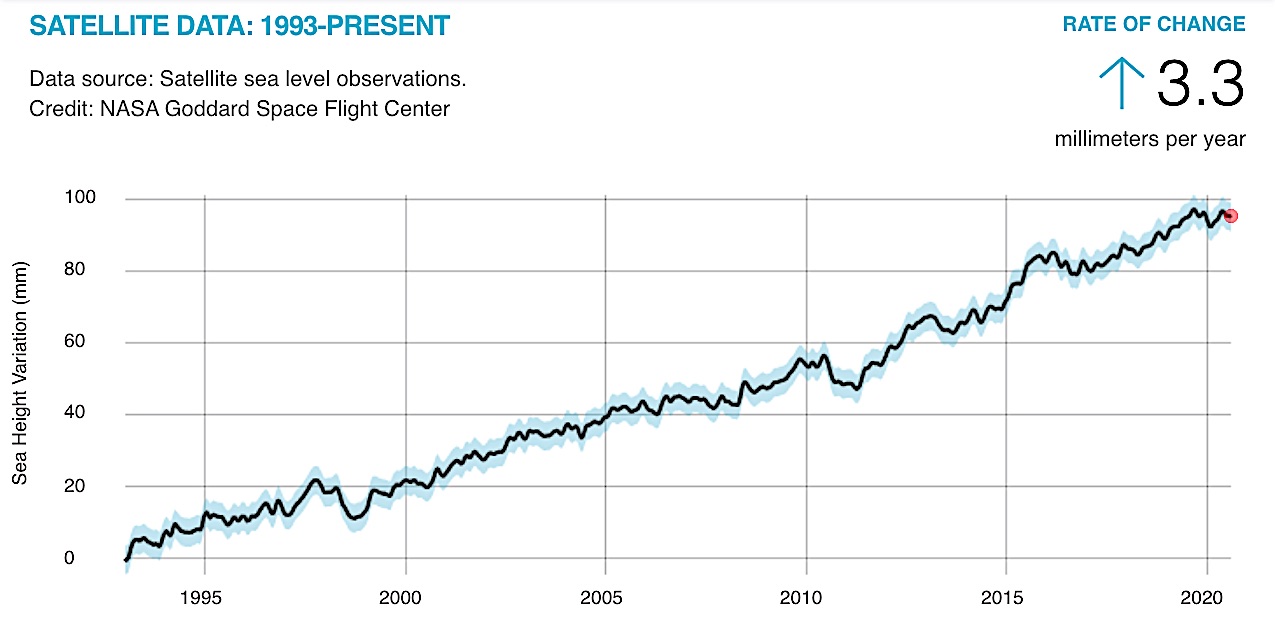
Figure \(\PageIndex{8}\): Sea height variation (mm) over time. Sea height has increased about 3.3 millimeters per year on average since 1993. Data is from satellite sea level observations by the NASA Goddard Space Flight Center. Image by NASA (public domain).
Projections for sea level rise to the end of this century vary widely. This is in large part because we do not know which of the above climate change scenarios (Figure \(\PageIndex{9}\)) we will most closely follow, but many are in the range from 0.5 m to 2.0 m. One of the problems in predicting sea level rise is that we do not have a strong understanding of how large ice sheets, such as Greenland and Antarctica, will respond to future warming. Another issue is that the oceans don’t respond immediately to warming. For example, with the current amount of warming, we are already committed to a future sea level rise of between 1.3 m and 1.9 m, even if we could stop climate change today. This is because it takes decades to centuries for the existing warming of the atmosphere to be transmitted to depth within the oceans and to exert its full impact on large glaciers. Most of that committed rise would take place over the next century, but some would be delayed longer. And for every decade that the current rates of climate change continue, that number increases by another 0.3 m. In other words, if we don’t make changes quickly, by the end of this century we’ll be locked into 3 m of future sea level rise. In a 2008 report, the Organization for Economic Co-operation and Development (OECD) estimated that by 2070 approximately 150 million people living in coastal areas could be at risk of flooding due to the combined effects of sea level rise, increased storm intensity, and land subsidence. The assets at risk (buildings, roads, bridges, ports, etc.) are in the order of $35 trillion ($35,000,000,000,000). Countries with the greatest exposure of population to flooding are China, India, Bangladesh, Vietnam, U.S.A., Japan, and Thailand. Some of the major cities at risk include Shanghai, Guangzhou, Mumbai, Kolkata, Dhaka, Ho Chi Minh City, Tokyo, Miami, and New York.
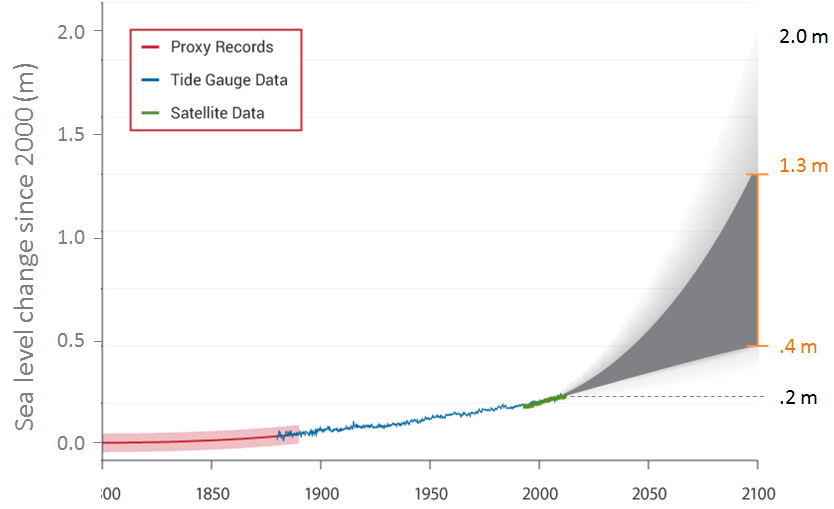
Figure \(\PageIndex{9}\): Projected sea-level increases to 2100, showing likely range (grey) and possible maximum
[Adapted by Steven Earle from “Past and Projected Changes in Global Sea Level Rise”
based on data from Parris et al. 2012 with input from NASA Jet Propulsion Laboratory.]
Regional and local factors will influence future relative sea level rise for specific coastlines around the world (Figure \(\PageIndex{10}\)). For example, relative sea level rise depends on land elevation changes that occur as a result of subsidence (sinking) or uplift (rising). Relative sea level rise also depends on local changes in currents, winds, salinity, and water temperatures, as well as proximity to thinning ice sheets. Assuming that these historical geological forces continue, a 2-foot rise in global sea level by 2100 would result in the following relative sea level rise:
- 2.3 feet at New York City
- 2.9 feet at Hampton Roads, Virginia
- 3.5 feet at Galveston, Texas
- 1 foot at Neah Bay in Washington state
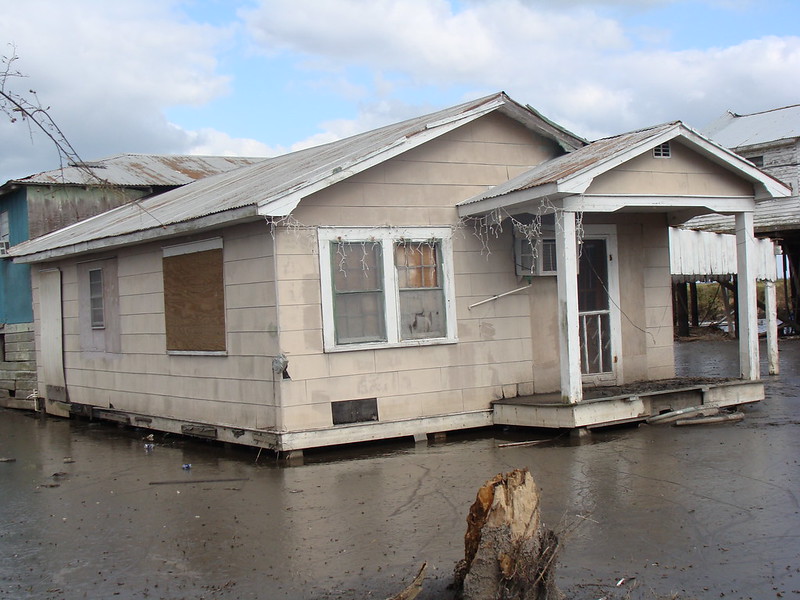
Figure \(\PageIndex{10}\): The United States government paid for the residents of Isle De Jean Charles, an island south of Louisiana (that is also part of Louisiana), to relocate when it became inhabitable due to sea level rise. Image by Karen Apricot (CC-BY-SA).
Future Ocean Acidification
Since 1750, about 40% of the new anthropogenic carbon dioxide has remained in the atmosphere. The remaining 60% gets absorbed by the ocean and vegetation. Therefore, the ocean has absorbed about 30% of new anthropogenic carbon dioxide. When carbon dioxide gets absorbed in the ocean, it creates carbonic acid which makes the ocean more acidic. Ocean acidification is the process of ocean waters decreasing in pH. Oceans become more acidic as carbon dioxide (CO2) emissions in the atmosphere dissolve in the ocean. This change is measured on the pH scale, with lower values being more acidic. The pH level of the oceans has decreased by approximately 0.1 pH units since pre-industrial times, which is equivalent to a 25% increase in acidity. The pH level of the oceans is projected to decrease even more by the end of the century as CO2 concentrations are expected to increase for the foreseeable future. Ocean acidification adversely affects many marine species, including plankton, mollusks, shellfish, and corals. As ocean acidification increases, the availability of calcium carbonate will decline. Calcium carbonate is a key building block for the shells and skeletons of many marine organisms. Acidification combined with warmer temperature and lower oxygen levels is expected to have severe impacts on marine ecosystems and human-used fisheries, possibly affecting our ocean-derived food sources [6].
Corals require the right combination of temperature, light, and the presence of calcium carbonate (which they use to build their skeletons). As atmospheric carbon dioxide (CO2) levels rise, some of the excess CO2 dissolves into ocean water, reducing its calcium carbonate saturation. Calcium carbonate saturation has already been reduced considerably from its pre-industrial level, and model projections suggest much greater reductions in the future. If atmospheric CO2 concentrations double, coral calcification rates are projected to decline by more than 30%. If CO2 concentrations continue to rise at their current rate, corals could become rare on tropical and subtropical reefs by 2050. Under projections for the future, it is very unlikely that calcium carbonate saturation levels will be adequate to support coral reefs in any U.S. waters.
Plant Productivity
Watch this NASA video to discover the mixed effects of global warming on plant growth. While scientists found that warmer temperatures in the 1980s and 1990s caused an increase in plant productivity, this advantage has since been counteracted by more frequent droughts.
Mismatched Interactions
In addition to some abiotic conditions changing in response to climate change, many organisms are also being affected by the changes in temperature. Temperature and precipitation play key roles in determining the geographic distribution and phenology of plants and animals. Phenology is the study of the effects of climatic conditions on the timing of periodic life cycle events, such as flowering in plants or migration in birds.
Researchers have shown that 385 plant species in Great Britain are flowering 4.5 days sooner than was recorded earlier during the previous 40 years. In addition, insect-pollinated species were more likely to flower earlier than wind-pollinated species. The impact of changes in flowering date would be mitigated if the insect pollinators emerged earlier. This mismatched timing of plants and pollinators could result in injurious ecosystem effects because, for continued survival, insect-pollinated plants must flower when their pollinators are present. Likewise, migratory birds rely on daylength cues, which are not influenced by climate change. Their insect food sources, however, emerge earlier in the year in response to warmer temperatures. As a result, climate change decreases food availability for migratory bird species.
Spread of Disease
This rise in global temperatures will increase the range of disease-carrying insects and the viruses and pathogenic parasites they harbor. Thus, diseases will spread to new regions of the globe. This spread has already been documented with dengue fever, a disease the affects hundreds of millions per year, according to the World Health Organization. Colder temperatures typically limit the distribution of certain species, such as the mosquitoes that transmit malaria, because freezing temperatures destroy their eggs. West Nile virus and Lyme disease are two examples that already directly affect North Americans, while dengue fever could be an issue in the future (dengue became a “nationally notifiable condition” in the United States in 2010).
Not only will the range of some disease-causing insects expand, the increasing temperatures will also accelerate their lifecycles, which allows them to breed and multiply quicker, and perhaps evolve pesticide resistance faster. In addition to dengue fever, other diseases are expected to spread to new portions of the world as the global climate warms. These include malaria, yellow fever, West Nile virus, zika virus, and chikungunya.
Climate change does not only increase the spread of diseases in humans. Rising temperatures are associated with greater amphibian mortality due to chytridiomycosis (see Invasive Species). Similarly, warmer temperatures have exacerbated bark beetle infestations of coniferous trees, such as pine an spruce.
Climate Change Affects Everyone
Our lives are connected to the climate. Human societies have adapted to the relatively stable climate we have enjoyed since the last ice age which ended several thousand years ago. A warming climate will bring changes that can affect our water supplies, agriculture, power and transportation systems, the natural environment, and even our own health and safety. Carbon dioxide can stay in the atmosphere for nearly a century, on average, so Earth will continue to warm in the coming decades. The warmer it gets, the greater the risk for more severe changes to the climate and Earth’s system. Although it’s difficult to predict the exact impacts of climate change, what’s clear is that the climate we are accustomed to is no longer a reliable guide for what to expect in the future
References
7. Oreskes, N. The scientific consensus on climate change. Science 306, 1686–1686 (2004).
11. Earle, S. Physical geology OER textbook. (BC Campus OpenEd, 2015).
Suggested Supplementary Reading
Intergovernmental Panel on Climate Change. 2013. 5th Assessment: Summary for Policymakers.
NASA. 2018. Global Climate Change: Vital Signs of the Planet. This website by NASA provides a multi-media smorgasbord of engaging content. Learn about climate change using data collected by NASA satellites and more.
Attributions
Modified by Kyle Whittinghill and Melissa Ha from the following sources:
- Contributed by Chris Johnson, Matthew D. Affolter, Paul Inkenbrandt, & Cam Mosher Faculty (Geology) at Salt Lake Community College
- Sourced from OpenGeology from An Introduction to Geology Chapter Chapter 15: Global Climate Change
- ”Physical Geology” by Steven Earle used under a CC-BY 4.0 international license. Download this book for free at http://open.bccampus.ca
- 12.4 Climate Change from Essentials of Environmental Science by CK-12 and Kamala Dorsner (Essentials of Environmental Science by Kamala Doršner is licensed under CC BY 4.0.)
- Climate and the Effects of Global Climate Change from General Biology by OpenStax (licensed under CC-BY)
- Climate Change from Environmental Biology by Matthew R. Fisher (licensed under CC-BY)
- Carbon Cycle from Biology by John W. Kimball (licensed under CC-BY)