
1.15: Determination of Bacterial Numbers
- Page ID
- 79445

- Give at least three real-world examples why determining bacterial numbers is an important technique.
- Explain how the standard plate count approach works.
- Calculate CFU of an original sample.
- Explain how absorbance can be used as is a measure of sample turbidity and cell numbers.
- Tell what a spectrophotometer is and how it works.
- Compare and contrast the standard plate count approach and absorbance measurements as it relates to determining cell density in a sample and the type of information these techniques provide about the cells.
- Describe why a standard line correlating CFU and absorbance is important and how it can be used.
- Use a standard line as well as a standard line equation to determine CFU of a sample from absorbance readings.
- Successful conduct plate counts and absorbance readings.
- Graph CFU vs. absorbance and create a standard line.
- Calculate CFU for samples and compare with safety standards to make conclusions about the safety of the samples.
What is the Determination of Bacterial Numbers Approach and What is it Used for?

Figure 1: Professionals in government and industry measure the concentration of bacteria to maintain human safety and environmental health including: wastewater treatment (top left), food processing and food safety (top right), water recreation in oceans, lakes, ponds, rivers, and streams (bottom left), safety in swimming pools (bottom center), and safety of drinking water (bottom right). If treated wastewater still has too many bacteria, the water will undergo further treatment prior to being released into the environment. Foods that have unsafe levels of bacteria are disposed of and protocols enacted to fix the bacterial overgrowth in the facility. Natural waters that have unsafe levels of bacteria may be closed to recreation until they are safe again. Swimming pools may be closed if unsafe. Boil advisories are issued if drinking water has unsafe numbers of bacteria. This means that water used for drinking, cooking, and bathing must be boiled first to kill bacteria. These measures help to make sure that humans will not get sick and that the environment is kept safe.
Many microbiological studies require determining the concentration of viable bacterial cells within a sample. In addition to microbiological research, the concentration of viable bacterial cells is also important to examine to:
- make sure water is safe to drink
- make sure treated municipal wastewater is safe to release into the environment
- make sure water is safe to swim in (ocean, lakes, ponds, pools etc.)
- make sure food products are safe
Professionals in government and industry frequently test the safety of water and foods using the same type of approach described below to ascertain bacterial concentrations.
How does the Determination of Bacterial Numbers Approach Work?
The determination of bacterial numbers approach is used to answer one main question: what is the concentration of viable bacterial cells in this sample? This approach utilizes petri plates to conduct a standard plate count. The plate count will make it possible to determine cell concentrations, but it will take about 24 hours before we have those results.
Pairing the standard plate count technique with a faster method for estimating cell concentrations, absorbance measurements, can provide accurate cell concentrations within a couple minutes (rather than waiting 24 hours for cultures to grow). This involves creating a standard curve using plate count results and absorbance readings. Once a standard curve is produced, the number of bacteria in a sample can be determined using only absorbance readings and the standard curve (without the need to grow petri plate cultures for 24 hours).
Plate Count
Microbiologists use a technique called the standard plate count to estimate the population density of bacteria in a sample by plating a small and dilute portion of the sample and counting the number of bacteria colonies.
A single bacterial colony originates from a single bacterial cell. When a single cell is deposited on a petri plate, it divides to form a colony that is visible with the naked eye. Therefore, when we count then number of isolated bacterial colonies on a petri plate, we are counting the number of cells present in that sample.
We use serial dilutions to create decreasing concentrations of the original sample that are then plated so that a plate will be created with a low enough number of bacteria that we can count individual colonies. From that number, we can calculate the original cell density in the broth. A turbid broth culture of bacteria can have millions or billions of bacterial cells in a single milliliter! If we transferred bacteria directly from that tube to a petri plate, it would be impossible to count colonies since there would be an overwhelming amount of growth on the petri plate (often called a lawn of bacteria).

Figure 2: A bacterial culture can contain millions or billions of cells per mililiter! If even a small amount of that culture is plated directly onto a petri plate undiluted, it will form a "lawn" of bacteria where the colonies cannot be distinguished from each other since there are just so many of them growing together. This is why the standard plate count technique dilutes samples and conducts multiple dilutions to make sure that a countable number of bacterial colonies (25-250 colonies) is obtained on at least one of the petri plates.
Since we do not know how many bacteria are in a given sample or culture, we do not know how much we need to dilute the culture in order to grow a petri plate where the number of bacterial colonies is "countable" (we count a plate that has between 25-250 bacterial colonies). Therefore, we do a dilution series to create a number of plates, with a range of dilutions, in the hopes we will produce a countable plate. The number of colonies we count on a petri plate enables us to calculate the CFU or colony forming units. CFU is a measure of the concentration of the live, viable bacterial cells capable of reproducing when grown on a petri plate in cells per milliliter (cells/mL).
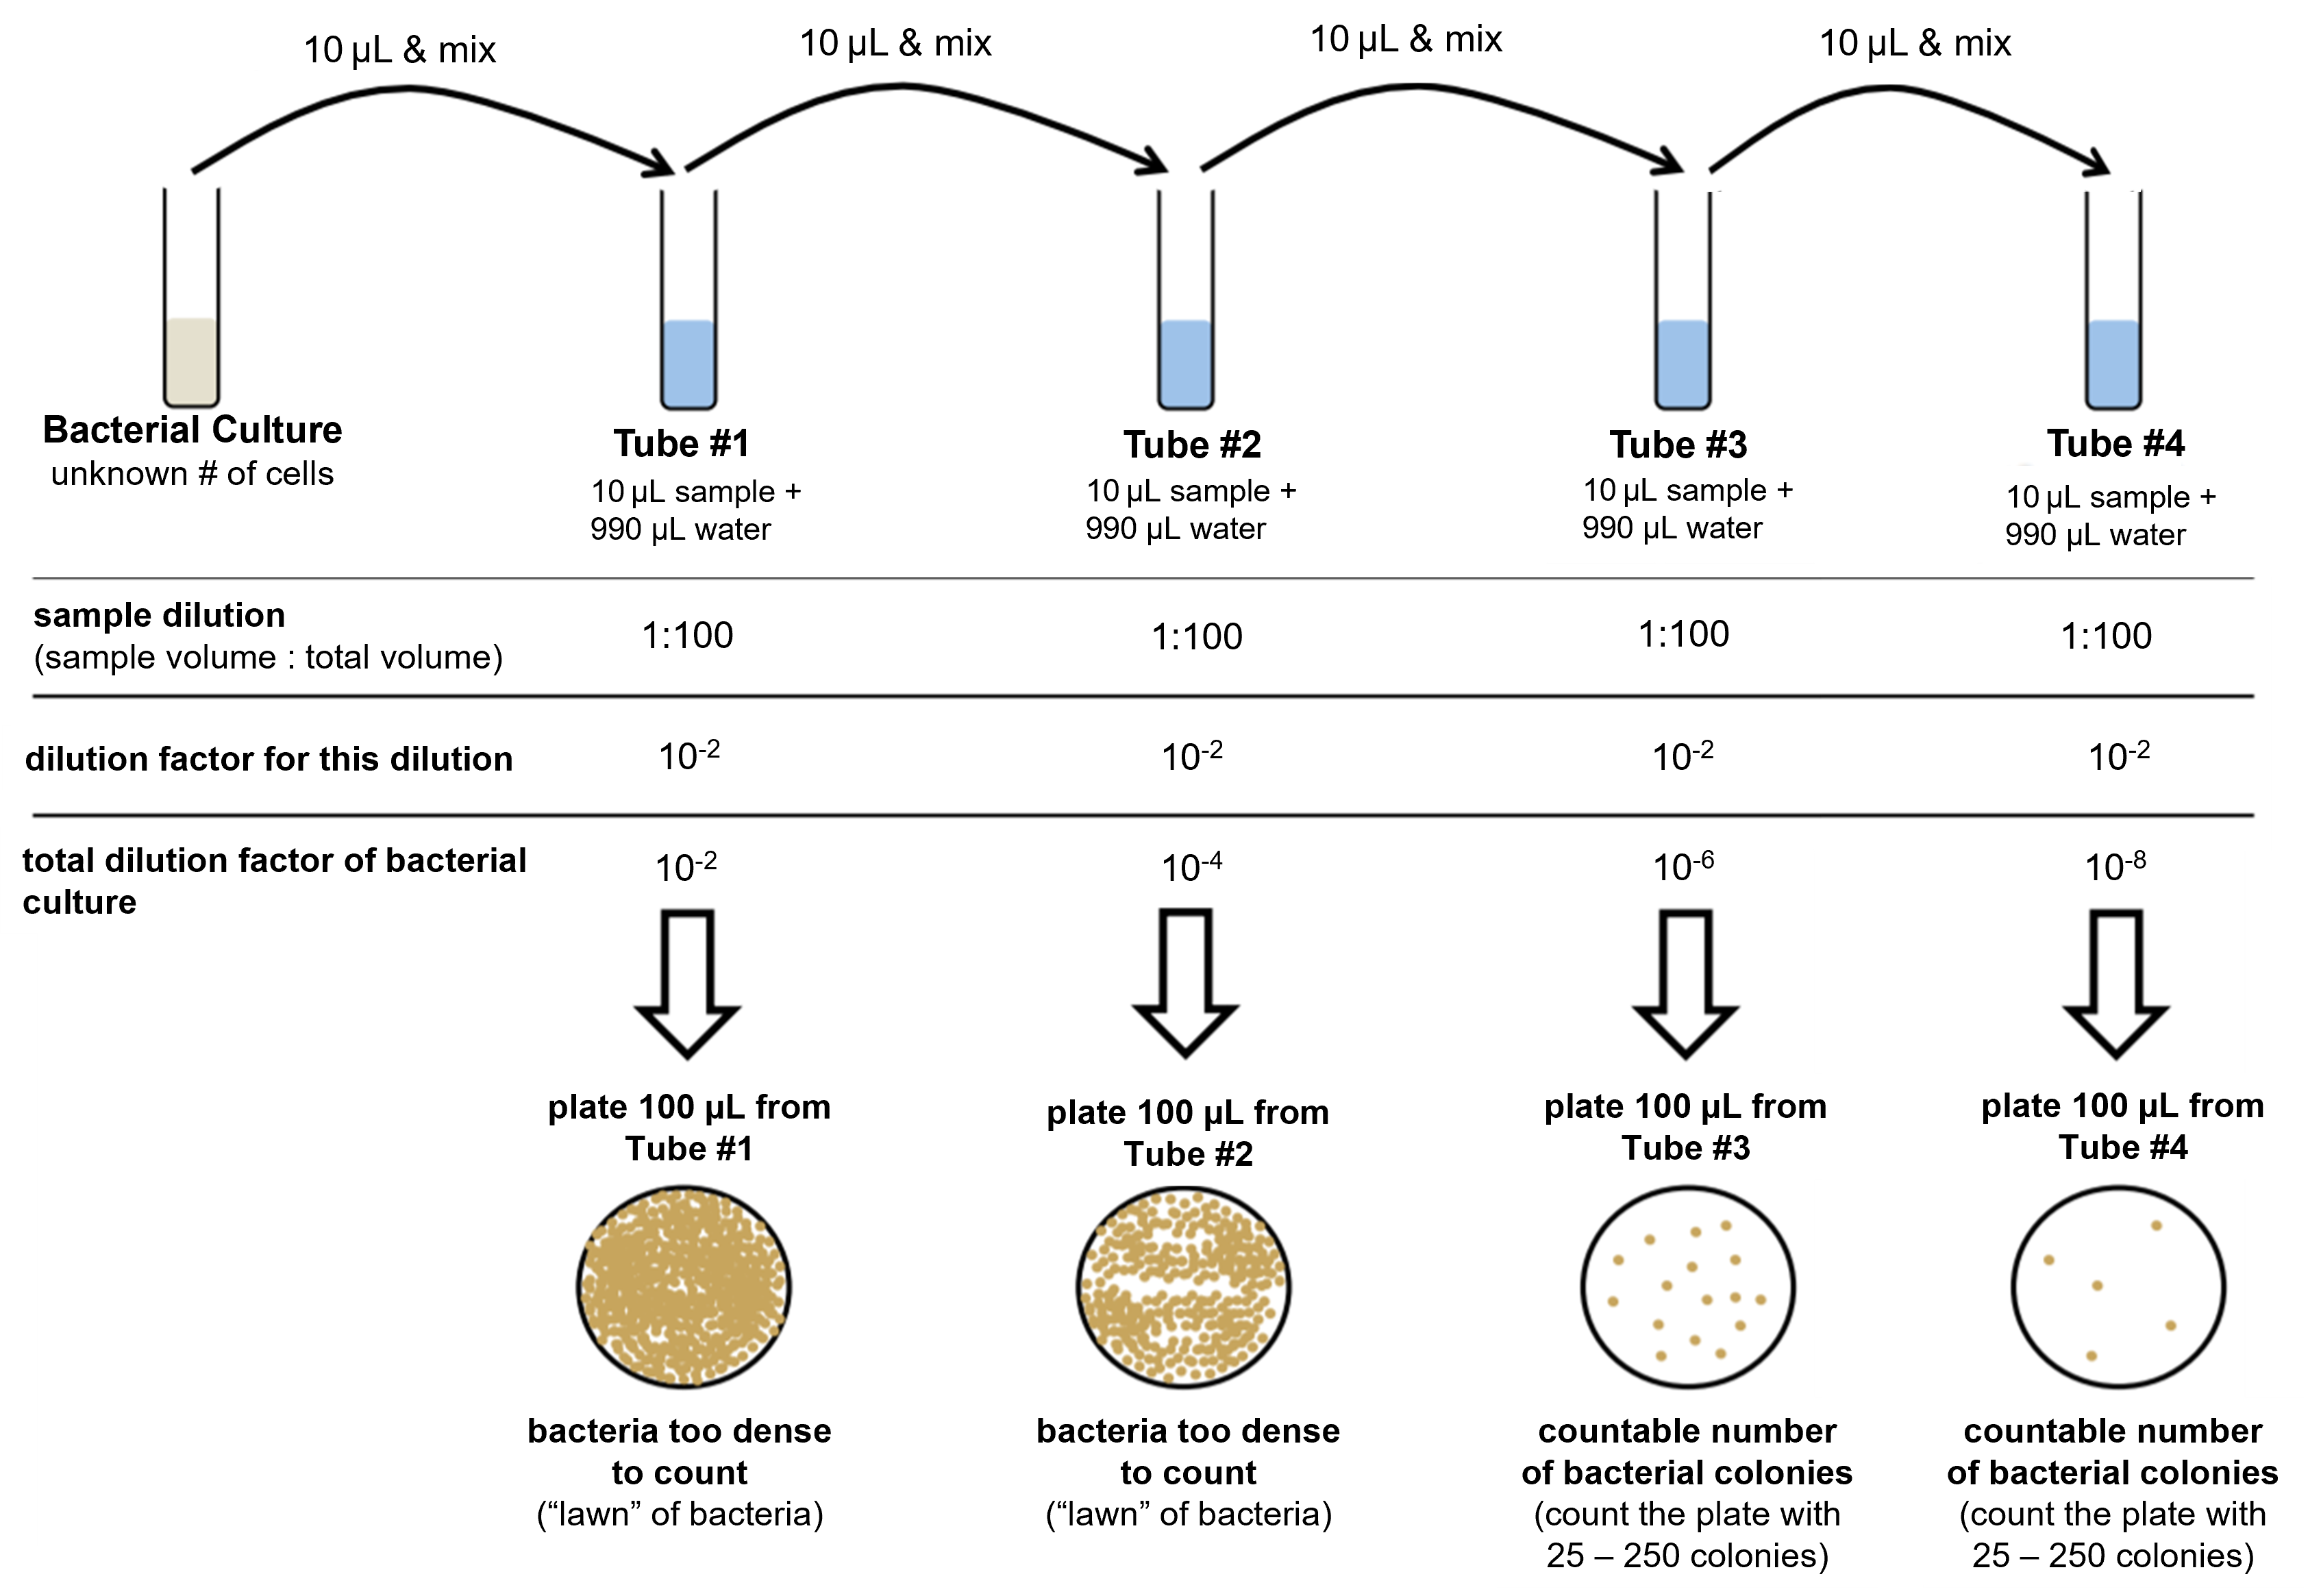
Figure 3: (Top) The process of diluting a bacterial culture in a dilution series is shown. In this process, 10 μL of the culture is diluted in 990 μL of water and mixed. This is a 1:100 dilution, or 10-2 dilution. A sample from this first dilution is plated onto a petri plate. The first dilution is further diluted and plated three more times in a similar manner. From the 1:100 dilution, 10 μL is removed and put into another 990 μL of water and mixed. This process is repeated to produce a total of four dilutions and four petri plates. After incubation of the petri plates, at least one plate should have countable colonies (between 25 and 250 colonies). From the counted colonies, the CFU can be calculated.
Step 1: Determine the concentration of cells in the diluted sample:
(# of colonies counted on the petri plate) ÷ (amount of diluted sample added to the petri plate in mL) = CFU in diluted sample (cells/mL)
Note: 100 μL = 0.1 mL; 200 μL = 0.2 mL
Step 2: Determine the concentration of cells in the original sample:
(CFU in diluted sample) ÷ (dilution of the petri plate counted) = CFU in original sample (cells/mL)
You conduct a standard plate count where 200 μL of each dilution is added to each petri plate. The petri plates diluted to 10-2 and 10-4 are lawns and cannot be counted. The 10-6 diluted petri plate results in 129 colonies. The 10-8 diluted petri plate has 12 colonies on it (so it is not used for the CFU calculation since it is not within 25-250 colonies). Calculate the CFU in cells/mL of the original sample based on these results.
Solution
- # of colonies counted = 129
- amount of diluted sample added to the petri plate in mL = 200 μL = 0.2 mL
- dilution of the petri plate counted = 10-6
Step 1: Determine the concentration of cells in the diluted sample:
(# of colonies counted on the petri plate) ÷ (amount of diluted sample added to the petri plate in mL) = CFU in diluted sample (cells/mL)
(129 colonies) ÷ (0.2 mL diluted sample added to petri plate) = 645 cells/mL in the diluted sample
Step 2: Determine the concentration of cells in the original sample:
(CFU in diluted sample) ÷ (dilution of the petri plate counted) = CFU in original sample (cells/mL)
(645 cells/mL in diluted sample) ÷ (10-6 dilution of the petri plate counted) = 645,000,000 cells/mL in original sample
CFU = 645,000,000 cells/mL in original sample
You conduct a standard plate count where 100 μL of each dilution is added to each petri plate. The petri plates diluted to 10-2 and 10-4 and 10-6 are lawns and cannot be counted. The 10-8 diluted petri plate results in 211 colonies. Calculate the CFU in cells/mL of the original sample based on these results.
You conduct a standard plate count where 50 μL of each dilution is added to each petri plate. The petri plates diluted to 10-2 is a lawn and cannot be counted. The 10-4 diluted petri plate results in 162 colonies. The 10-6 and 10-8 diluted petri plates both had less than 25 colonies on it (so it is not used for the CFU calculation since it is not within 25-250 colonies). Calculate the CFU in cells/mL of the original sample based on these results.
You conduct a standard plate count where 250 μL of each dilution is added to each petri plate. The petri plates diluted to 10-2 and 10-4 are lawns and cannot be counted. The 10-6 diluted petri plate results in 89 colonies. The 10-8 diluted petri plate has 3 colonies on it (so it is not used for the CFU calculation since it is not within 25-250 colonies). Calculate the CFU in cells/mL of the original sample based on these results.
Absorbance Readings
Cells can absorb, transmit, and/or reflect light. Spectrophotometry is a technique where the amount of light a substance absorbs, or the amount of light that transmits through the sample, is measured.
A spectrophotometer is an instrument that measures the amount of photons (the intensity of light) absorbed after it passes through sample solution.
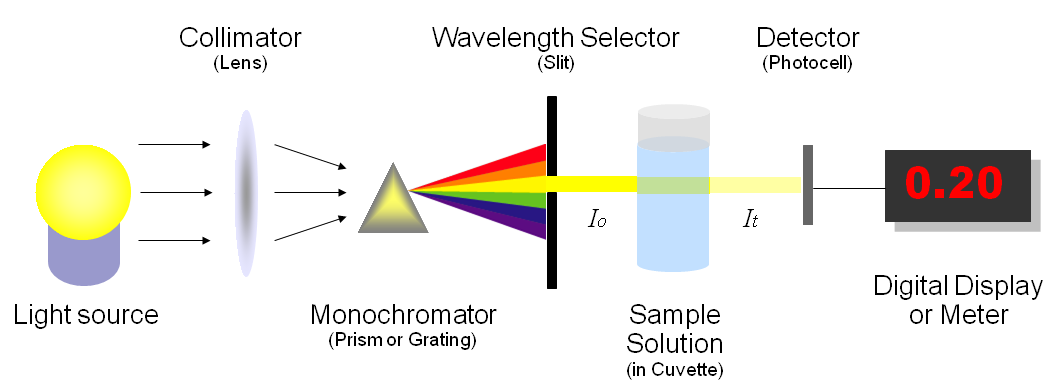
Figure 4: The diagram shows the components of a spectrophotometer. (Left) Light is emitted from a light source. (Second from the left) The wavelength of light is narrowed to a specific wavelength of light (accomplished by the monochromator) that is selected by the person using the spectrophotometer. (Second from the right) The light is passed through a sample in a container called a cuvette. The amount of light that reaches the other side of the sample is measured by a detector. (Right) The spectrophotometer displays the absorbance of light that occurred by the sample. The higher the absorbance, the more light did not pass through the sample. Therefore, the more cells in a sample, the higher the absorbance reading and the less light passing through the sample. A spectrophotometer can also be set to measure transmittance, which is the opposite of absorbance. Transmittance tells the person using a spectrophotometer how might light did pass through the sample. Therefore, a sample with a lot of cells would have a lower transmittance reading than a sample with fewer cells.
Spectrophotometric (turbidimetric) analysis can be used to determine the quantity of cells in a sample based on the amount of light that is absorbed by the sample. It measures how turbid (cloudy) the solution is. When photons of light hit a cell, the light is absorbed, reflected, or diverted in a different direction. Therefore, the amount of light passing through a sample can be used to measure cell density in a sample.
Although using spectrophotometry to measure cell density in a sample can be quite effective, it will yield results that can be different from plate counts. For example, the standard plate count method is an indirect measurement of cell density and reveals information related only to live bacteria. The spectrophotometric analysis is based on turbidity and indirectly measures all bacteria (cell biomass), dead and alive.
Increased turbidity in a culture is another index of bacterial growth and cell numbers (biomass). By using a spectrophotometer, the amount of transmitted light decreases as the cell population increases. The transmitted light is converted to electrical energy, and this is indicated on a galvanometer. The reading, called absorbance or optical density, indirectly reflects the number of bacteria. This method is faster than the standard plate count but is limited because sensitivity is restricted to bacterial suspensions of 107 cells/mL or greater. Samples can be diluted to obtain accurate results when samples contain more than 107 cells/mL or more.
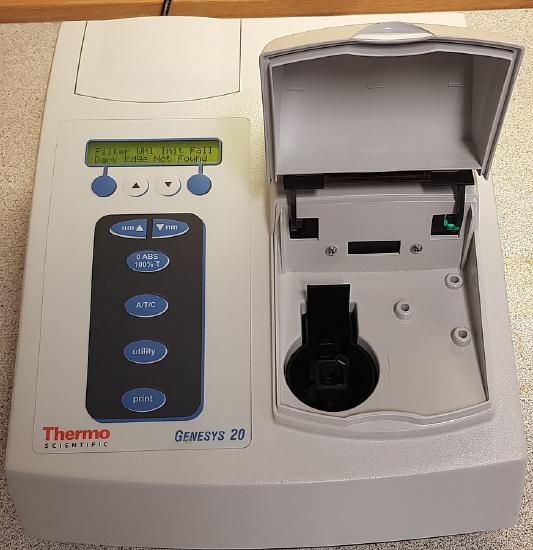
Figure 5: This image shows one type of spectrophotometer. The dark circle toward the right is where a sample is placed inside of the spectrophotometer. The lid is closed to allow light to pass through the sample and collect an absorbance or transmittance reading. The person using the spectrophotometer can select settings using the buttons on the left.
Putting it Together: Using Absorbance as a Quick Way to Determine Cell Concentrations
The CFU concentration determined in the standard plate count can be correlated with absorbance readings. This is done by setting up a graph with absorbance readings of different dilutions on one axis and cell concentrations of that culture at those dilutions on the other axis. Then the CFU is calculated different dilutions and correlated with the corresponding absorbance readings at those same dilutions. These data points are plotted on a graph and a line is drawn the best fits these data. This line, called a trend line or standard line, can be used to determine the cell concentrations of samples with unknown cell concentrations using absorbance only. This enables a microbiologist to quickly determine cell concentrations within a couple minutes rather than taking the time and materials to conduct plate counts for every sample.
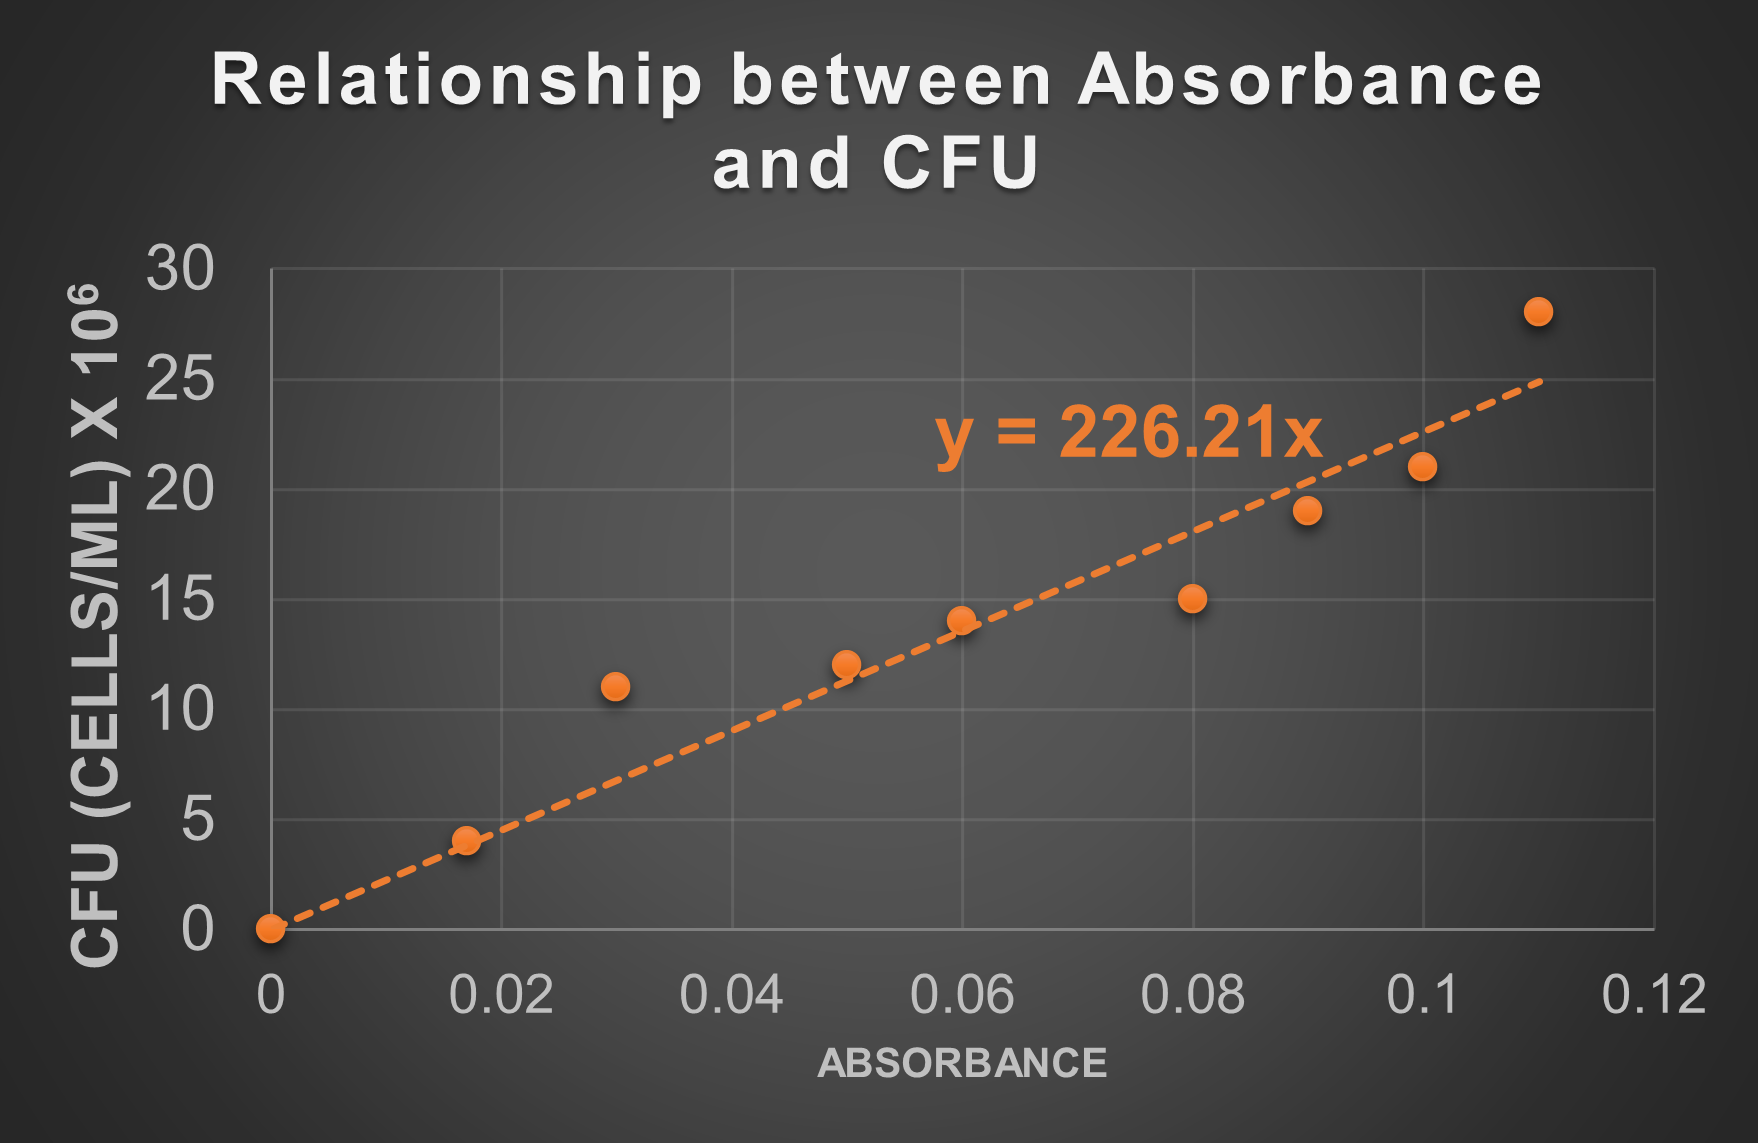
Figure 6: Absorbance data for a sample that has undergone serial dilutions is plotted against the CFU (based on standard plate count data) calculated at those dilutions. The result is a series of data points that can be used to plot a trend line. That trend line may be used to determine the CFU of samples without completing the standard plate count.
You have a liquid sample containing the same species of bacteria used to make the standard line in the graph above. You want to find out the cell concentration of the sample in CFU without conducting a standard plate count because you need an answer right away (and not in 24-48 hours). You read the absorbance of the sample in the spectrophotometer. The absorbance reading is 0.1. Use the standard line above to determine the CFU.
Answer
The CFU at 0.1 absorbance is approximately 22.5 x 10⁶ cells/mL or 2.3 x 10⁷ cells/mL
Solution
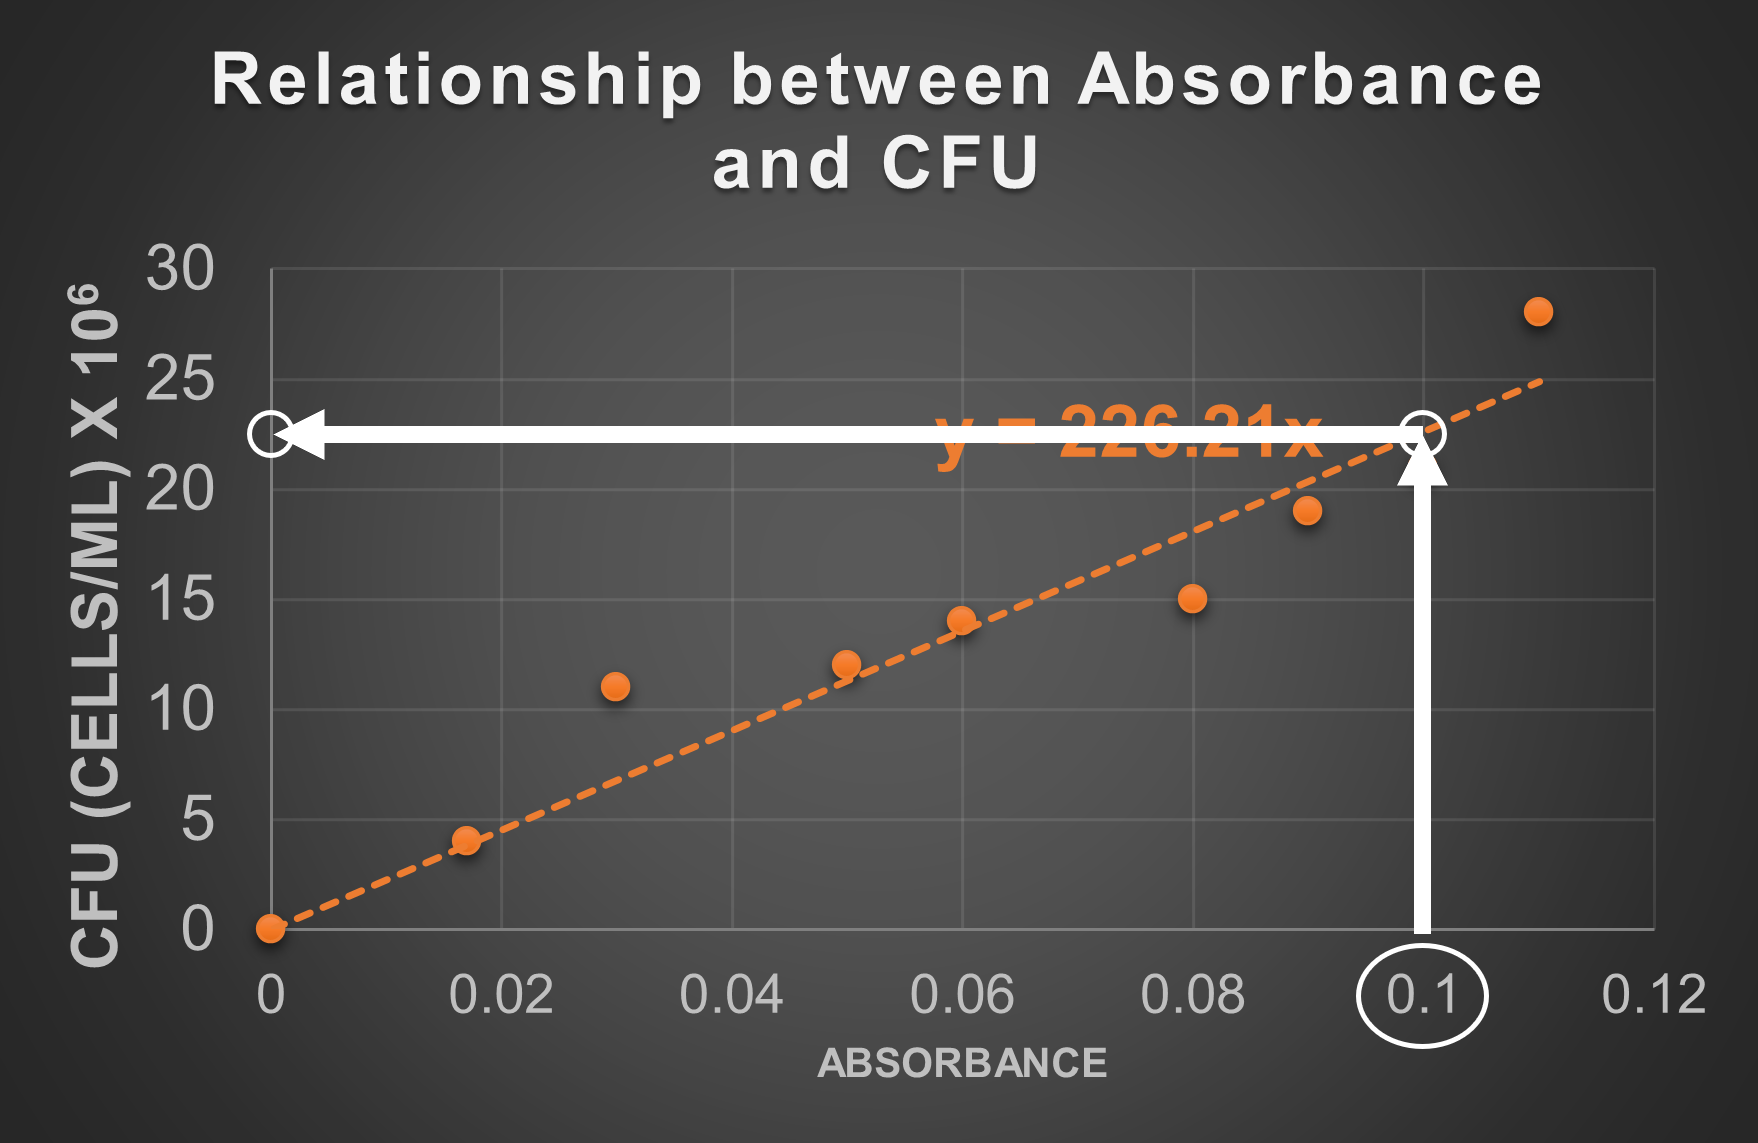
- Find the number corresponding to the absorbance on the graph's axis (in this case 0.1 on the x-axis).
- On the graph, draw a straight line along the absorbance reading on the axis until it reaches the standard line. In this case, draw straight up from 0.1 until it hits the dotted standard line.
- On the graph, draw a straight line from the point identified in step 2. to the other axis (in this case away toward the y-axis).
- Where you intersect the other axis, determine the value of this point on the graph. This will be the approximate CFU at this absorbance. At 0.1 absorbance, the standard line is about half way between 25 and 20 (22.5 is halfway between 25 and 20), but the unit given on the graph indicates these numbers should be multiplied by 106. This is how 22.5 x 10⁶ cells/mL was determined as the CFU at this absorbance. We may adjust how we present the number to 2.3 x 10⁷ cells/mL.
You have a liquid sample containing the same species of bacteria used to make the standard line in Figure 6. The absorbance reading of the sample is 0.04. Determine the cell concentration of the sample in CFU without conducting a standard plate count.
An alternate way, and more accurate way, to determine the CFU from a standard line is to use the equation for the standard line. The equation for the standard line on the graph above is y = 226.21x. The way this graph is set up is with CFU on the y-axis, so the y in this equation is equal to CFU. The way this graph is set up is with absorbance on the x-acis, so the x in this equation is equal to absorbance. If we have an absorbance value, we just plug that number into the location where the x is and calculate what y is. y will be the CFU (but in this case because of the label on the y-axis, the answer will be x 106)
The absorbance of a sample is measured at 0.2. Use the equation from the standard line created from data in Figure 6.
Solution
- Equation for standard line: y = 226.21x
- The absorbance (which is x): 0.2
- Set up the equation: y = (226.21) x (0.2)
- Calculate y: 45.242
- Recall that the graph axis indicates y is x 106, so the final answer is: 45.242 x 10⁶ cells/mL or 4.5 x 10⁷ cells/mL
The absorbance of a sample is measured at 0.31. Use the equation from the standard line created from data in Figure 6.
The absorbance of a sample is measured at 0.18. Use the equation from the standard line created from data in Figure 6.
Laboratory Instructions
Plate Counts of a Bacterial Culture for Determination of Bacterial Numbers
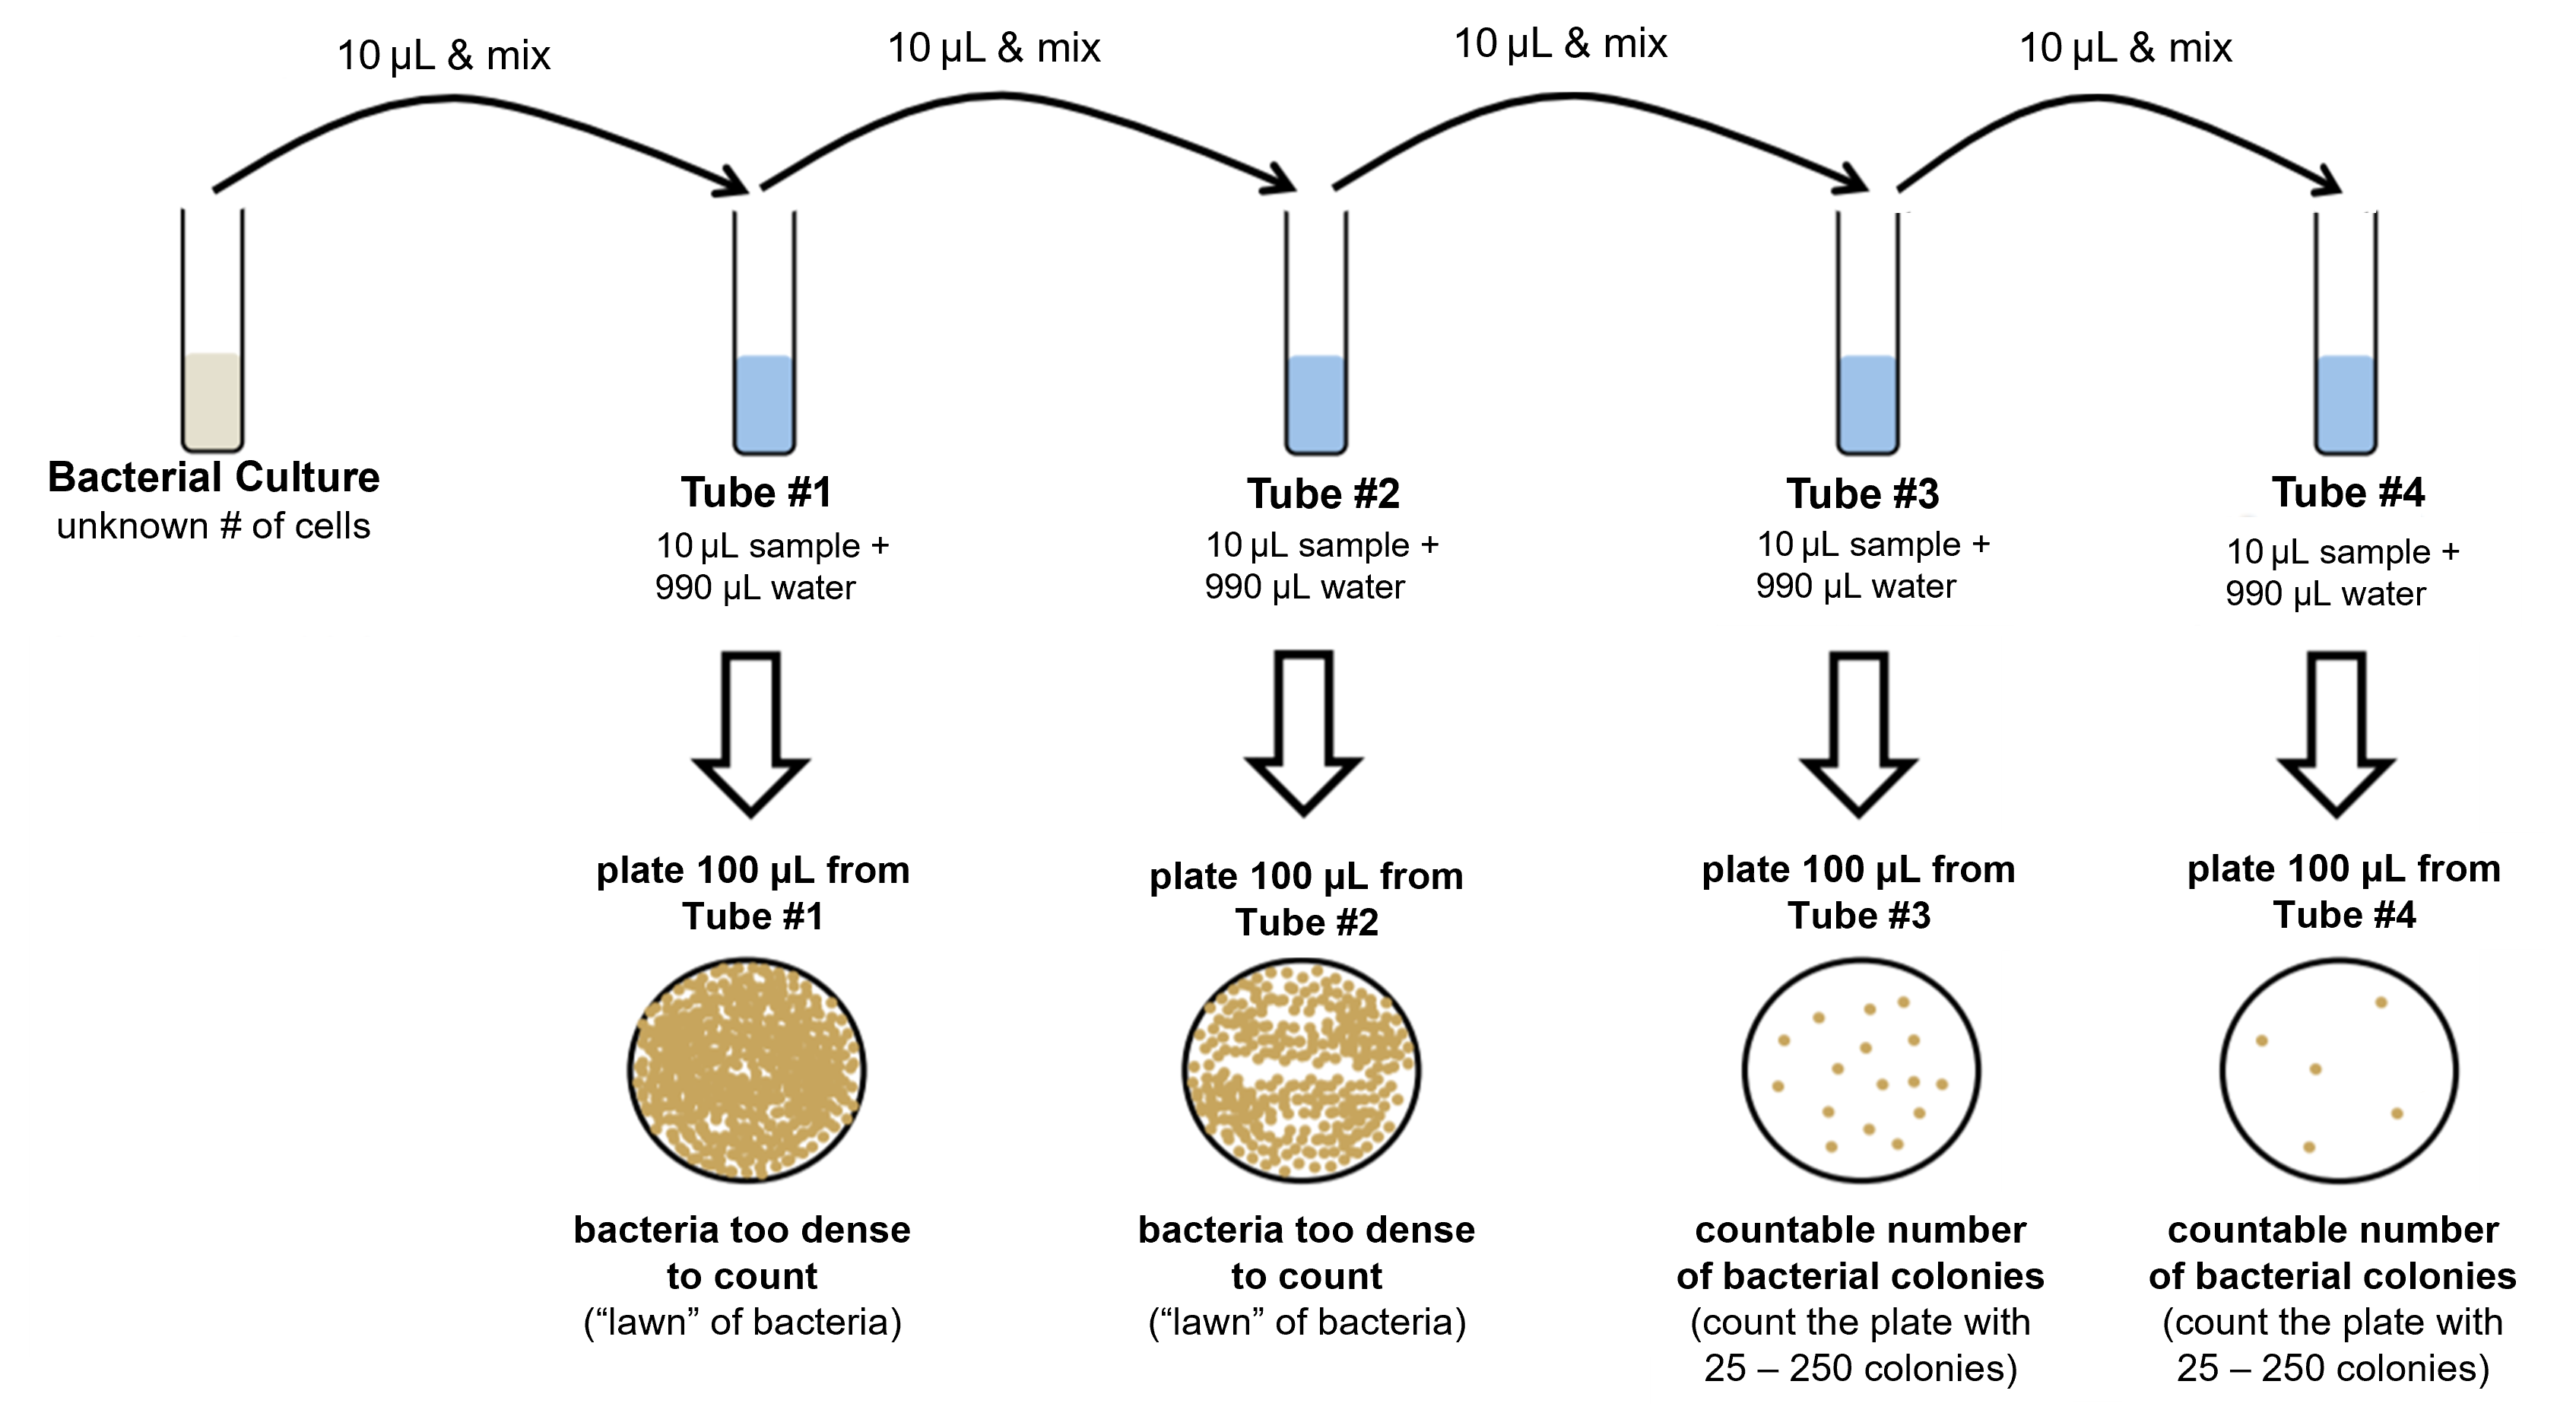
Figure 7: Summary of the serial dilution/dilution series process (top row) and how those dilutions are used to produce multiple petri plates for the standard plate count (center and bottom rows).
Dilution Series
- Obtain 4 microcentrifuge tubes and label them #1-4.
- Aseptically add 990 μL of sterile water to the tubes labeled #1-4.
- Mix the broth culture, then aseptically add 10 μL of the culture to tube #1 and vortex.
- Change the pipette tip. Aseptically transfer 10 μL from tube #1 to tube #2, close the lid and vortex.
- Change the pipette tip. Aseptically transfer 10 μL from tube #2 to tube #3, close the lid and vortex.
- Change the pipette tip. Aseptically transfer 10 μL from tube #3 to tube #4, close the lid and vortex.
Plate Culture Dilutions
- Obtain 4 TSA plates and label them with the dilution of the sample you will add to the plate (10-2, 10-4, 10-6, and 10-8) as well as your group name/number.
- Add 100 μL from tube #1 onto the center of the petri plate labeled 10-2.
- Change the pipette tip. Add 100 μL from tube #2 onto onto the center of the petri plate labeled 10-4.
- Change the pipette tip. Add 100 μL from tube #3 onto the center of the petri plate labeled 10-6.
- Change the pipette tip. Add 100 μL from tube #4 onto the center of the petri plate labeled 10-8.
- Put a small amount of ethanol in one half of an empty petri plate (not one of the ones you labeled).
- Dip the spreader tool in the ethanol.
- Wave the spreader through the flame of a Bunsen burner. You should see the ethanol burning off the spreader.
- Pause a moment to allow the spreader tool to cool down.
- Partially open the petri plate labeled 10-2 and touch the spreader to the agar in a location away from the 100 μL you added to the plate. This will help to cool the spreader and avoid frying the bacteria with the hot spreader.
- Once cooled, use the spreader to evenly spread the 100 μL you added to the plate all over the surface of the plate. Allow the spreader to gently skid along the surface of the medium. Rotate the petri plate to make it easier to spread the liquid evenly over the surface.
- Close the petri plate and set aside to dry.
- Repeat steps 7-12 for each of the petri plates.
- Put the spreader back in the ethanol to kill any bacteria on it.
- Allow the petri plates to dry for 5-10 minutes.
- Invert the petri plates and incubate at 37°C for 24 hours.
- Count the colonies where appropriate (only between 25 and 250) and record results in the table below.
- Calculate CFU for the original culture using the colony count that falls between 25 and 250.
Absorbance of a Bacterial Culture for Determination of Bacterial Numbers
Dilution Series
- Place the original (non-diluted) culture in a test tube rack with four test tubes containing 5 mL of sterile TSB. Label the four test tubes of sterile media as "1/2," "1/4," "1/8," and "1/16."
- Transfer 5 mL of the original (non-diluted culture), to the tube labeled 1/2. Thoroughly mix.
- Transfer 5 mL from the 1/2 tube to the tube labeled 1/4. Thoroughly mix.
- Transfer 5 mL from the 1/4 tube to the tube labeled 1/8. Thoroughly mix.
- Transfer 5 mL from the 1/8 tube to the tube labeled 1/16. Thoroughly mix.
- Record your values, along with the dilutions that they came from. Using the plate count data, calculate the colony-forming units per milliliter for each dilution.
Measure Absorbance of Diluted Samples
- Set the spectrophotometer wavelength at 600 nm.
- Transfer sterile TSB to a cuvette and place in the spectrophotometer and close the lid.
- Zero the spectrophotometer.
- Add 2 mL of the original (non-diluted) culture in a cuvette. Record the absorbance.
- Add 2 mL of the 1/2 dilution to a cuvette. Record the absorbance.
- Add 2 mL of the 1/4 dilution to a cuvette. Record the absorbance.
- Add 2 mL of the 1/8 dilution to a cuvette. Record the absorbance.
- Add 2 mL of the 1/16 dilution to a cuvette. Record the absorbance.
Results & Questions
Plate Counts of a Bacterial Culture for Determination of Bacterial Numbers
| Dilution Plated | Amount of the Dilution Plated | Number of Colonies |
|---|---|---|
| 10-2 | 100 μL | |
| 10-4 | 100 μL | |
| 10-6 | 100 μL | |
| 10-8 | 100 μL |
- Examine the petri plates. Count colonies where you can. If there are more than 250 colonies then simply write "250+." If you cannot distinguish individual colonies write "lawn." If there are less than 25 colonies then simply write "-25." Only plates with 25-250 colonies are used for determining bacterial numbers.
- Calculate the original CFU in cells/mL in the original culture (before dilution).
- A plate has 72 colonies with a total dilution factor of 10-7. 100 μL was pipetted onto the plate. What was the CFU concentration the original sample?
Absorbance of a Bacterial Culture for Determination of Bacterial Numbers
| Culture Dilution | Absorbance (600 nm) |
|---|---|
| 1 (undiluted) | |
| 1/2 | |
| 1/4 | |
| 1/8 | |
| 1/16 |
- Record the absorbance readings in the table above.
- Examine any trends in the table able. Finish this sentence: As the culture becomes more dilute, the absorbance _____________.
- What is an absorbance reading? What does it measure?
- Briefly explain what a spectrophotometer is and what it does.
- Describe how an absorbance can indicate the density of cells within a culture.
- How is the information about the cells in a culture indicated by an absorbance reading different from the information about the cells in a culture indicated by a plate count?
Creating a Standard Line between Plate Counts and Absorbance
| Culture Dilution | Absorbance (600 nm) | CFU (cells/mL) |
|---|---|---|
| 1 (no dilution) | ||
| 1/2 | ||
| 1/4 | ||
| 1/8 | ||
| 1/16 |
- Complete the table above:
- Transfer data from absorbance readings in the previous section to the "Absorbance (600 nm)" column in the table above.
- Transfer the CFU of the original culture calculated in the plate count section to the "CFU (cells/mL)" column in the dilution row that says "1 (no dilution)."
- Using the original culture CFU, calculate the CFU at a 1/2 dilution and put this value in the "CFU (cells/mL)" column in the dilution row that says 1/2: (CFU) x (1/2)
- Using the original culture CFU, calculate the CFU at a 1/4 dilution and put this value in the "CFU (cells/mL)" column in the dilution row that says 1/4: (CFU) x (1/4)
- Using the original culture CFU, calculate the CFU at a 1/8 dilution and put this value in the "CFU (cells/mL)" column in the dilution row that says 1/8: (CFU) x (1/8)
- Using the original culture CFU, calculate the CFU at a 1/16 dilution and put this value in the "CFU (cells/mL)" column in the dilution row that says 1/4: (CFU) x (1/16)
- Create a graph with absorbance on the x-axis and CFU (cells/mL) on the y-axis. You can number the y-axis indicating that the number on the axis is x 106, x 107, or x 108 as appropriate for your data. You may graph data using Excel or other graphing software or using graph paper. Follow the instruction of your instructor. Plot each data point as a dot on the graph.
-
If you are graphing using graph paper, make sure that when you label the axes that each line or box on the graph has a defined value and that every box on that axis counts as that same value. There examples given below showing how to number axes evenly so that each box has a certain unit and remains consistent for that entire side of the graph. In example 1, the y-axis has each box worth 1 and the x-axis has each box worth 0.02 (and only every five boxes are labeled). In example 2, the y-axis has each box worth 0.4 (and only every five boxes are labeled) and the x-axis has each box worth 0.01.
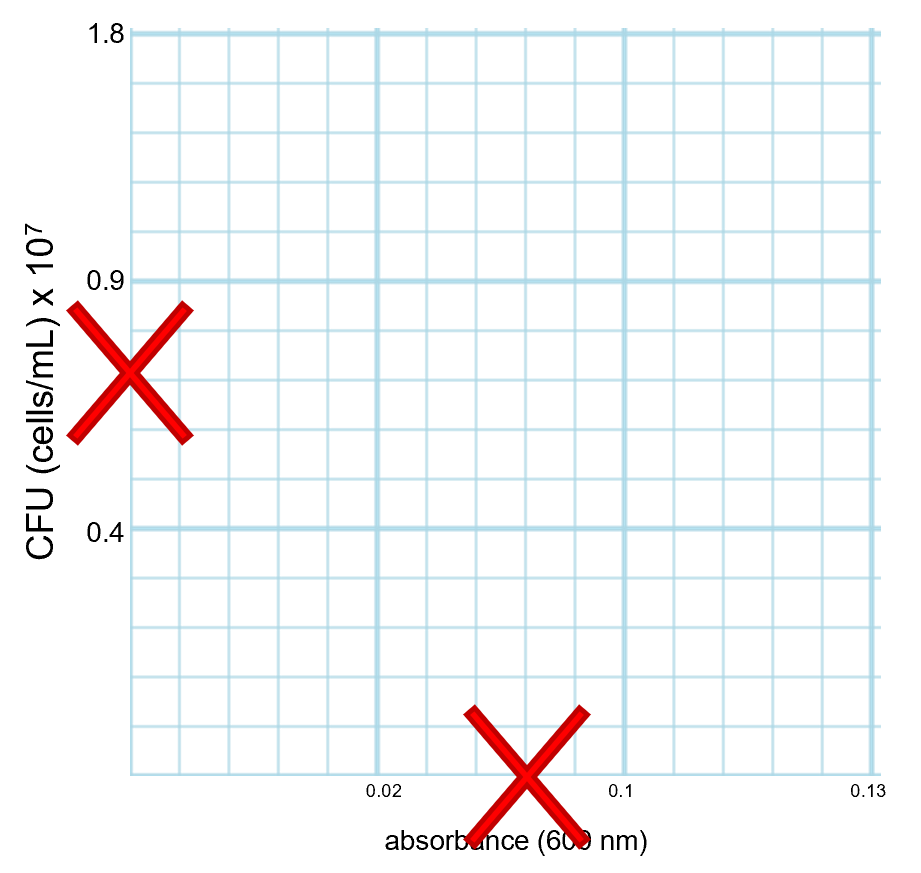
In the "Do not Graph This Way!" column below, an example of what not to do is shown. Notice that the boxes on the axes have been labeled with numbers, but each box does not have a defined unit and the numbering is not consistent. Do not do this.
Graph This Way (Every Box on the Axis has a Defined Value that is Consistent on that Axis) Do not Graph This Way! (Boxes on the Axis Do Not have a Defined Value) Example 1:

Example 2:

Example of what NOT to do:
-
- If you used graphing software add a trend line to your data and set the y-intercept at zero. Also make sure to have the software place the equation for the line on the graph. If you are using graph paper, use a ruler and it place along the data points making sure the ruler passes through the bottom left corner of the graph corresponding with zero on the x-axis and the y-axis. Draw a straight line using the ruler that best matches the data points. Only draw one straight line. This line does not have to touch every data point (and it probably will not). Do not connect each data point with the ruler with multiple lines. There should only be one straight line on the graph (see Figure 6 for an example).
- After creating the standard curve above you continue your research with this same bacterial species, but now instead of doing the plate counts (which took a lot of time and materials) you simply use a spectrophotometer to measure absorbance to determine CFU (cells/mL) using the standard curve. As you continue your research, you measure the bacterial samples using the spectrophotometer. Use the standard curve you created to determine the amount of CFUs in each sample in the table below based on the absorbance. If you used graphing software, determine CFUs using the trend line equation (see example of using trend line equation to determine CFU from absorbance). If you used graph paper, use the position of the trend line as it relates to the absorbance reading to determine CFUs (see example of using position of the trend line to determine CFU from absorbance).
-
Absorbance (600 nm) CFU (cells/mL) 0.15 0.02 0.3 0.25
-
- Explain the purpose of constructing the calibration curve.
- You count colonies on a plate where 100 μL was added of a 10-3 dilution. The colony count is 53. How many cells per milliliter are in your original sample?
- You count colonies on plate where 100 μL was added of a 10-5 final dilution. Your count is 129. How many cells per milliliter are in your original sample?
- You are testing a sample of water from a local swimming pool. An undiluted sample (100) where 100 μL was added to a petri plate produced 38 colonies. The safety standards for swimming pools state that the water cannot contain more than 200 CFU per milliliter. Is the pool you are testing safe to swim in? Why or why not?
- As part of an ongoing recreational waters safety monitoring program, you are testing a sample of water from swimming beaches in Morro Bay, CA. An undiluted sample (100) where 100 μL was added to a petri plate produced 1 Escherichia coli colony. The EPA safety standards for recreational water cannot contain more than 235 E. coli per 100 mL. Is the beach safe to swim in? Why or why not?
- You are testing a sample of milk from a local dairy that has been cited for some recent safety violations. A 10-1 dilution where 100 μL was added to a petri plate produced 201 colonies on it. The FDA safety standard for milk of the type you sampled is 3 x 10⁴ per milliliter (above this threshold and the milk is unsafe). Is this milk sample safe to drink? Why or why not?
Graph Paper

Attribution
- Bubbler.jpg by Sulfur is licensed under CC BY-SA 3.0
- Budds Farm Wastewater Treatment Works 3.jpg by Tim Sheerman-Chase is licensed under CC BY 2.0
- Chapter Image: Serial dilution and plating of bacteria.jpg by Quentin Geissmann is licensed under CC BY-SA 3.0
- General Microbiology Lab Manual (Pakpour & Horgan) by Nazzy Pakpour & Sharon Horgan is licensed under CC BY-SA 4.0
- Grandi fish processing conveyor belt2 2011.jpg by Jabbi is licensed under CC BY-SA 3.0
- Lightblue empty grid.svg by Pieter Kuiper is in the public domain
- Microbiology Labs I by Delmar Larsen and Jackie Reynolds is licensed under an undeclared license
- Sias Swimming Pool.jpg by Gary Todd is in the public domain
- Spectrophotometry by Kevin Vo (UCD) is licensed under an undeclared license.
- Spektrofotometers bild.jpg by Ejaz S is licensed under CC BY-SA 4.0
- Surfer enjoying the waves.jpg by Navymom9194surfer is licensed under CC BY-SA 4.0