
23.5: Phylogenetics and Disease Evolution
- Page ID
- 74235
What is an evolutionary tree?
On a grand scale, the process of speciation leads to an evolutionary pattern that is something like a forking road. A lineage may persist for many generations and then split, with each resulting lineage taking its own path. Some paths end up leading to dead-ends (i.e., extinction); others diverge many more times, leading to new lineages. The result of this process is a tree-like structure that links together all species that have ever lived on planet Earth.
Imagine if we humans could turn around and walk backwards on the branch of our own evolutionary history. We’d soon meet up with routes leading to our now-extinct hominin relatives, and then greet the ancient ancestors of chimpanzees and bonobos as our routes converged. Eventually, we’d be crossing paths with ancient ancestors of birds and dinosaurs, then the ancestors of sharks, starfish, insects, and plants, ultimately, reaching the point where all evolutionary paths converge — the single-celled organisms that are the great-great-great-great-great … great-grandparents of all species that have ever lived on Earth.
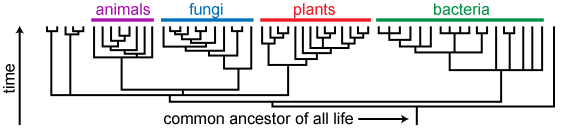
Evolutionary trees, also known as phylogenetic trees, are visual representations of this branching pattern of evolution. A phylogenetic tree may represent the full diversity of life springing from our universal common ancestor (as does the tree above) or a single branch of the full tree of life, such as the vertebrate, fungus, or beetle lineages. Trees may include both extant and extinct organisms. As shown here, there are many ways to depict an evolutionary tree.
The pattern of evolutionary history is mainly branching. However, biologists are discovering more and more cases in which lineages have merged with one another over the course of evolution (e.g., in bacteria, this is common). Such events can still be represented on tree-like structures with cross branches between lineages; however, we will not address this situation here since by far the most common evolutionary trees focus on lineages with a strictly branching pattern of evolution.
How to read trees
To understand how trees represent evolution, imagine the tree shown here beginning as a single lineage and growing outwards in a branching pattern over time (click the button to view the animation). That first lineage represents the oldest lineage on the tree — the lineage that is ancestral to all the other organisms on the tree. The tips of the branches (called taxa) represent the youngest lineages on the tree. These taxa are often species — but not always. Some trees represent the relationships among major groups of organisms, species, populations, individuals, or even genes.
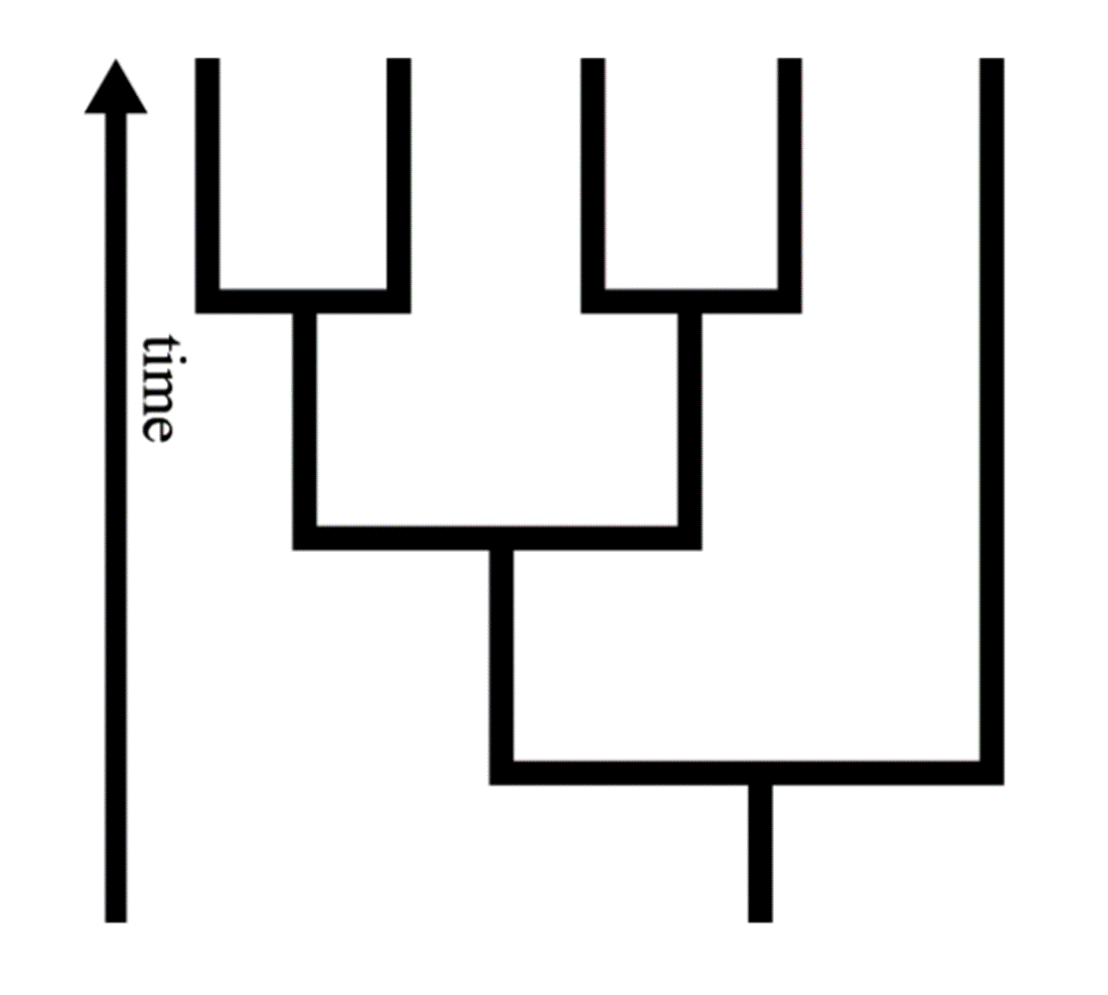
The branches of the tree correspond to ancestor/descendent relationships within a lineage: the part of the branch nearer the base of the tree represents the lineage that is ancestral to the part of the branch nearer the tips. The branching points, or nodes, of the tree represent the splitting of an ancestral lineage into multiple descendent lineages through the process of speciation. If you take any two taxa and trace their branches backwards, the node at which the two paths meet represents the point in evolutionary time when their common ancestor split into two lineages.
Understanding evolutionary relationships
So how do you tell which organisms on a tree are most closely related to one another? It’s tempting to focus on the order of the branch tips on a tree (i.e., which lineage goes to the right and which goes to the left), but in fact, this ordering is not meaningful at all. Instead, the key to understanding evolutionary relationships is common ancestry. Common ancestry refers to the fact that distinct descendent lineages have the same ancestral lineage in common with one another, as shown in the diagram below.
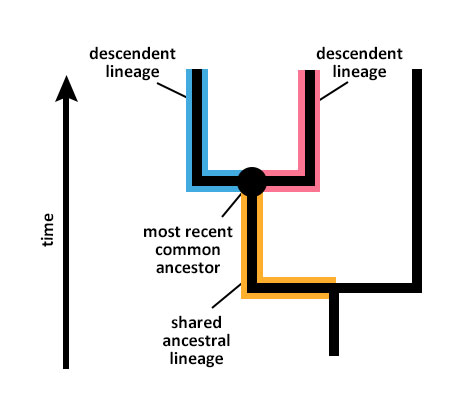
So how do you tell which organisms on a tree are most closely related to one another? It’s tempting to focus on the order of the branch tips on a tree (i.e., which lineage goes to the right and which goes to the left), but in fact, this ordering is not meaningful at all. Instead, the key to understanding evolutionary relationships is common ancestry. Common ancestry refers to the fact that distinct descendent lineages have the same ancestral lineage in common with one another, as shown in the diagram below.
Any set of taxa has a most recent common ancestor — that is, the youngest common ancestor that they all have in common. To find the most recent common ancestor of a set of taxa on a phylogenetic tree, follow each taxon’s lineage back in time (towards the base of the tree) until all the lineages meet up. That node represents their most recent common ancestor. Test your understanding of most recent common ancestors with the tree shown here. Which node represents the most recent common ancestor of the square taxon and the star taxon? Click the button to see the answer.
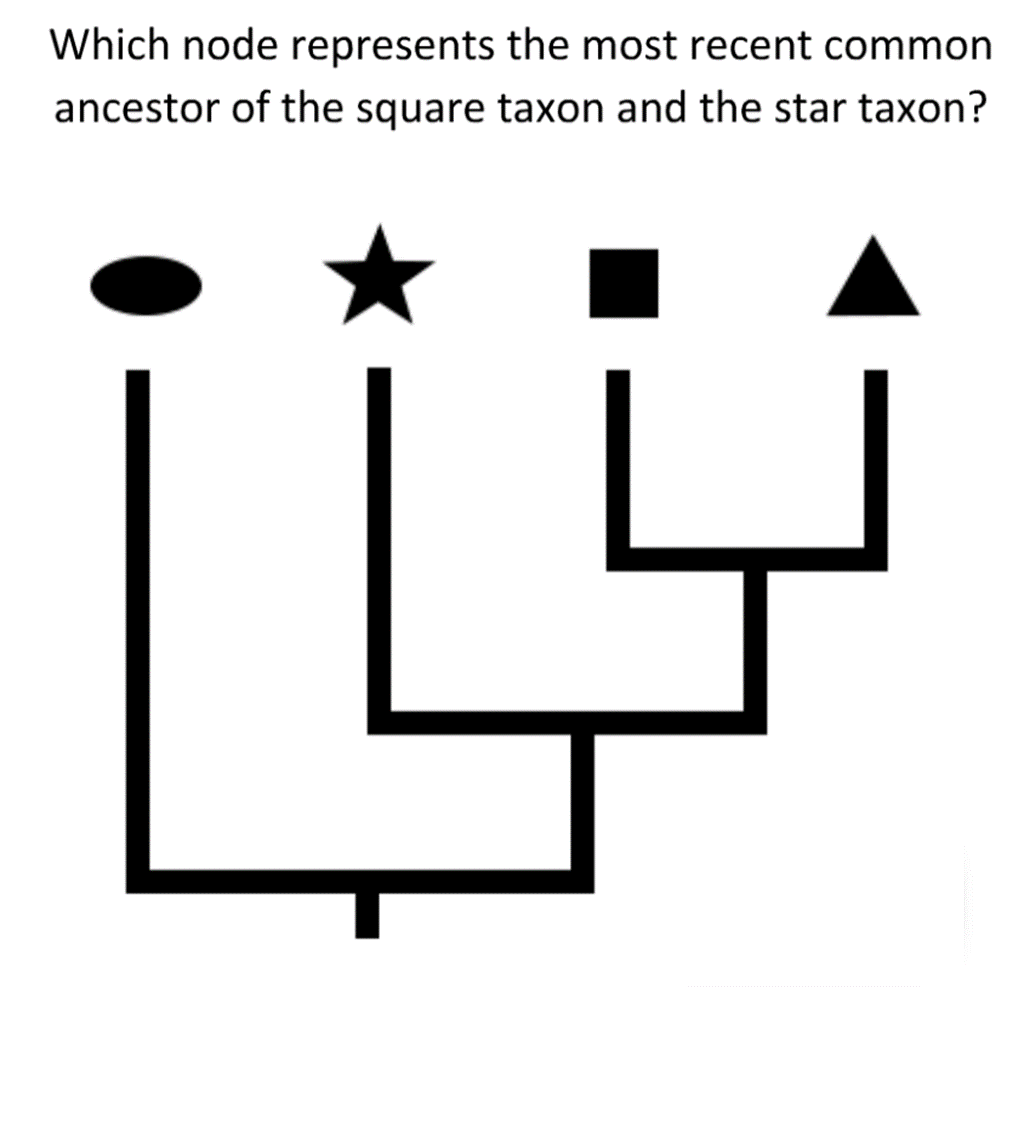
Taxa that share a more recent common ancestor with one another are more closely related than are taxa whose most recent common ancestor is older. As shown in the diagram above, because the triangle taxon shares a more recent common ancestor with the square taxon than either does with the star taxon, we can say that the triangle and square taxa are more closely related to one another than either is to the star taxon.
Disease detectives
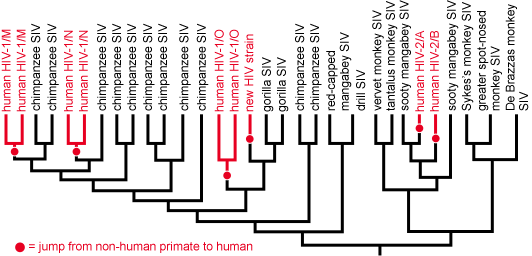
At the most basic level, evolutionary trees tell us which groups of organisms (i.e., clades) are closely related and which are more distant cousins. This can be useful in a couple of ways. First, if a particular organism is unfamiliar, placing it on an evolutionary tree can reveal its origins. This might seem like a no brainer (after all, if the organism is a dog, it must be closely related to other dogs); however, in practice it is often not so simple. Viruses and bacteria often can’t be identified based on their appearances, but can be placed on a phylogenetic tree based on their genetic sequences. For example, the origins of HIV were a mystery to medical researchers until samples of the HIV virus and many others were sequenced and used to construct a phylogenetic tree. The tree made it obvious that HIV evolved from the Simian Immunodeficiency Virus (SIV) and that, on a few different occasions, SIV had jumped from another primate to a human host and, over many generations, was selected for the traits that we now associate with HIV. HIV evolved not just once, but several different times!1 Clearly, when humans come into close contact with our nearest relatives, the risk of passing infectious diseases to one another is relatively high.
Understanding the relationships among groups of organisms has been useful for much more than just identifying the origins of HIV. The same basic approach has helped uncover the roots of SARS (from bats), malaria (from primates), and other diseases. Understanding how infectious diseases got their starts in humans may help us prevent other animal-borne diseases from starting to infect humans. It also allows researchers to study the disease in other contexts — potentially resulting in new treatments. The same approach has been useful in non-medical contexts as well. For example, whale species being illegally sold in Japanese meat markets and alligator being sold as turtle meat in the southern U.S. have all been identified on the basis of phylogenetic trees linking suspect meat samples to known species.2
1. Keele, B.F., F. Van Heuverswyn, Y. Li, E. Bailes, J. Takehisa, M.L. Santiago, … and B.H. Hahn. 2006. Chimpanzee reservoirs of pandemic and nonpandemic HIV-Nature 313:523-526.
2. C.S. Baker, G.M. Lento, F. Cipriano, M.L. Dalebout, and S.R. Palumbi. (2000). Scientific whaling: Source of illegal products for market? Science 290:1695. Baker, C.S., and S.R. Palumbi. 1996. Population structure, molecular