
8.7: Mapping the Genes of T2
- Page ID
- 4858

T2 and its close relative T4 are viruses that infect the bacterium E. coli. The infection ends with destruction (lysis) of the bacterial cell so these viruses are examples of bacteriophages ("bacteria eaters"). Each virus particle (virion) consists of:
- a protein head (~0.1 µm) inside of which is a single, circular molecule of double-stranded DNA containing 166,000 base pairs.
- a protein tail from which extend
- thin protein fibers
Life Cycle
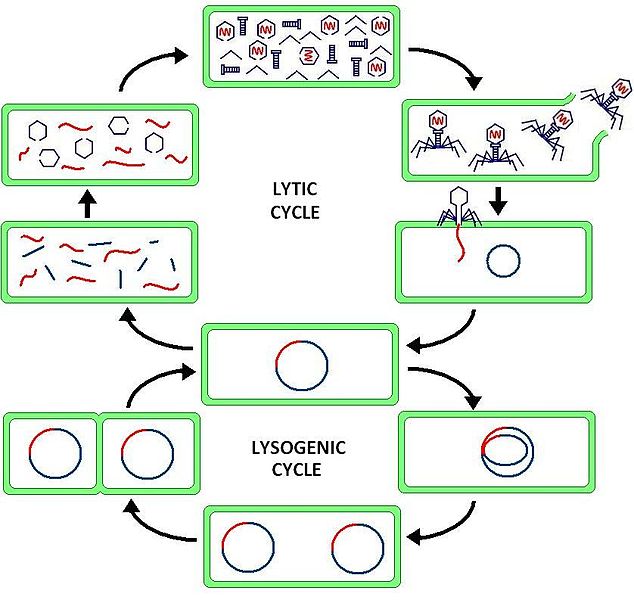
The virus attaches to the E. coli cell (a). This requires a precise molecular interaction between the fibers and the cell wall of the host.
- The DNA molecule is injected into the cell (b).
- Within 1 minute, the viral DNA begins to be transcribed and translated into some of the viral proteins, and synthesis of host proteins is stopped.
- At 5 minutes, viral enzymes needed for synthesis of new viral DNA molecules are produced (c).
- At 8 minutes, some 40 different structural proteins for the viral head and tail are synthesized.
- At 13 minutes, assembly of new viral particles begins (d).
- At 25 minutes, the viral lysozyme destroys the bacterial cell wall and the viruses burst out — ready to infect new hosts (e).
- If the bacterial cells are growing in liquid culture, it turns clear.
- If the bacterial cells are growing in a "lawn" on the surface of an agar plate, then holes, called plaques, appear in the lawn.
Occasionally, new phenotypes appear such as a change in the appearance of the plaques or even a loss in the ability to infect the host.
Examples:
- h
- Some strains of E. coli, e.g. one designated B/2, gain the ability to resist infection by normal ("wild-type") T2. The mutation has caused a change in the structure of their cell wall so that the tail fibers of T2 can no longer bind to it. However, T2 can strike back. Occasional T2 mutants appear that overcome this resistance. The mutated gene, designated h (for "host range"), encodes a change in the tail fibers so they can once again bind to the cell wall of strain B/2. The normal or "wild-type" gene is designated h+ .
- When plated on a lawn containing both E. coli B and E. coli B/2,
- the mutant (h) viruses can lyze both strains of E. coli, producing clear plaques, while
- the wild-type (h+) viruses can only lyze E. coli B producing mottled or turbid plaques.
- r
- Occasional T2 mutants appear that break out of their host cell earlier than normal.
- The mutation occurs in a gene designated r (for "rapid lysis"). It reveals itself by the extra-large plaques that it forms.
- The wild-type gene, producing a normal time of lysis, is designated r+. It forms normal-size plaques.
As with so many organisms, the occurrence of mutations provides the tools to learn about such things as
- the function of the gene
- its location in the DNA molecule (mapping)
Mapping by Recombination Frequencies
As we have seen, E. coli strain B can be infected by both h+ and h strains of T2. In fact, a single bacterial cell can be infected simultaneously by both. Let us infect a liquid culture of E. coli B with two different mutant T2 viruses: h r+ and h+ r. When this is done in liquid culture, and then plated on a mixed lawn of E. coli B and B/2, four different kinds of plaques appear.
| Genotype | Phenotype | Number of Plaques |
|---|---|---|
| hr+ | clear, small | 460 |
| h+r | turbid, large | 460 |
| h+r+ | turbid, small | 40 |
| hr | clear, large | 40 |
| Total = | 1000 |
The most abundant (460 each) are those representing the parental types; that is, the phenotypes are those expected from the two infecting strains. However, small numbers (40 each) of two new phenotypes appear. These can be explained by genetic recombination having occasionally occurred between the DNA of each parental type within the bacterial cell.
Just as in higher organisms, one assumes that the frequency of recombinants is proportional to the distance between the gene loci. In this case, 80 out of 1000 plaques were recombinant, so the distance between the h and r loci is assigned a value of 8 map units or centimorgans (cM). Now coinfect E. coli B with two other strains of T2:
- hm+ and
- h+m
| hm+ | 470 |
| h+m | 470 |
| h+m+ | 30 |
| hm | 30 |
| Total = | 1000 |
Again, 4 kinds of plaques are produced: parental (470 each) and recombinant (30 each).
The smaller number of recombinants indicates that these two gene loci (h and m) are closer together (6 cM) than h and r (8 cM). But the order of the three loci could be either
- m–6–h—8—r
or - h–6–m-2-r
To find out which is the correct order, perform a third mating using
- mr+ and
- m+r
| mr+ | 440 |
| m+r | 440 |
| m+r+ | 60 |
| mr | 60 |
| Total = | 1000 |
This makes it clear that the order is m—h—r, not h—m—r.
But why only 12 cM between the outside loci (m and r) instead of the 14 cM produced by adding the map distances found in the first two matings?
A Three-Point Cross
The answer comes from performing a mating between T2 viruses differing at all three loci:
- hmr
and - h+m+r+
(Note: this time one parent has all mutant; the other all wild-type alleles — don't be confused!)
| Group 1 | hmr | 435 |
| Group 2 | h+m+r+ | 435 |
| Group 3 | h+mr+ | 25 |
| Group 4 | hm+r | 25 |
| Group 5 | hmr+ | 35 |
| Group 6 | h+m+r | 35 |
| Group 7 | hm+r+ | 5 |
| Group 8 | h+mr | 5 |
| Total = | 1000 |
The result: 8 different types of plaques are formed.
- parentals; that is, nonrecombinants in Groups 1 and 2;
- recombinants — all the others
Analyzing these data shows how the two-point cross between m and r understated the true distance between them.
Let's first look at single pairs of recombinants as we did before (thus ignoring the third locus).
- If we look at all the recombinants between h and r but ignore m (as in the first experiment), we find that they are contained in Groups 5, 6, 7, and 8 — giving the total of 80 that we found originally.
- If we look at recombinants between h and m but ignore r (as in the second experiment), we find that they are contained in Groups 3, 4,7, and 8 — giving the same total of 60 that we found before.
- But if we focus only on m and r (as we did in the third experiment), we find that the recombinants are contained in Groups 3, 4, 5, and 6 — giving the same total of 120 as before while the non-recombinants are not only in Groups 1 and 2 but also in Groups 7 and 8. The reason: a double-crossover occurred in these cases, restoring the parental configuration of the m and r alleles.
- Because these double crossovers were hidden in the third experiment, the map distance (12 cM) was understated. To get the true map distance, we add their number to each of the other recombinant groups (Groups 3,4,5, and 6) so 25 + 5 +25 +5 +35 + 5 + 35 + 5 = 140, and the true map distance between m and r is the 14 cM that we found by adding the map distances between h and r (8 cM) and h and m (6 cM).
The three-point cross is also useful because it gives the gene order simply by inspection:
- Find the rarest genotypes (here Groups 7 and 8)
- The gene NOT in the parental configuration (here h) is always the middle one.
Contributors and Attributions
John W. Kimball. This content is distributed under a Creative Commons Attribution 3.0 Unported (CC BY 3.0) license and made possible by funding from The Saylor Foundation.