Biology LibreTexts

10.3: Birth-death models and phylogenetic trees

  • Page ID
    21638
  • \( \newcommand{\vecs}[1]{\overset { \scriptstyle \rightharpoonup} {\mathbf{#1}} } \) \( \newcommand{\vecd}[1]{\overset{-\!-\!\rightharpoonup}{\vphantom{a}\smash {#1}}} \)\(\newcommand{\id}{\mathrm{id}}\) \( \newcommand{\Span}{\mathrm{span}}\) \( \newcommand{\kernel}{\mathrm{null}\,}\) \( \newcommand{\range}{\mathrm{range}\,}\) \( \newcommand{\RealPart}{\mathrm{Re}}\) \( \newcommand{\ImaginaryPart}{\mathrm{Im}}\) \( \newcommand{\Argument}{\mathrm{Arg}}\) \( \newcommand{\norm}[1]{\| #1 \|}\) \( \newcommand{\inner}[2]{\langle #1, #2 \rangle}\) \( \newcommand{\Span}{\mathrm{span}}\) \(\newcommand{\id}{\mathrm{id}}\) \( \newcommand{\Span}{\mathrm{span}}\) \( \newcommand{\kernel}{\mathrm{null}\,}\) \( \newcommand{\range}{\mathrm{range}\,}\) \( \newcommand{\RealPart}{\mathrm{Re}}\) \( \newcommand{\ImaginaryPart}{\mathrm{Im}}\) \( \newcommand{\Argument}{\mathrm{Arg}}\) \( \newcommand{\norm}[1]{\| #1 \|}\) \( \newcommand{\inner}[2]{\langle #1, #2 \rangle}\) \( \newcommand{\Span}{\mathrm{span}}\)\(\newcommand{\AA}{\unicode[.8,0]{x212B}}\)

    The above discussion considered the number of lineages under a birth-death model, but not their phylogenetic relationships. However, just by keeping track of the parent-offspring relationships among lineages, we can consider birth-death models that result in phylogenetic trees (e.g. Figure 10.2D).

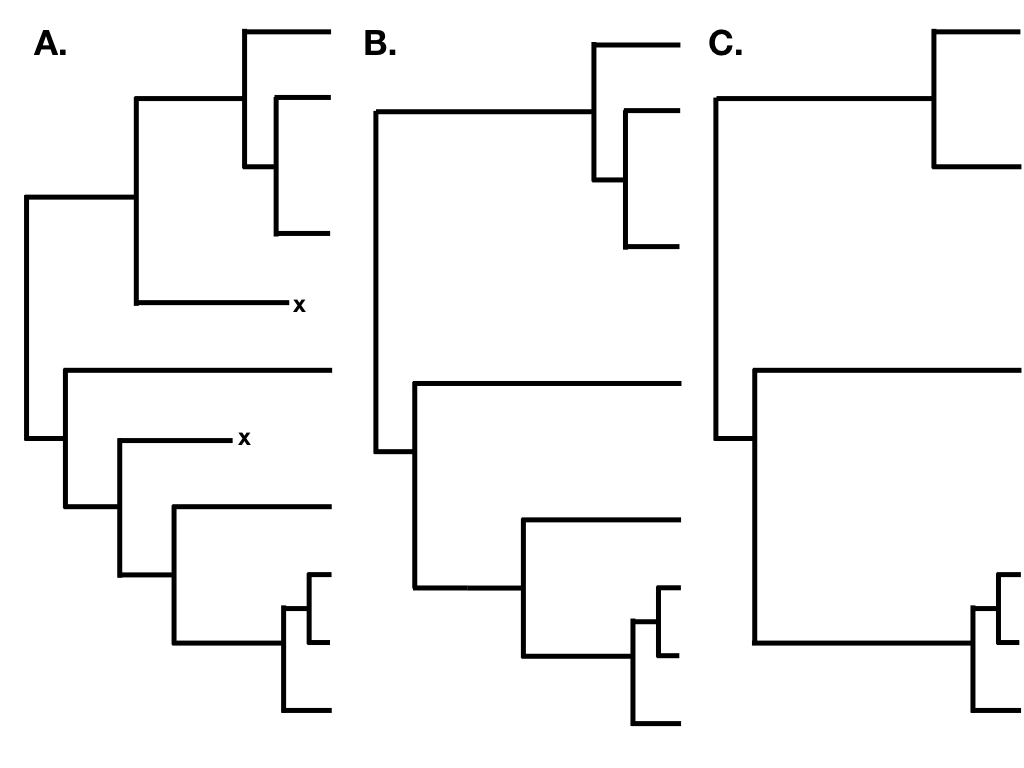
    The main complication in phylogenetic studies of birth-death models is that we get a “censored” view of the process, in that we only observe lineages that survive to the present day. In the above example, if the true phylogenetic tree were the one plotted in 10.5A, we would only have a chance to observe the phylogenetic tree in figure 10.5B – and even then only if we sampled all of the species and reconstructed the tree with perfect accuracy! A partially sampled tree with only extant species can be seen in Figure 10.5C. I will cover the relationship between birth-death models and the branch lengths of phylogenetic trees in much more detail in the next chapter.

    Figure 10.5. A. A birth-death tree including all extinct and extant species; B. A birth-death tree including only extant species; and C. A partially sampled birth-death tree including only some extant species. Image by the author, can be reused under a CC-BY-4.0 license.
    Figure 10.5. A. A birth-death tree including all extinct and extant species; B. A birth-death tree including only extant species; and C. A partially sampled birth-death tree including only some extant species. Image by the author, can be reused under a CC-BY-4.0 license.

    This page titled 10.3: Birth-death models and phylogenetic trees is shared under a CC BY 4.0 license and was authored, remixed, and/or curated by Luke J. Harmon via source content that was edited to the style and standards of the LibreTexts platform; a detailed edit history is available upon request.

    • Was this article helpful?