
21.2: Data Dive- Flooding in Venice Italy
- Page ID
- 46723

\( \newcommand{\vecs}[1]{\overset { \scriptstyle \rightharpoonup} {\mathbf{#1}} } \) \( \newcommand{\vecd}[1]{\overset{-\!-\!\rightharpoonup}{\vphantom{a}\smash {#1}}} \)\(\newcommand{\id}{\mathrm{id}}\) \( \newcommand{\Span}{\mathrm{span}}\) \( \newcommand{\kernel}{\mathrm{null}\,}\) \( \newcommand{\range}{\mathrm{range}\,}\) \( \newcommand{\RealPart}{\mathrm{Re}}\) \( \newcommand{\ImaginaryPart}{\mathrm{Im}}\) \( \newcommand{\Argument}{\mathrm{Arg}}\) \( \newcommand{\norm}[1]{\| #1 \|}\) \( \newcommand{\inner}[2]{\langle #1, #2 \rangle}\) \( \newcommand{\Span}{\mathrm{span}}\) \(\newcommand{\id}{\mathrm{id}}\) \( \newcommand{\Span}{\mathrm{span}}\) \( \newcommand{\kernel}{\mathrm{null}\,}\) \( \newcommand{\range}{\mathrm{range}\,}\) \( \newcommand{\RealPart}{\mathrm{Re}}\) \( \newcommand{\ImaginaryPart}{\mathrm{Im}}\) \( \newcommand{\Argument}{\mathrm{Arg}}\) \( \newcommand{\norm}[1]{\| #1 \|}\) \( \newcommand{\inner}[2]{\langle #1, #2 \rangle}\) \( \newcommand{\Span}{\mathrm{span}}\)\(\newcommand{\AA}{\unicode[.8,0]{x212B}}\)
Overview
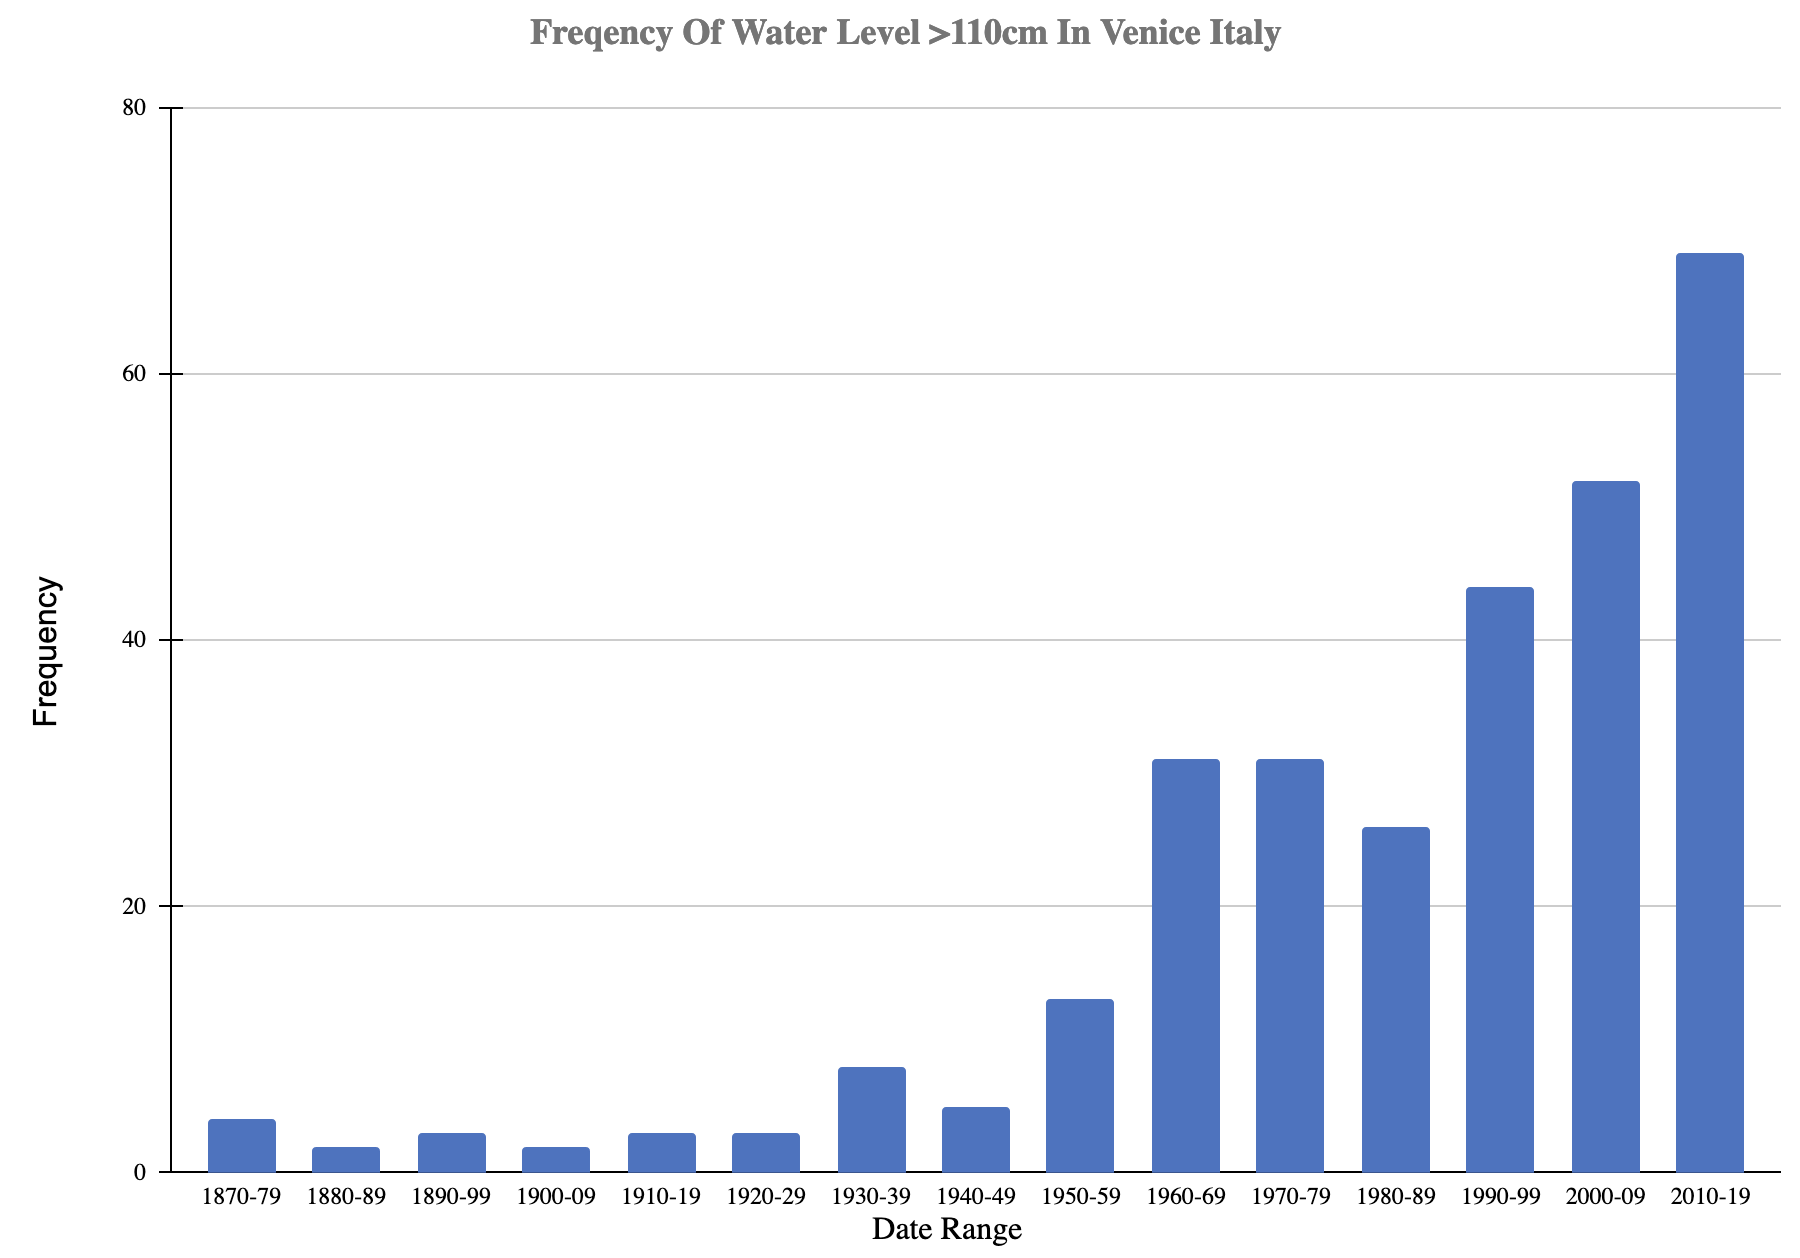
Historically, Venice Italy has a history of flooding that is caused from a multitude of both natural and human caused phenomena. Currently, these issues are being exacerbated by sea level changes as a result of climate change. As such, the City of Venice has been carefully tracking frequency of flooding through the years. The graph below represents the frequency of water level was above 110cm per 10-year period:
Questions
- What is the independent (explanatory) variable and the dependent (response) variable?
- What question(s) are the authors trying to answer with this graph?
- What are the results of this graph illustrating about flooding in Venice?
- How can other coastal cities around the world learn from what patterns are emerging in this graph?
- Provide a brief reflection for how these results make you feel and what they make you think about.
Raw Data For Above Graph(s)
Table \(\PageIndex{a}\): Raw data for the frequency of flooding exceeding 110cm in Venice Italy. Graph by Rachel Schleiger (CC-BY-NC) modified from data published by the City of Venice.
| Ten Year Interval | Frequency |
|---|---|
| 1870-79 | 4 |
| 1880-89 | 2 |
| 1890-99 | 3 |
| 1900-09 | 2 |
| 1910-19 | 3 |
| 1920-29 | 3 |
| 1930-39 | 8 |
| 1940-49 | 5 |
| 1950-59 | 13 |
| 1960-69 | 31 |
| 1970-79 | 31 |
| 1980-89 | 26 |
| 1990-99 | 44 |
| 2000-09 | 52 |
| 2010-19 | 69 |
Attribution
Rachel Schleiger (CC-BY-NC)