
16.3: Fossil Fuel Consumption
- Page ID
- 34141

The U.S. and the world overall heavily depend on fossil fuels. In 2019, fossil fuels contributed to 62.6% of electricity generation in the U.S. with coal contributing 23.4% and natural gas contributing 38.4% (table \(\PageIndex{a}\)). Note that oil (petroleum) is primary used for transportation and thus only contributes a fraction of a percentage to electricity generation. With respect to total energy consumption, the world continues to rely on crude oil more than any other energy source (33.1%) followed by coal (27%) and natural gas (24.3%; figure\(\PageIndex{a}\)).
|
Energy source |
Contribution to Electricity Generation (%) |
|---|---|
| Fossil fuels (total) | 62.6% |
|
Natural gas |
38.4% |
|
Coal |
23.4% |
|
Petroleum (total) |
0.4% |
|
Other gases |
0.3% |
|
Nuclear |
19.6% |
|
Renewables (total) |
17.6% |
|
Hydropower |
7.0% |
|
Wind |
7.1% |
|
Biomass (total) |
1.4% |
|
Solar (total) |
1.7% |
|
Geothermal |
0.4% |
Table modified from U.S. Energy Information Administration (public domain).
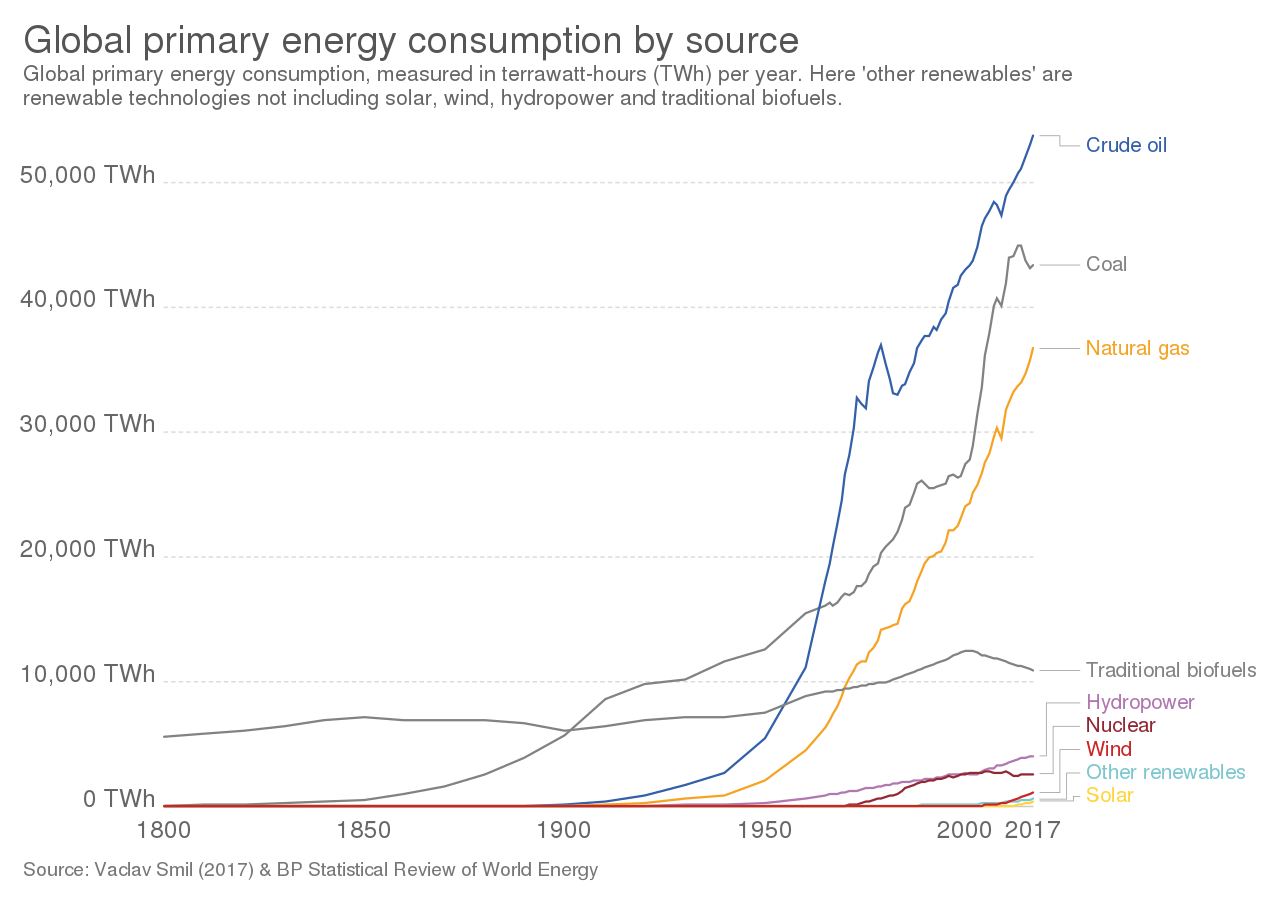
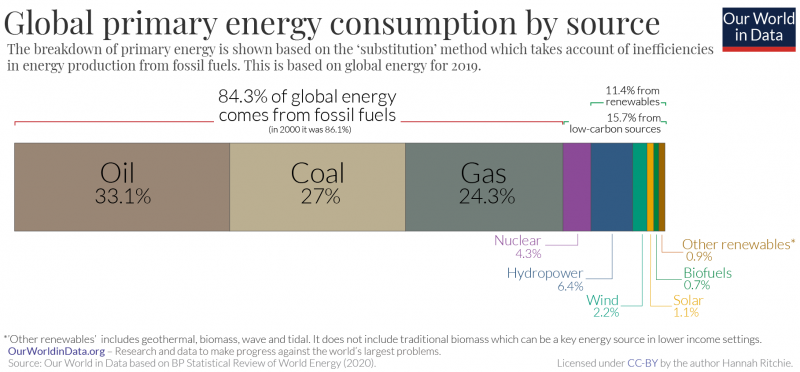
Figure\(\PageIndex{a}\): The top graph shows global energy consumption by source shows energy consumption in terrawatt-hours (TWh) on the y-axis and time in years (1800-2017) on the X-axis. The bottom graph shows the percentage that each energy source contributes to global energy consumption in 2019. Global consumption of most energy sources has increased over time. Consumption of crude oil is the highest (33.1% of global energy consumption in 2019), and it increased rapidly in the 1950s, surpassing coal consumption in the early 1960s. Coal is now the second most-consumed energy source (27%), but its global consumption has declined in recent years. Natural gas is the third most-consumed energy source (24.3%) and has also been increasing. Coal and natural gas consumption surpassed that of traditional biofuels in the early 1900s and 1970, respectively. Nuclear energy consumption has decreased recently, accounting for 4.3% of global energy consumption in 2019. Consumption of renewable energy overall (11.4%) is low compared to fossil fuels (84.3% combined), but it has generally increased in recent years. Images by Our World in Data (CC-BY).
Coal has been used by humans for at least 6000 years, mainly as a fuel source. Coal resources in Wales are often cited as a primary reason for the rise of Britain (and later, the United States) in the Industrial Revolution. Coal electricity traces its origins to the early 20th Century, when it was the natural fuel for steam engines given its abundance, high energy density and low cost. Coal is the largest domestically produced source of energy. At the end of 2018, BP estimated at 734,903 million tonnes, with nearly 23.7% of that in the United States. It is a major fuel resource that the United States controls domestically.
Proven oil reserves (or natural gas reserves) refers to the amount of oil or natural gas that can be extracted economically with current methods (such as conventional wells or fracking). The U.S. Energy Administration estimates that there are enough liquid fuels to last through 2050 (and they include biofuels in this projection). In 2016, BP projected that proven reserves of oil and natural gas can support global demands for another 50 years. Additionally, they estimate that coal reserves can last another 115 years.
Scientists and policy-makers often discuss the question of when the world will reach peak oil production, the point at which oil production is at its greatest and then declines. It was initially predicted that global peak oil would be reached in 2000, but oil production and consumption continue to rise. The United States, however, already passed peak oil production in 1970.
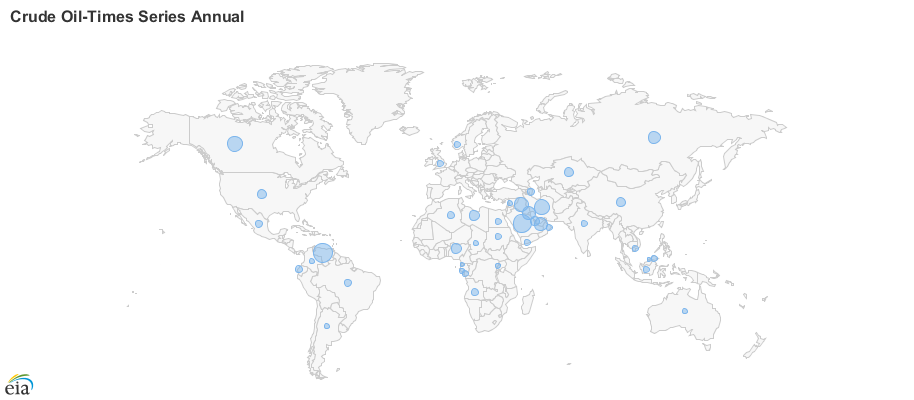
The concentration of oil reserves in a few regions of the world makes much of the world dependent on imported energy for transportation (figure\(\PageIndex{b}\)). The rise in the price of oil in the last decade makes dependence on imported energy for transportation an economic as well as an energy issue. The United States spent $304.9 billion on oil imports in 2019. The United States has become more and more dependent on foreign oil since 1970 when our own oil production peaked.
The major holder of oil reserves is the Organization of Petroleum Exporting Countries, (OPEC). As of 2018, there were 15 member countries in OPEC: Algeria, Angola, Congo, Ecuador, Equatorial Guinea, Gabon, Iran, Iraq, Kuwait, Libya, Nigeria, Qatar, Saudi Arabia, the United Arab Emirates, and Venezuela. OPEC attempts to influence the amount of oil available to the world by assigning a production quota to each member except Iraq, for which no quota is presently set.
Overall compliance with these quotas is mixed since the individual countries make the actual production decisions. All of these countries have a national oil company but also allow international oil companies to operate within their borders. They can restrict the amounts of production by those oil companies. Therefore, the OPEC countries have a large influence on how much of world demand is met by OPEC and non-OPEC supply.
This pressure has lead the United States to developing policies that would reduce reliance on foreign oil such as developing additional domestic sources and obtaining it from non-Middle Eastern countries such as Canada, Mexico, Venezuela, and Nigeria. However, since fossil fuel reserves create jobs and provide dividends to investors, a lot is at stake in a nation that has oil reserves. Oil wealth may be shared with the country’s inhabitants or retained by the oil companies and dictatorships, such as in Nigeria prior to the 1990s.
Attribution
Modified by Melissa Ha from the following sources:
- Challenges and Impacts of Energy Use and Non-Renewable Energy Sources from Environmental Biology by Matthew R. Fisher (licensed under CC-BY)
- Hannah Ritchie (2017) - "Fossil Fuels". Published online at OurWorldInData.org. Accessed 01-16-2021. (licensed under CC-BY)