Biology LibreTexts

15.6: Data Dive- Cholera Cases Worldwide

  • Page ID
    46714
  • \( \newcommand{\vecs}[1]{\overset { \scriptstyle \rightharpoonup} {\mathbf{#1}} } \) \( \newcommand{\vecd}[1]{\overset{-\!-\!\rightharpoonup}{\vphantom{a}\smash {#1}}} \)\(\newcommand{\id}{\mathrm{id}}\) \( \newcommand{\Span}{\mathrm{span}}\) \( \newcommand{\kernel}{\mathrm{null}\,}\) \( \newcommand{\range}{\mathrm{range}\,}\) \( \newcommand{\RealPart}{\mathrm{Re}}\) \( \newcommand{\ImaginaryPart}{\mathrm{Im}}\) \( \newcommand{\Argument}{\mathrm{Arg}}\) \( \newcommand{\norm}[1]{\| #1 \|}\) \( \newcommand{\inner}[2]{\langle #1, #2 \rangle}\) \( \newcommand{\Span}{\mathrm{span}}\) \(\newcommand{\id}{\mathrm{id}}\) \( \newcommand{\Span}{\mathrm{span}}\) \( \newcommand{\kernel}{\mathrm{null}\,}\) \( \newcommand{\range}{\mathrm{range}\,}\) \( \newcommand{\RealPart}{\mathrm{Re}}\) \( \newcommand{\ImaginaryPart}{\mathrm{Im}}\) \( \newcommand{\Argument}{\mathrm{Arg}}\) \( \newcommand{\norm}[1]{\| #1 \|}\) \( \newcommand{\inner}[2]{\langle #1, #2 \rangle}\) \( \newcommand{\Span}{\mathrm{span}}\)\(\newcommand{\AA}{\unicode[.8,0]{x212B}}\)

    Overview

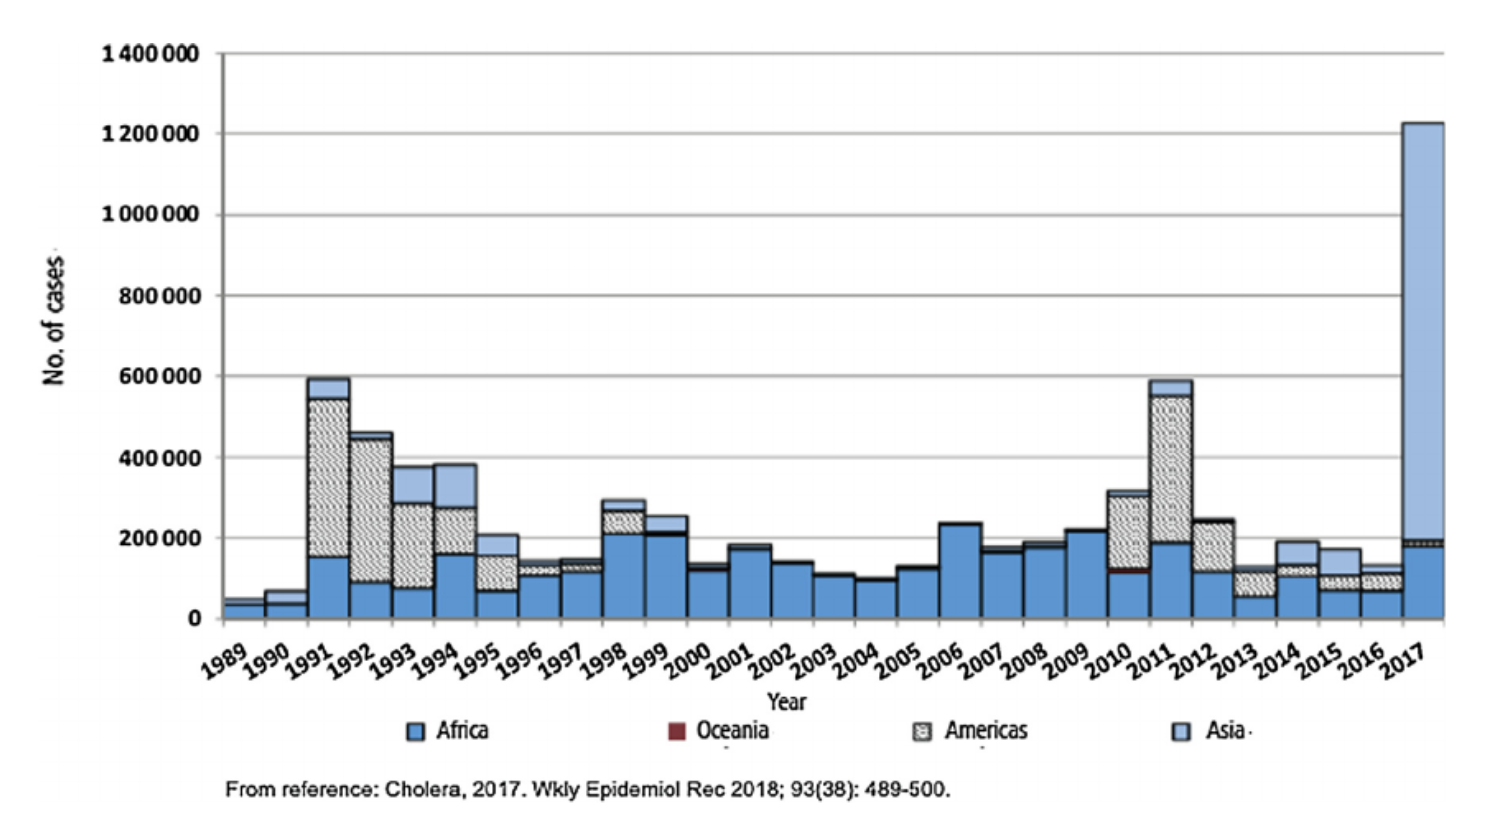
    The World Health Organization (WHO) seeks to promote health and safety for humanity, especially the most vulnerable. What this means is they do everything from basic primary care, to research, to data inventory, to health education, and to many other imperative health initiatives worldwide. When it comes to data, they keep up to date records for chronic and acute diseases, especially those that can cause global/local health emergencies. Generally, the WHO tracks the number of cases (infection rates) and case fatalities for each disease. However, there are many other statistics they can analyze depending on the level of accuracy and detail of the data they receive. They can also break up or group their statistics by country or by continent (as you see below). In addition, the WHO can be a great database for researchers around the globe. Below is a graph created by WHO data on cholera from a 2019 publication about cholera epidemiology:

    Bar graph showing number of cholera cases by world region for over 20 years.
    Figure \(\PageIndex{a}\): Number of cholera cases by world region for 20+ year period. Graph by Deen J, Mengel MA, Clemens JD 2019 (CC-BY4.0)

    Questions

    1. What kind of graph is this?
    2. What is the independent (explanatory) variable and the dependent (response) variable?
    3. Which continent has the most consistent cholera cases?
    4. Describe the patterns you see in cholera cases for the Americas and Asia from 1989 to 2017.
    5. In what ways do you think the WHO uses data observed in the graph above to make choices into the future? Provide at least two ideas/examples.


    Raw Data For Above Graph(s)

    Raw data table link for above graph. (CC-BY4.0)


    Attribution

    Rachel Schleiger (CC-BY-NC)


    This page titled 15.6: Data Dive- Cholera Cases Worldwide is shared under a not declared license and was authored, remixed, and/or curated by Melissa Ha and Rachel Schleiger (ASCCC Open Educational Resources Initiative) .

    • Was this article helpful?