
7.6: Data Dive- Beaver Impacts on Wetlands
- Page ID
- 46705

Overview
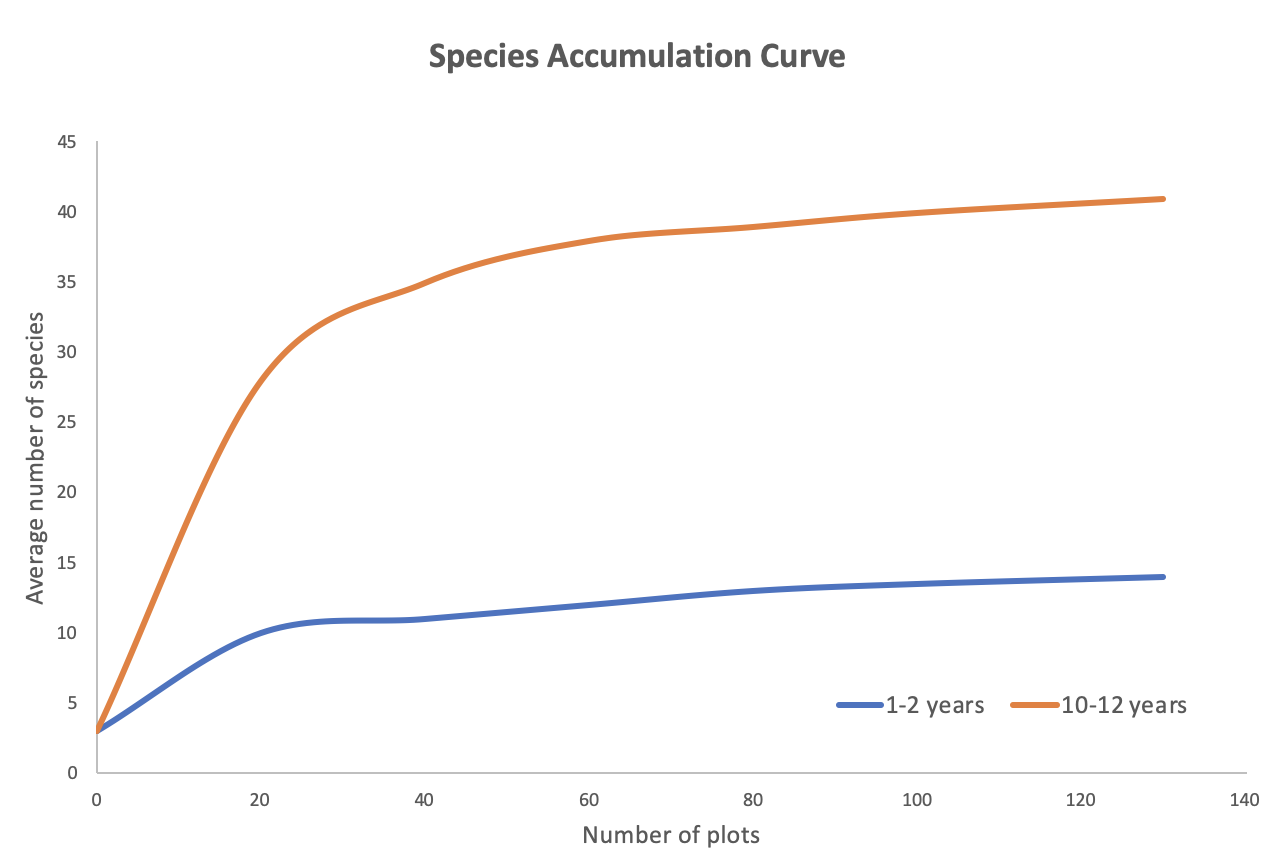
An ecosystem engineer is any animal that creates, significantly modifies, maintains or destroys a habitat. These organisms impact both the abiotic and biotic components of a habitat and can thus completely change landscapes. One 2017 study sought to understand if beavers (classic ecosystem engineer) could even be used as a tool for habitat restoration of wetlands. Specifically, this study focused on quantifying if wetland biodiversity improved as a result of reintroducing beavers on a landscape degraded by agriculture. Figure 2.4.6a below displays some of the results in this study:
Questions
- What is the independent (explanatory) variable and the dependent (response) variable?
- What question(s) are the authors trying to answer with this graph?
- What trend(s) can be observed in this graph between the 1-2 and 10-12 timetables? Support your answer by referring to appropriate patterns in the graph.
- Do you think like the authors are satisfied with the results in the graph? Why?
- How can the results of this graph to inform future reintroduction of beavers where wetland restoration is needed?
- What information/patterns is not clear from this graph?
Raw Data From Above Graph(s)
Table \(\PageIndex{a}\): Raw data for average number of species observed in sample plots 1-2 years and 10-12 years after beavers were introduced. Graph by Rachel Schleiger (CC-BY-NC) modified from data in Law A, Graywood MJ, Jones KC, Ramsay P, and Willby NJ 2017.
| Number Of Plots | Average Number Of Species After 1-2 Years | Average Number Of Species After 10-12 Years |
|---|---|---|
| 0 | 3 | 3 |
| 20 | 10 | 28 |
| 40 | 11 | 35 |
| 60 | 12 | 38 |
| 80 | 13 | 39 |
| 100 | 13.5 | 40 |
| 130 | 14 | 41 |
Attribution
Rachel Schleiger (CC-BY-NC)