
9.2: Estimating Extinction Risk
- Page ID
- 49831

Biologists often use the positive relationship between population size and likelihood of persistence (Section 8.7) to predict the probability that a population may go extinct at some point in the future. One of the most popular tools for making such predictions is population viability analysis (PVA). A PVA can be thought of as a type of extinction risk assessment; it uses demographic data and mathematical methods to predict at what point in the future a population or species is likely to perish. In addition, by considering a species’ resource requirements and the availability of limiting resources, biologists can use the results of a PVA to identify a species’ most vulnerable life stages, and to estimate how management techniques may influence population size and extinction risk. In this way, PVAs can guide conservation decisions by highlighting the need to, for example, modify harvesting regulations, perform translocations (Section 11.2), or provide and protect a greater amount of suitable habitat. Even the IUCN’s Red List Criteria (Section 8.5) uses PVA as a criterion to help prioritise conservation targets: populations with low extinction risk may not require immediate attention, while those approaching extinction thresholds will gain higher priority.
A word of warning
The purpose of this chapter is to provide a brief introduction on the usefulness of quantitative population biology methods such as PVA in conservation. While the methods for studying population sizes, fluctuations, and demographics are very powerful, they are also highly technical, and require specialist knowledge of mathematical procedures. Erroneous predictions from using incorrect methods, violating assumptions, and/or using inadequate data would run counter to well-intentioned objectives; and so, the increased popularity and use of PVA by insufficiently trained conservation scientists is of serious concern. For many people, the methods highlighted in this chapter are best learned by studying under the supervision of an expert, to better understand each model’s assumptions and the newest developments in the field. For people with advanced mathematical skills who might want to study more on their own, texts such as Quantitative Conservation Biology (Morris and Doak, 2002) and Bayesian Methods for Ecology (McCarthy, 2007) may help. The development of user-friendly software packages, such as VORTEX and RAMAS (reviewed in Brook et al., 2000), have also expanded the PVA user-group in recent years. Nonetheless, when obtaining results—even from seasoned demographic modellers—it is important to remember that we cannot account for all future possibilities. Interpreting the results of a PVA, as any other model predicting the future, requires a great deal of caution and a healthy dose of common sense.
Probability of extinction
Population viability analysis (PVA) uses demographic data and mathematical methods to predict if a population or species is likely to persist or perish.
The main purpose of a PVA is to estimate the viability (or time to extinction) of a species or population from observed population sizes and growth rates. Consider a population with 100 individuals that loses 50% of its individuals each year. A simple model will suggest that this population will lose 50 individuals the first year, 25 individuals the second year, and so on, until no individuals are left in the seventh year. The probability of extinction for this population is thus 100%, and the time to extinction is seven years. But how do we deal with the more realistic complex variations in population sizes we see in nature?
A more realistic PVA begins by constructing a mathematical model representing the population of interest using data obtained from a demographic study, which may include the current age (or size) structure of the population, average birth rates, and average survival rates of each age class. This dataset would be organised in a format suitable for PVA modelling using a database package, and then analysed using the methods of matrix algebra. Because results from this initial model have only one outcome—a population that is either stable or growing/declining at a fixed rate—it is called a deterministic model. Typically, deterministic models are then tailored to include a variety of independent environmental parameters, such as food availability, storm frequency, or invasive competitors. Variability can also be added into the model by allowing some or all the model elements (e.g. survival rate or habitat availability) to vary within their observed ranges of values. Catastrophic events, such as a fire that kills a large proportion of the population, can also be programd to occur at random points in time. Hundreds or even thousands of simulations of this complex model can then be run to determine changes in population size over time, the probability of population extinction within a certain period, and the median time to extinction. Because of the variability built into this more complex model, each iteration’s output will vary from the next; for that reason, it is called a stochastic model. The choice of models and the parameters included depend on the goals of the analysis and the management options under consideration.
Minimum viable population
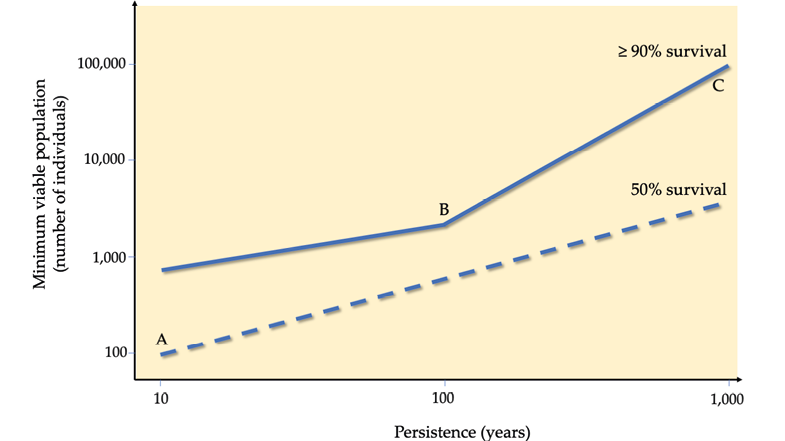
When a PVA shows that a population has a relatively high risk of extinction, a logical next step would be to determine what could be done to prevent the extinction from happening. In general, protecting larger populations reduces extinction probability (Figure 9.5). To understand exactly how large is large enough, a PVA can also be used to estimate a minimum viable population (MVP). As the name implies, an MVP is the smallest number of individuals necessary for a population to have a chance of long-term persistence, despite the potential effects of demographic, environmental, and genetic stochasticity, and natural catastrophes faced by small populations (Section 8.7). This is well illustrated in the influential paper by Shaffer (1981), who compared setting MVP targets to planning for floods; engineers cannot rely on the average annual rainfall when designing flood control systems near rivers and wetlands. Instead, they must design systems that can also handle extreme rainfall and flooding events. These extreme events may occur rarely, perhaps once every 50 years, but they will likely occur during the lifetime of a flood control system. Similarly, to maximise the long-term protection of a threatened species, we must take actions that protect them in both average and extreme years characterized by catastrophic events such as cyclones/hurricanes, forest fires, and disease epidemics (Anderson et al., 2017). This is especially true considering future climate change scenarios, where every year may be uncharacteristically harsh, in effect a 50-year event.
A minimum viable population (MVP) is an estimate of the smallest number of individuals necessary for a population to have a good chance of long-term persistence.
Several studies have attempted to come up with a “universal” MVP value that could ensure that a population of any species has a reasonable chance of persistence. The estimates vary greatly. For example, a universal MVP estimate from the 1980s, the “50/500 rule”, suggested that at least 50 individuals are necessary to prevent inbreeding, and 500 to prevent genetic drift (Frankham et al., 2014). While this 50/500 rule is currently used to guide the IUCN Red List Criteria for small populations (see e.g. Table 8.1, Criteria D), more recent studies suggested that this estimate is much too low. For example, one study that considered over 1,000 species calculated that 1,377 individuals must be protected to ensure the survival of the population and species (Brooke et al., 2006). Another study argued that 4,169 adults needed to be protected (Traill et al., 2007), while a third study identified 7,316 adults as the universal MVP (Reed et al., 2003). The reason why these estimates are highly variable is because MVPs are context specific, with the results varying greatly by species, location, and degree of threat (Flather et al., 2011). For some species, it might be necessary to protect large numbers of individuals—maybe thousands or tens of thousands for invertebrates and annual plants with that can experience large population size fluctuations. For other species, such as those that are long-lived and reproduce regularly, protecting only a few hundred individuals may suffice. Unfortunately, many threatened species have population sizes much smaller than any of these recommended minimums. For example, half of the 23 surveyed elephant populations remaining in West Africa have fewer than 200 individuals (Bouché et al., 2011), a number considered to be vastly inadequate for their long-term survival, especially in the absence of strong conservation management.
While a universal MVP value will probably never be agreed upon, species and location specific MVP estimates have great value for guiding conservation efforts. For example, it can suggest the minimum number of individuals that need to be released to improve chances of reintroduction success (Section 11.2). MVP estimates can also be combined with a species’ home range requirements to determine a minimum dynamic area (MDA), which is the smallest area of suitable habitat required to sustain the MVP. The use of MVP and MDA, and factors influencing it, were well illustrated in several studies on South Africa’s fragmented cheetah (Acinonyx jubatus, VU) population. Here, researchers originally found that translocations every 1–5 years can greatly improve the likelihood of persistence for 20 subpopulations with at least 10 cheetahs each, or for 10 subpopulations with at least 15 cheetahs each (Lindsey et al., 2009). But a follow-up study then showed that these results were context specific, and highly dependent on the presence of other predators that compete for the same prey (Lindsey et al., 2011). With no competitors, a minimum dynamic area of 200 km2 would be sufficient to support 10 cheetahs. However, a reserve of at least 700 km2 would be needed for 15 cheetahs and 15 lions, and even more if other competitor carnivores are present.
Because of the close relationship between population viability and habitat availability, these two factors are often considered together in population and habitat viability assessments (PHVA).
Because of the close relationship between population viability and habitat availability, these two factors are often considered together in population and habitat viability assessments (PHVA, http://www.cpsg.org/our-approach/workshop-processes/phva-workshop-process). Such an assessment was recently performed for Sierra Leone’s western chimpanzees (Pan troglodytes verus, CR), where 53 conservation partners came together to develop a recovery plan for this highly threatened species (Carlsen et al., 2012). As an illustration of how conservation projects can bring people from different walks of life together, the participants for this PHVA came from universities, government, NGOs, and the private sector, and included Paramount Chiefs, representatives from the UN and Sierra Leone’s government ministries, and well as experts in tourism, communications, population modelling, and wildlife rehabilitation.
Effective population size
One of the most important considerations when estimating MVPs is deciding which individuals to include in the calculations. Because population viability depends greatly on a population’s ability to produce young to increase in size (or at least balance out mortality), it makes sense that reproductive status is important in MVP estimations. For that reason, biologists often calculate MVPs using the effective population size (Ne), an estimate of how many individuals or pairs in a population are actively breeding. Consider, for example, a school of 1,000 dolphins; it might have 990 immature individuals and only 10 mature dolphins (five males and five females) that are actively breeding. Even though the full population consists of 1,000 dolphins, the effective population size is only 10—just the mature breeding dolphins.
A population’s effective size is often much smaller than the total population size because not all individuals are capable of breeding at any one time.
It is worth noting that the effective population size may sometimes be even smaller than the number of individuals capable of breeding at any one time. Factors that cause such a scenario include unequal sex ratios, variation in reproductive output, or an inability to find mates. Health status may also play a role; for example, many long-lived seabird species will forego breeding in years where adults did not attain a necessarily healthy body condition, or years when food is scarce (Crawford et al., 2008). Such reduced effective population sizes can lead to drastic population declines, especially when unsuitable conditions persist over consecutive years.
It is also important to remember that the individuals included in effective population size are not the only ones deserving conservation attention. For example, while young animals may not immediately contribute to population growth and stability, they remain a conservation priority for their potential to contribute to population viability in future. Protecting non-reproductive individuals is also important to avoid having cooperative breeders such as African wild dogs (Lycaon pictus, EN) succumb to Allee effects (Section 8.7.2). Individuals that forego reproduction because of poor body condition (e.g. malnourished individuals) can easily become reproductive, and contribute to population viability, if their stressors are mitigated. Lastly, for many species (e.g. many plants, fungi, bacteria, and protists), many (sometimes all) individuals may be dormant for long periods in the soil as seeds, spores, tubers, or other structures. While these dormant individuals may not be part of the effective breeding population, they still contribute to population viability in the long term.
Maximum sustainable yield
A population’s maximum sustainable yield provide an estimate of the greatest number of individuals that can be harvested without detriment to the population.
An important but under-utilised benefit of PVAs is the ability to help conservation managers estimate sustainable harvest rates for wildlife populations at risk of overharvesting (Milner-Gulland and Rowcliffe, 2007). Many threatened species can withstand some level of harvesting, so long as harvest rates are lower than recruitment rates. To estimate the sustainable level of harvesting, biologists may use PVA to estimate a population’s maximum sustainable yield—the greatest number of individuals that can be harvested without detriment to the population (Box 9.3). When estimating maximum sustainable yields for overharvested taxa, it is important to consider not only the total population size (or effective population size), but also harvesting biases produced by harvester preferences and techniques. For example, when estimating hunting quotas, hunter preferring larger animals (Lindsey et al., 2013; Barthold et al., 2016) and animal behavior (Caro et al., 2009) can significantly influence model output. Also, in fisheries management, it is important to consider the outsized role older and larger fish play in recruitment rates, or the indirect damage fishing does the environment or to juvenile individuals (De Leo and Micheli, 2015). Lastly, it is important to consider how harvesting right at maximum sustainable yield levels may leave those populations less buffered to future disturbances (Cumming and Cumming, 2015)—it is thus advisable to maintain harvest quotas well below maximum levels.
David T. S. Hayman
Molecular Epidemiology and Public Health Laboratory,
Hopkirk Research Institute, Massey University,
Palmerston North, New Zealand.
“Full-time hunters are employed to shoot them […] Nothing is known about the natural factors that encourage or repress population growth in the straw-coloured fruit bat, or on what age category these factors have maximum effects. […] No laws, customs or taboos protect the straw-coloured fruit bat from exploitation […].
Funmilayo, 1978
Funmilayo’s comments from the 1970s still ring true about the problems currently facing straw-coloured fruit bats (Eidolon helvum, NT) throughout their African distribution range. The species is hunted widely in West and Central Africa (Figure 9.C), with scientists estimating that over 128,000 and up to 306,000 individuals are killed annually in Ghana (Kamins et al., 2011) and Côte D’Ivoire (Niamien et al., 2015). In Ghana, the population “is hunted far beyond maximum sustainable yield”, concluded an initial study that predicted maximum sustainable yield based on population sizes and estimated intrinsic rate of increase (Kamins et al., 2011). This overhunting has been going on for a long time. Notes from a 1909 field trip to DRC reported them hunted in the “hundreds” (Allen et al., 1917).


Despite these reports of intensive harvesting, straw-coloured fruit bats remain abundant with colonies comprised of several million individuals often reported. The species is also highly mobile, migratory, and panmictic, breeding freely across its continental distribution (Peel et al., 2017). These life history traits make it difficult to determine how hunting is impacting the population because presence and size of colonies are highly variable in space and time (Hayman and Peel, 2016).
What can the natural history of the species tell us about their possible vulnerability to the pressures inherent of being hunted? Straw-coloured fruit bats exhibit classic life history traits of long-lived species. These bats invest time and energy into single, well-developed pups that they nurse and carry, as Funmilayo noted, “until they are capable of independent existence, which gives [the pup] a high chance of survival”. This investment in individual young and single annual breeding events means that straw-coloured fruit bats are susceptible to over-harvesting.
Good information on birth and death rates are required to accurately assess the impact of harvesting. Hayman et al. (2012) estimated birth rate and survival probability parameters in a single colony of up to 1 million straw-coloured fruit bats that roost in trees in Accra, Ghana, demonstrating the feasibility of obtaining such information. Histological examination of tooth growth layers allowed age estimation and life-table analyses to estimate an annual survival probability for juveniles of 43% and adults of 83%. Mark-recapture data using radio-collar telemetry and multi-state models to address confounding emigration estimated lower annual adult survival probability, c. 63%. True survival probabilities likely exist between these estimates, as follow up studies from four further locations suggest (Hayman and Peel, 2016), because permanent emigration may underestimate capture–recapture estimates and population decline may bias life table estimates. Birth rates for the species are high (0.96 young per female per year). Improved estimation of these key parameters will allow for critical analyses of harvest sustainability of straw-coloured fruit bat populations in future.
Sensitivity analysis
A particularly useful feature of PVA—and models in general—is that model parameters can be individually evaluated to better understand the implications of different management strategies. This is usually accomplished with a sensitivity analysis, a method that determines which parameter or combination of parameters has the biggest influence on population viability. Obviously, parameters that greatly influence population viability should become the focus of conservation efforts, whereas parameters that have a minimal effect can be given less attention. Some of the most popular model parameters to investigate are demographic parameters by age class, which can identify which life stages are most sensitive to conservation management. Such a sensitivity analysis might reveal that slight changes in adult mortality rates greatly affect population viability, whereas relatively large changes in juvenile recruitment rates have a minimal impact. Crouse et al. (1987) obtained such a result in their classic study on loggerhead turtles (Caretta caretta VU) living off the USA’s Atlantic coast. At the time, great effort was invested in improving hatching success and ensuring that hatchlings to reach the sea. However, Crouse’s study showed that, even if 100% egg and hatchling success was achieved, sea turtles will remain threatened unless adult survival were also improved. Results from this study subsequently played a significant role in initiating global efforts to reduce sea turtle bycatch during fisheries operations (see e.g. Fennessy and Isaksen, 2007; Ayinla et al., 2011).