9.1: Monitoring Population Size
- Page ID
- 49830

The primary aim of population monitoring is to detect changes in the environment, population size, and species distribution over time. Such monitoring efforts frequently focus on a particular area or a population of concern, but it can also target more common but sensitive species, such as butterflies and macroinvertebrates, which can function as indicator species to assess ecosystem condition (Section 4.2.6). The great number of methods (which are all types of surveys) used to monitor populations usually fall into one of three different categories: biodiversity inventories, population censuses, and demographic studies.
Biodiversity inventories
The primary aim of population monitoring is to detect changes in the environment, population size, and species’ distributions over time.
A biodiversity inventory is an attempt to document which species are present in some defined locality. Such an effort can focus on one specific taxa (e.g. a bird survey) or several taxa, on a small area (e.g. a city park) or large area (e.g. a large national park), over a short period of time (e.g. a few hours) or long period of time (e.g. several years, Box 9.1). There are many methods to compile a biodiversity inventory, ranging from uncomplicated to highly organised, performed by a single person or a large team of experts. Some of the most popular methods for biodiversity inventories include site visits by professional naturalists and questionnaires distributed among local people. To tap into the knowledge and eagerness of amateur naturalists, conservation biologists are also increasingly compiling biodiversity inventories using citizen science surveys (see Box 15.3). Rapid biodiversity assessments (RAP) are sometimes used to compile an inventory under tight deadlines to answer urgent questions and inform urgent decisions. A bioblitz is a special type of biodiversity inventory during which experts on a range of taxa come together to record all the living species within a designated area over a brief period (usually over 24 hours).
Marc Stalmans1 and Piotr Naskrecki2
1 Scientific Services, Gorongosa National Park,
Mozambique.
2 E.O. Wilson Biodiversity Laboratory, Gorongosa National Park,
Mozambique.
stalmans@gorongosa.net and pnaskrec@oeb.harvard.edu
The 4,000 km2 Gorongosa National Park in central Mozambique was proclaimed in 1960 to protect one of the highest densities of large herbivores at the southern end of Africa’s Great Rift Valley (Tinley, 1977). National Parks are often victims of war and political instability and Gorongosa National Park is no exception. It suffered grievously during the protracted period of civil war from the early 1970s to early 1990s. During this time the park lost 90–99% of its elephants, common hippopotamuses (Hippopotamus amphibious, VU), African buffalo (Syncerus caffer, NT), plains zebras, and common wildebeest (Connochaetes taurinus, LC) through poaching by warring parties and hunters from nearby cities and rural communities.
Since then, restoration efforts that started in earnest in 2004 have brought about a spectacular recovery of several affected large mammal populations (Bouley et al., 2018; Stalmans et al., 2019). But conservation management cannot only focus on these flagship species. Considering, amongst others, the impact of climate change and the importance of agriculture (with its associated pests and pollinators) to rural communities, it is vital that conservationists understand the breadth of biodiversity and its relationship to ecosystem functioning. To accomplish this, a program of systematic biodiversity surveys is currently being undertaken in Gorongosa. Each year, a group of international and national specialists team up with park technicians and rangers to conduct a three-week long bioblitz in a subsection of the park. These surveys also serve as training opportunities to prepare young Mozambican scientists to apply modern biological survey methods and technologies.
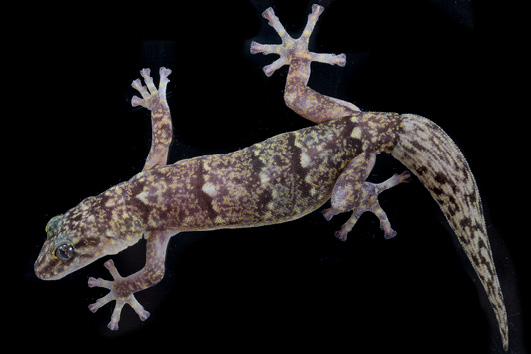
By the beginning of 2019, a total of nearly 5,900 species represented by some 44,000 observations have been entered into the park’s biodiversity database. Based on these data, initial projections suggest that Gorongosa protects 37,500–76,500 different species. Vertebrates are likely to number 850–1,000 species, while plants are estimated to number 2,000–3,000 species. Single orders of insects far exceed those numbers; for example, there may be 3,000–5,000 species of wasps, and 4,000–6,000 species of moths of which 15–25% may be new to science. Local ecosystems are also particularly rich. For the surveys around the Bunga inselbergs (Figure 9.A) in 2015, at least 580 species of butterflies and moths were collected, most of them never before recorded from the Park. Forty species of katydids were recorded, with two species of significance. A large population of Debrona cervina, a large arboreal katydid was discovered, until now known only from two type specimens collected in 1890. Also collected was the predaceous katydid Peringueyella macrocephala, Mozambique’s largest katydid, previously known only from a handful of specimens collected between 1850 and 1965. About 100 species of grasshoppers were recorded, including two species new to science. Additionally, about 30 species of mantids were recorded, including Rhomboderella thorectes, a species previously known from the single holotype collected in the early 1900s. It is expected that the full inventory of the park’s biodiversity will span a period of 20 years.
Biodiversity inventories play an important role in the management of Gorongosa and other national parks, especially in long-term conservation planning. Amongst others, baseline data obtained from our surveys will be used in future to measure overall biodiversity responses to large mammal population changes, evolving patterns of land use around the park, and the impact of climate change. Future biodiversity surveys will also target little known areas adjacent to the park to provide information required for corridor planning.
While biodiversity inventories seldom offer the kinds of detailed data required to predict likelihood of a species’ persistence, they have several uses in conservation. First, a biodiversity inventory can be a comparatively inexpensive and straightforward method to broadly monitor an area’s species and populations. Biodiversity inventories conducted over a wide area can also help determine the distribution of a species, while a comparison with follow-up inventories can highlight distribution changes (which often correspond to population changes). This was well illustrated in a study that used repeated citizen scientist surveys to investigate how songbird distributions have changed across South Africa, Lesotho, and eSwatini between 1987 and 2013 (Péron and Altwegg, 2015).
Population censuses
A population census (also called a count) uses a repeatable sampling protocol to estimate the abundance or density of a population or species which, in turn, can tell us whether a population is doing well or not. When a species is easy to detect, relatively sedentary, and the sampling area is small, a comprehensive census of all individuals may be possible. However, comprehensive censuses are generally very difficult, if not impossible, to conduct when implemented on large or highly mobile populations, or over large areas. In these cases, it may be better to restrict the census to a more manageable subsection of the population, by dividing the area of interest into sampling units, and randomly censusing only some of the units. Population estimates that capture only a fraction of the overall population can then serve as an index for broader trends, or it can be used to estimate the total population size through extrapolation, if the researcher knows which fraction of the population or area was counted.
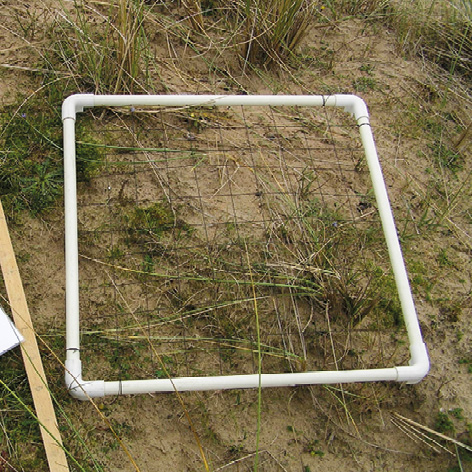
Some popular methods for censusing subsections of wildlife populations are, sampling plots, distance sampling, and mark-recapture surveys. Sampling plots are popular in studies focussing on plants and invertebrates, allowing biologists to systematically count each individual observed in a small area (Figure 9.2). Birds and mammals are often censused using distance sampling, during which all observed individuals on predetermined transects or from points are tallied. The number of individuals observed in the count area can then be extrapolated to obtain population size (or density) estimates for individual (or multiple) species observed across the entire area of interest. Aerial censuses are often used to conduct distance sampling transects over large and open areas, while point counts and walked line-transects are more popular for small areas or closed-canopy ecosystems (White and Edward, 2000). Mark-recapture surveys, mark-resight surveys, and sight-resight surveys are popular for species that are easy to catch, trap, or individually recognized. In this case, captured (and thus counted) individuals would be marked for future identification, after which the total population in an area is estimated by accounting for the proportion of marked and unmarked individuals seen on subsequent visits. The marking of animals can be done with a variety of procedures, including using highly visible tags, paint approved for animal use, or unique marks on the animal itself. One creative study used tourists’ photographs to generate a mark-recapture dataset, which was used to estimate the size of cheetah and African wild dog (Lycaon pictus, EN) populations in South Africa’s Kruger National Park (Marnewick et al., 2014). Like inventories, population censuses can sometimes also lead to unexpected yet important findings: the first comprehensive population survey of sea turtles breeding on Africa’s Atlantic coast recently alerted marine biologists to the fact that Gabon hosts several globally important rookeries (Box 9.2).
Angela Formia
Wildlife Conservation Society,
Global Conservation Program,
New York, NY, USA.
Virtually all the characteristics of sea turtles’ life histories make them difficult to study and conserve. They are long-lived, slow growing, migratory, and almost entirely ocean-dwelling. Although they return to their natal beaches to reproduce, these are usually thousands of kilometres from their developmental and adult foraging grounds. In addition, sea turtle habitat often overlaps with areas of high human use such as developed coastlines and intensive fisheries. Describing population ranges and assessing interaction with human threats is thus critical to their survival.
Over recent decades, we have learnt much about sea turtles along the coastline of Africa (Figure 9.B) thanks to extensive research efforts. For instance, we know that these coasts host globally important populations of green turtles (Chelonia mydas, EN) in Mauritania, Guinea Bissau, Equatorial Guinea and Republic of the Congo; loggerheads (Caretta caretta, VU) on Cabo Verde; hawksbills (Eretmochelys imbricata, CR), on São Tomé and Principe; leatherbacks (Dermochelys coriacea, VU) in Equatorial Guinea and Gabon; and olive ridleys (Lepidochelys olivacea, VU) in Gabon and Angola.

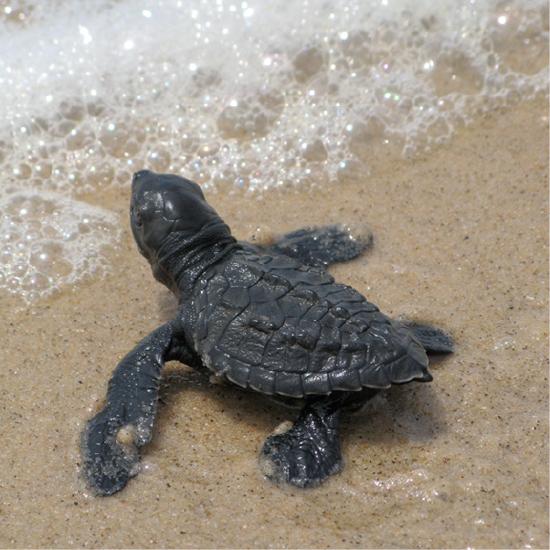
One of Africa’s most remarkable sea turtle populations is Gabon’s leatherback rookery, the biggest in the world with as many as 15,000 to 41,000 nesting females (Witt et al., 2009). Gabon also hosts the largest olive ridley rookery in the Atlantic (Metcalfe et al., 2015), and foraging grounds for green and hawksbill turtles. Until the late 1990s, virtually nothing was known about these populations, other than the fact that eggs and adults were frequently collected for human consumption. Since then, a multi-pronged approach has been adopted to describe and protect Gabon’s sea turtles. Intensive coastal monitoring has allowed scientists to assess spatio-temporal trends in nesting frequency and abundance, and levels of nest-site fidelity and reproductive success. Using techniques, such as satellite telemetry, flipper tagging, oceanic modelling, and dispersal simulations, and genetic and isotopic analyses, researchers have been able to map sea turtle behavior at sea, in Gabon’s coastal waters, and during post-nesting migrations to foraging grounds off South America and South Africa (i.e. Formia et al., 2006, Maxwell et al., 2011, Witt et al., 2011, Pikesley et al., 2018).
Building upon this knowledge, measures have been established to quantify and reduce the impact of threats to Gabon’s sea turtles. In 2002, the Gabonese government created a system of national parks and protected areas encompassing approximately 80% of Gabon’s sea turtle nests; in 2017, a new network of 20 marine protected areas (MPA) was officially created, covering 26% of Gabon’s territorial waters (Parker, 2017). Laws enacted in 2011 prohibit all hunting, capture, and commercialisation of sea turtles. Trained observers on-board industrial fishing vessels quantify sea turtle bycatch from bottom trawling and tuna seiners and reduce mortality by treating and releasing captured turtles. In addition, the Gabonese government now requires that all shrimp trawlers use turtle excluder devices (TED), aluminium grids sewn into the nets allowing sea turtles and other large bycatch to escape, while conserving shrimp catch; similar devices are being developed for fish trawlers. Ongoing efforts are shifting traditional turtle hunting and other destructive practices toward more sustainable fisheries. Turtle-watching ecotourism also represents a growing potential to increase awareness and incentivize conservation efforts.
Nevertheless, African sea turtle conservation remains a formidable challenge. Although the economic context is changing rapidly, impoverished coastal villagers in many countries continue to collect turtles and eggs for local consumption or market sale, and many wealthier urbanites continue to consider them delicacies. These problems are often compounded by corruption, political instability, inadequate law enforcement, and development priorities focused on destructive exploitation. With funding deficits, combating these challenges sometimes seems like a losing battle, but public attitudes are slowly shifting. Even in remote beach villages, the idea that a turtle alive is worth more than dead is no longer such a bizarre concept.

Demographic studies
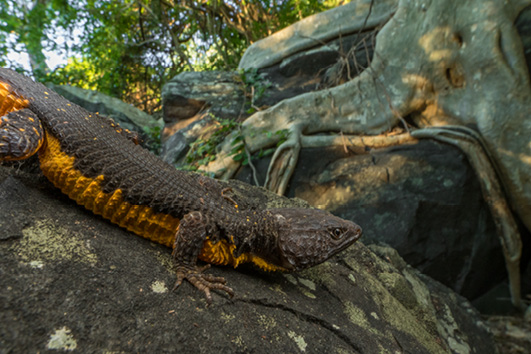
Demographic studies monitor individuals of different ages and sizes over time (Figure 9.3) to obtain a more comprehensive dataset than would be produced by population censuses. Most demographic studies use the same methods that what would be used for a population census; however, in addition to counting and marking, individuals would also be aged, measured for size and body condition, and sexed, when possible. The best demographic studies involve collecting these data from the same individuals over time, which is easiest when working with sedentary species (e.g. plants), populations in an enclosed space (e.g. in a small fenced reserve), animals that are fairly resident and/or habituated to human presence, or individuals carrying biologging devices (Kays et al., 2015). This may not always be possible, in which case biologists may obtain data from different individuals during each field session, to serve as an index for larger population trends.

The data obtained from demographic studies are often used in combination with mathematical modelling to guide and refine conservation strategies. For example, researchers frequently compare the age structure (i.e. the percentage of juveniles, reproductively active adults, and older post-reproductive-age adults) of a declining population to that of a stable population to identify causes of decline, and the population parameters that are most sensitive to disturbances. This information can then be used to predict population sizes at different points in the future, and how those populations may respond to different management scenarios. The aim of many demographic studies is to predict, and identify strategies to reduce, extinction risk (see Section 9.2).
Recent progress in collecting survey data
Conservation activities are regularly impeded by insufficient information. This is especially true in tropical regions of the world, where most threatened species lack demographic data, and some species lack reliable data altogether. Faced with these gaps, biologists have started using several innovative methods to fill data gaps. Prominent examples include using market surveys (e.g. Kümpel et al., 2010, Ingram et al., 2015) and interviews with local people (e.g. Edwards and Plagányi, 2008) to obtain much-needed baseline survey data. It is important to note that such datasets, obtained second-hand rather than directly, can be unreliable and biased, especially if data are collected from harvesters unwilling to report on their own illegal activities. It is thus important to combine potentially unreliable datasets with reliable datasets, or obtain independent verification, before using such data to make important decisions. One such example comes from West Africa, where researchers wanted to quantify extinction risk for the Nigeria-Cameroon chimpanzee (Pan troglodytes ellioti, EN). Here, biologists related unreliable market survey data to two reliable datasets—orphan intake rate at wildlife sanctuaries and the number of young in wild groups—to estimate that the region’s chimpanzees might be extinct within the next 20 years because hunting was two to 13 times higher than the population could sustain (Hughes et al., 2011).
Camera traps, hair snares, and faecal samples all provide non-invasive sampling techniques to obtain baseline data needed for conservation assessments.
Collecting genetic material on elusive and rarely-seen animals with non-invasive techniques such as hair snares and faecal sampling are also becoming increasingly popular means of collecting survey data. Researchers in Gabon did just that, by using genetic material obtained from dung to estimate the population size, gender ratio, age distribution, breeding status, relatedness, and dispersal patterns of the region’s forest elephant (Loxodonta cyclotis) population (Eggert et al., 2013). These non-invasive techniques reduce the need for researchers to be in the field, thereby reducing both the researchers’ exposure to dangerous conditions and disturbances to the populations they are trying to monitor.
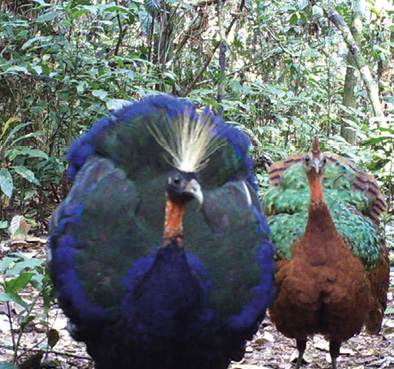
Camera traps represent another non-invasive survey technique whose popularity has greatly increased in recent years. These special cameras, often placed at supplemental food or next to wildlife paths, are activated automatically when an animal passes into the area covered by the camera’s motion sensors (Figure 9.4). This photographic record of movement can then be used to obtain biodiversity inventories, population size estimations, or even to compile demographic datasets (Steenweg et al., 2017). Creative researchers at South Africa’s Robben Island even successfully combined camera trapping with human facial recognition technology—more generally associated with law enforcement—to automate monitoring of individual African penguins (Spheniscus demersus, EN) (Sherley et al., 2010).