
13.2: Consciously Controlled Predation
- Page ID
- 25500

Consider predation by humans that is not subject to the cyclical dynamics of natural predator–prey interactions, but is instead consciously controlled to provide steady, reliable returns—from the world’s fisheries, for example. How is this attempted?
Recall logistic population growth, where the ecological term \(s\) is negative. Figure \(\PageIndex{1}\) shows the individual growth rate on the vertical axis and the population density on the horizontal axis, as you have seen before. Individual growth means the same thing as growth per capita, or relative growth, or percentage growth if multiplied by 100. The intention is to apply this to logistically growing populations of prey.
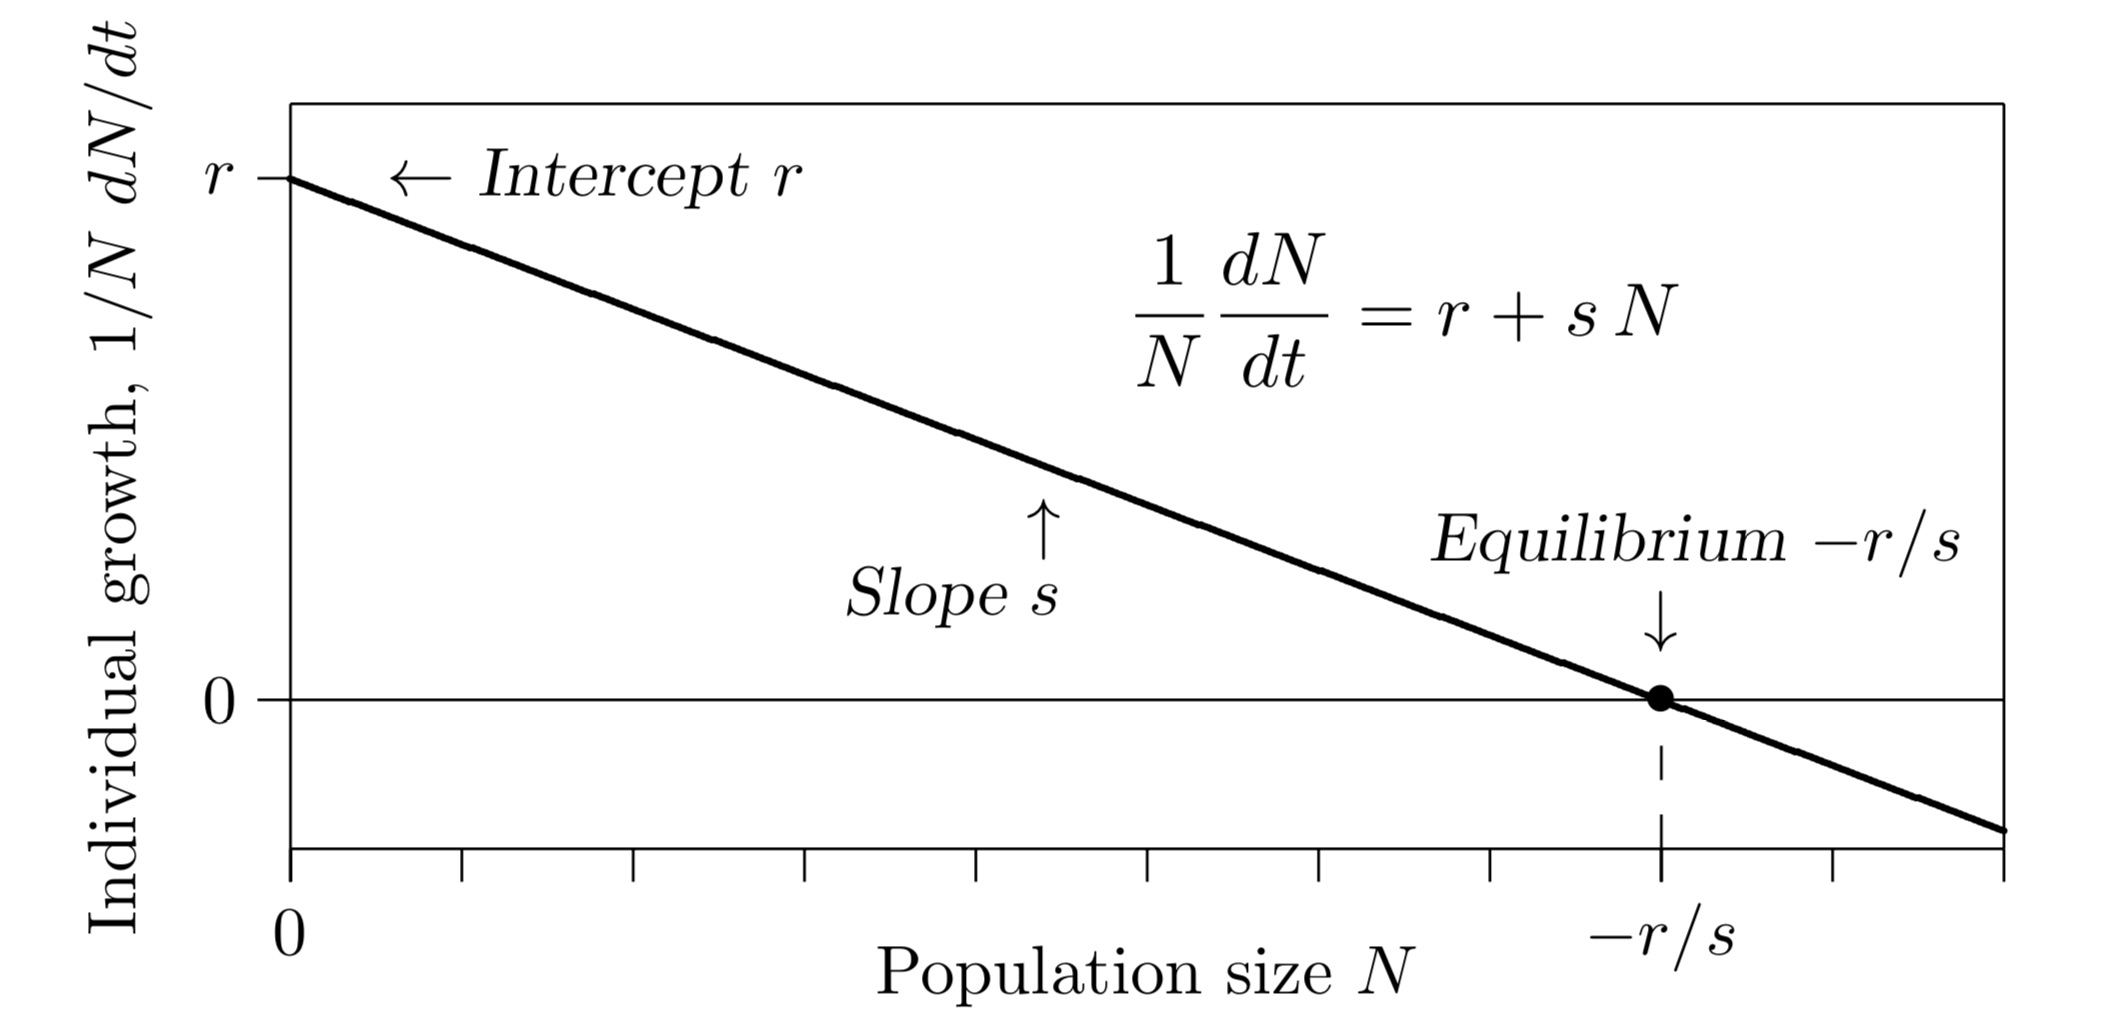
It is the growth rate of the whole population, however, that is of interest in controlled predation—not the per capita growth rate—since it is a fraction of the whole population that is to be taken. So the vertical axis should show \(dN/dt\) rather than \(1/N\,dN/dt\). Start with the individual growth rate, which reaches its maximum \(r\) as \(N\) approaches 0. Here the population produces very few individuals because the population itself is almost nonexistent.
\[\frac{1}{N}\frac{dN}{dt}\,=\,r\,+\,sN\]
The goal is to maximize the population growth rate so that the greatest number of prey can be taken. To find that number, multiply both sides of the equation above by the number of individuals, \(N\), to get the growth rate of the entire population—in other words, to determine how many individuals are added to the population in a unit of time. The result is
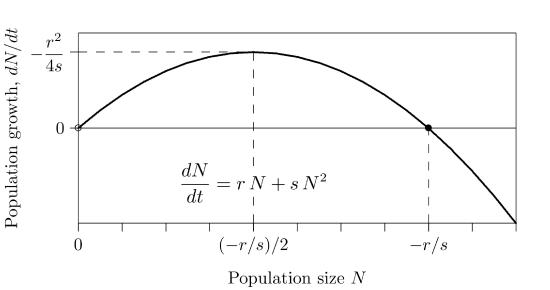
\[\frac{dN}{dt}\,=\,rN\,+\,sN^2\]
The growth of the entire population, \(dN/dt\), has the shape of an inverted parabola, shown in Figure \(\PageIndex{2}\), since \(s\) is negative. Population growth is lowest when the population is very small, near 0, or when it is high, near its carrying capacity,\(−r/s\). It reaches its maximum growth rate midway, at half the carrying capacity, \((−r/s)\,/\,2\). So if the population is kept at half its carrying capacity, it will be growing its fastest and the greatest amount can be “harvested” each year.
What is that maximum rate? To find it, substitute half the carrying capacity, \(−r/(2s)\), for \(N\) in the equation above, giving
\[ \begin{align*} \frac{dN}{dt}\Biggr\vert_{max} &= r\left(-\frac{r}{2s}\right)\,+\,s\left(-\frac{r}{2s}\right)^2 \\[4pt] &= -\frac{r^2}{2s}\,+\,s\frac{r^2}{4s^2} \\[4pt] &=\,-\frac{r^2}{4s} \end{align*}\]
So in this theory the population grows most rapidly at rate \(−r^2/(4s)\), producing the greatest number of new individuals if drawn down to half its carrying capacity. This has been called the “maximum sustainable yield.”
Let us introduce a harvesting intensity, \(H\). When \(H\) is zero, there is no harvesting, and when \(H\) is 1, harvesting is at the maximum sustainable rate. In between it is proportional.
\[\frac{dN}{dt}\,=\,(rN\,+\,sN^2)\,+\,H\frac{r^2}{4s}\]
\(\frac{dN}{dt}\,\Rightarrow\) The net rate of population growth: the number of individuals per time unit, considering births, deaths, and hunting
\((rN\,+\,sN^2)\,\Rightarrow\) The rate of addition: the number of individuals born per time unit minus those dying from causes other than hunting
\(H\frac{r^2}{4s}\,\Rightarrow\) The rate of removal: the number of individuals caught per time unit
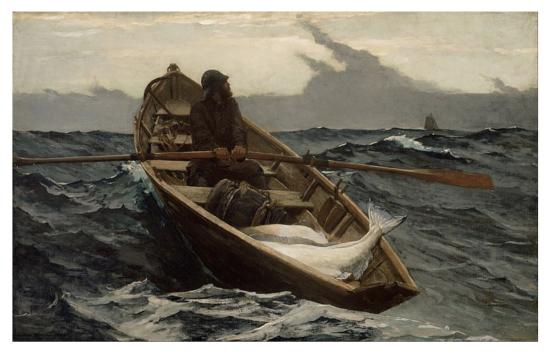
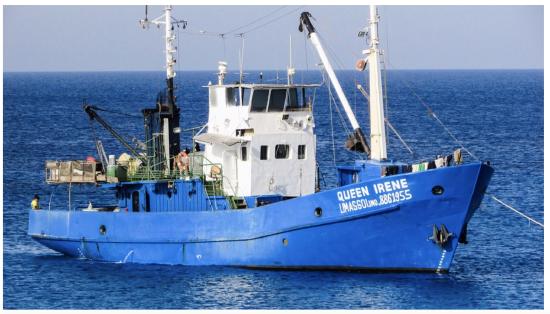
If individual fishermen predominate (Figure \(\PageIndex{3}\), left), \(H\) will be small. This pulls the curve down, as in Figure \(\PageIndex{4}\), lowering the carrying capacity slightly and leaving somewhat fewer fish in the sea. It also introduces an Allee point, though that point is far below the equilibrium and therefore not a significant danger.
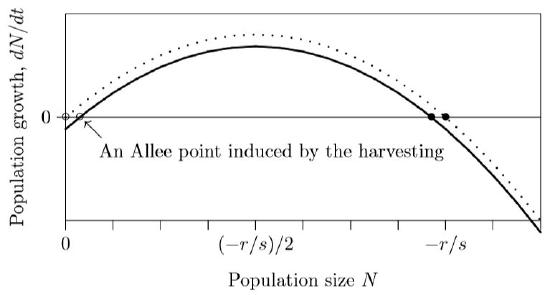
Figure \(\PageIndex{4}\): Population growth with light harvesting (H small).
But with increasingly focused and mechanized fishing (Figure \(\PageIndex{3}\), right), H approaches 1 and the curve is pulled farther down (Figure \(\PageIndex{5}\)). The carrying capacity is markedly reduced and the population produces new individuals at a large rate. And the Allee point is pulled close to the carrying capacity, introducing a danger that unforeseen fluctuations in the population could push the population below the Allee point and collapse the fishery.
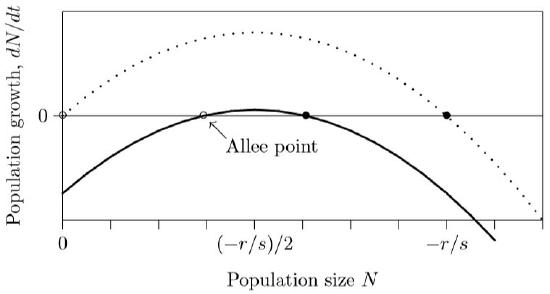
Figure \(\PageIndex{5}\): Population growth with heavy harvesting (H near 1).
Finally, with hunting or fishing at the maximum sustainable yield, the Allee point coincides with the carrying capacity and in effect annihilates it (Figure \(\PageIndex{6}\)). This introduces a dynamical conflict because there is a stable situation to the right but an unstable one to the left, making it inevitable that the population will fall below the Allee point and collapse. The maximum yield is not sustainable!
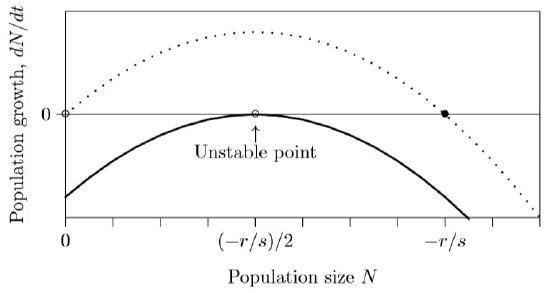
Figure \(\PageIndex{6}\). Population growth with maximal harvesting (H=1).