
4.4: Parameter combinations
- Page ID
- 25439

Before moving further, consider all possible combinations of the parameters, as determined by their signs. There are six possibilities, ignoring growth rates of exactly zero as infinitely unlikely.
- r>0, s>0 Orthologistic growth.
- r<0, s>0 Orthologistic growth with an Allee point.
- r>0, s=0 Exponential growth.
- r>0, s<0 Logistic growth with a carrying capacity.
- r<0, s<0 Inviable population declining to extinction.
- r<0, s=0 Same as above.
Figure \(\PageIndex{1}\) shows three of these possibilities pieced together to form a complete population model. On the left in the figure, number 2 above, orthologistic growth with an Allee point, prevails at low densities, where larger numbers of other members of the species in the vicinity enhance growth. In the middle, number 3 above, exponential growth, occurs as a transition phase. Finally on the right, number 4 above, logistic growth with a carrying capacity, takes over when crowding and other limitations reduce growth rates as larger numbers of other members of the species in the vicinity appear.
The vertical axis in Figure \(\PageIndex{1}\) shows the individual growth rate, and the horizontal axis shows the population density. On the right, where the slope is negative, as the density approaches −r /s from the left the growth rate on the vertical axis drops to zero, so the population stops growing.
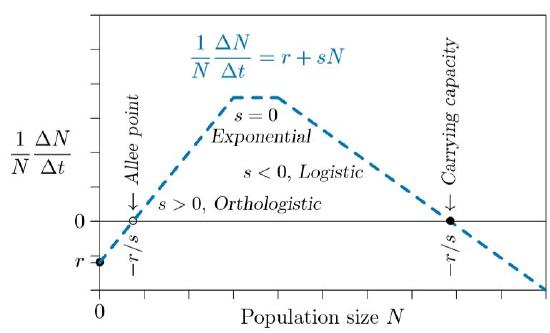
This is the equilibrium value called the “carrying capacity.” If something pushes the population above that value— immigration of animals from another region, for example— then the growth rate on the vertical axis drops below zero. The growth rate then is negative, and therefore the population declines. On the other hand, if something drops the population below that value—such as emigration of animals to another place—the growth rate on the vertical axis rises above zero. That growth rate is positive, and therefore the population grows.
The carrying capacity is “stable.” A value is said to be stable if it tends to restore itself when it is pushed away by some outside force.
 The situation is entirely different on the left in the figure, where the slope is positive. As on the right, when the density is −r /s, the growth rate on the vertical axis reaches zero, meaning the population does not change. This is an equilibrium too— not a carrying capacity, but an Allee point. However, if the population here drifts below −r /s, the growth rate on the vertical axis becomes negative and the population declines further still. It is unstable. In this model the population continues to decline until eventual extinction. Above the Allee point, however, the growth rate on the vertical axis is positive, so the population increases until it reaches some other limitation.