33.5: Causality Modeling and Testing
- Page ID
- 41319
A central question for personal genomics is the question of which markers are causal of disease. For example, one might ask whether methylation at a certain loci, or a certain histone modification, increases a person’s risk for a certain disease. This question is difficult because we need to separate spurious correlations from causal effects - for example, it is possible that a mutation elsewhere in the genome causes the disease, and also increases the chance of observing a particular marker, but that the marker has no causal effect on the disease. In this case, we would find a correlation between the disease phenotype and the presence of the marker despite the lack of any causal effect.
The key insight that allows us to determine causal effects, as opposed to mere correlations, is the observation that while the genotype may influence a person’s risk for a particular disease, the disease will not modify a person’s genotype. This allows us to use genotype as an instrumental variable for methylation. This limits the number of possible models so that we can statistically test which model is most consistent with the observed data.
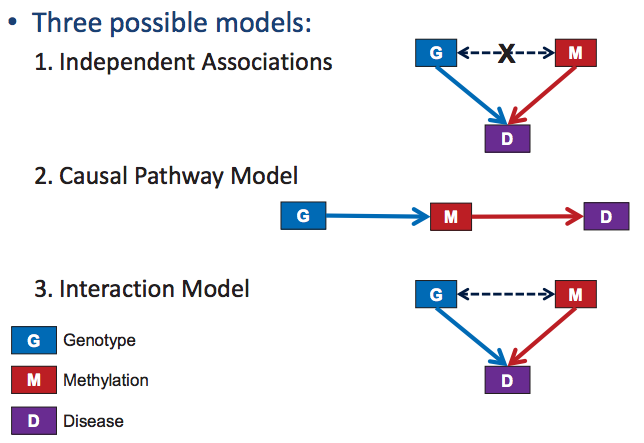
There are three possibilities for modeling complex human diseases: the independent associations model, the interaction model, and the causal pathway model, depicted in Figure 33.4. We will use the example of studying the causal relationship between methylation at a certain loci and disease to demonstrate how to test for a causal effect.
Commons license. For more information, see http://ocw.mit.edu/help/faq-fair-use/.
Figure 33.4: Modeling Human Disease
Under the independent associations model, the data should contain no correlation between the genotype and the disease, which distinguishes this model from the interaction and causal pathway models. However, there will be correlations between each of the factors and the disease separately. Thus, this model is straightforward to test for. An example of this would be two independent risk genes.
Under the interaction model, factor Bs effect on a disease may vary depending on the value for A. For example, a drugs effect on someone can be different based on their genotype. To test for this, we determine the statistical significance of the effect of the interaction term, \(\beta_{2}\), in the regression \(D=\beta_{0} A+\beta_{1} B+\beta_{2} A * B\). If there is a significant interaction effect, we can isolate the separate effects by stratifyng across different levels of A.
The causal pathway model is a little more complex. If we notice a correlation between a risk factor and a disease, we may wonder whether there is a direct link between risk factor A and a disease, or does the risk factor A affect risk factor B which then affects the disease. In the case that risk factor A only has an effect on the disease through B, we will observe that after conditioning upon B, the correlation between A and D disappears, that is, B “mediates” this interaction. In reality, the effect of A on a disease is usually only partially mediated through B, so we can instead look for if the effect size of A on the disease is decreased when B is observed.
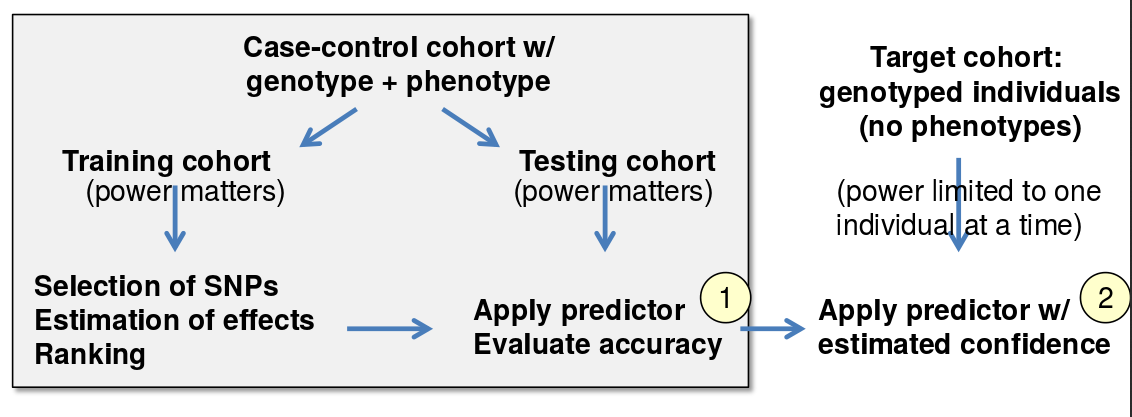
Polygenic Risk Prediction
One of the most central questions of personal genomics is prediction of genetic predispositions to various genetic traits, using multiple genes to inform our predictions. The basic approach is explained in Figure 33.5. First, the data set is divided into a training and test set, and in the training cohort, we select which SNPs are most important and their appropriate weightings. Then we use the test set to evaluate the accuracy of our predictions. Finally, we use this model to predict genetic predispositions for the target cohort by using the confidences we determined from the test set.