
33.4: Molecular Epidemiology
- Page ID
- 41318
Molecular Epidemiology involves looking at the molecular biomarkers of a disease state. This includes looking at gene expression profiles, DNA methylation patterns i.e. epigenomics, and chromatin structure and organization in specific cell types. In earlier chapters, we discussed the link between gene expression (as RNA or proteins) and SNPs in the context of eQTL studies. As a reminder, eQTLs (expression quantitative trait loci) seek linear correlations between gene expression levels and different variants of a genetic locus.
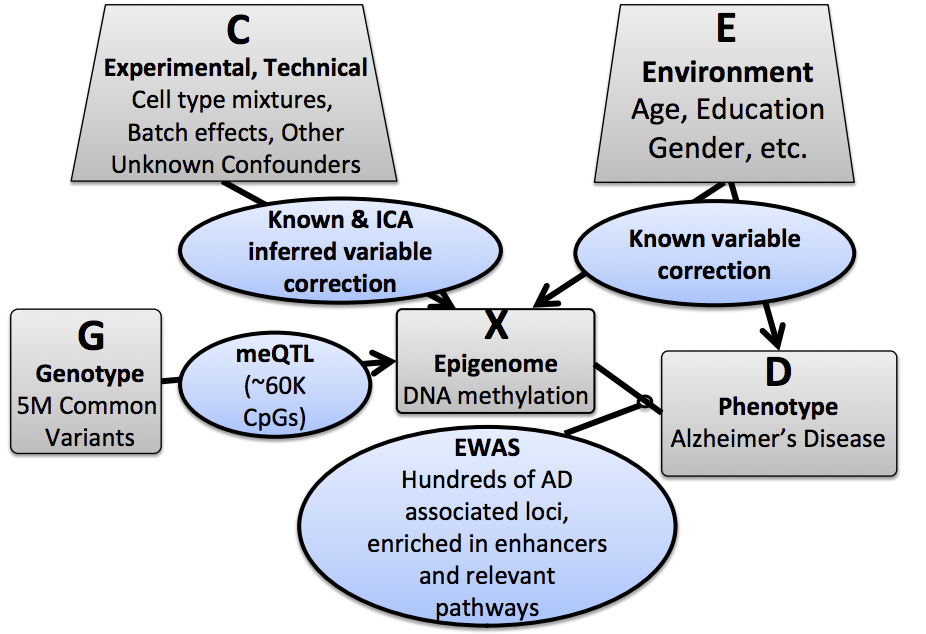
This section will focus on understanding the the role of epigenomic markers as molecular indicators of a disease. It is important to understand that multiple factors, and thus multiple datasets come into play in understanding the epigenomic basis of disease: methylaytion patterns of sample patients (M), genomic information (G) for the same individuals, enviornmental data (E, covering covariates like age, gender, smoking habits etc.), and phenotype quantifications (P, can capture multiple phenotypic markers, for example in Alzheimer’s Disease, the number of neuronal plaques per patient). Furthermore, we need to understand the various interconnections and dependencies between these data sets to make meaningful conclusions about the influence of methylation for a certain disease.
To remove experimental, technical or environmental covariants, we rely on either known, or ICA (Inde- pendent component analysis)-inferred corrections. To link genetic data to methylation patterns, we look for meQTLs (methylation quantitative trati loci), which is equivalent to eQTLs. Molecular phenotypes such as expression level or methylation level are also quantitative traits. Finally, to link methylation patterns with diseases, we implement EWAS (Epigenome-wide association studies).
meQTLs
The discovery of meQTLs follows a process that is highly similar to the methodology used for discovering eQTLs. To discover cis-meQTLs (i.e. meQTLs where the effect on methylation is proximal to the tested locus) we select a genomic window, and use a linear model to test whether or not we see a correlation between methylation and SNP variants in that region. We test to see if the correlation is significant via an F-test, where our null hypothesis is that the additional model complexity introduced via the genomic information does not explain a significant portion of variation in methylation patterns. Other methods of discovering meQTLs include permutation and Linear Mixed Models (LMM).
Example An example of using meQTLs in discovering the connection between methylation, genotype, and disease is the Memory and Aging Project. 750 elderly people enrolled in the project many years ago and today, they have mostly died and given their brain to science. The genotype and methylation of the dorsal lateral prefrontal cortex were determined in order to study the connection between methylation and the phenotype of Alzheimer’s and how the genotype may affect the methylation profile. SNP data, methylation, environmental factors (such as age, gender, sample batch, smoking status, etc..), and phenotype were taken into account. First covariants needed to be discovered and excluded to make sure the results obtained are not due to confounding factors. This is done by decomposing the matrix of methylation data by doing ICA. This enables the discovery of variables that are driving the most variability in the trait. The batch sample and cell mixture can have the biggest effect in the variation between individuals. After this is corrected for, linear models, permutation tests, and linear mixed models are used to determine cis-meQTLs–how much the genotype explains the methylation level.
EWAS
Epigenome-Wide Genome Studies (EWAS) aim to find connections between the methylation pattern of a patient and their phenotype. Much like GWAS, EWAS relies on linear models and p-value testing for finding linkages between epigenomic profiles and disease states. Together with meQTLs, EWAS can also potentially shine light on whether a given methylation pattern is the cause or result of a disease. Ideally, the idea is to be able to generate models that allow us to predict disease states (phenotypes) based on methylation.
There are some drawbacks to EWAS. First, the variance in methylation patterns due to phenotype is typically very small, making it difficult to link epigenomic states to disease states, similar to seeking a needle in a haystack. To improve this situation, we need to control for other sources of variance in our methylation data, such as gender, age etc. Gender, for example, incorporates a large variance for the case of Alzheimer’s Disease. We additionally need to account for variance due to genotype (in the form of meQTLs). Additionally, variability across samples is a major issue in collecting methylation data for EWAS[? ]. As different cell types in the same individual will have different epigenomic signatures, it is important that relevant tissue samples are collected, and the data is corrected for the different cell/tissue types involved in a study.