
8.1: Background
- Page ID
- 17538

Agarose gels provide a simple method for analyzing preparations of DNA. DNA molecules share the same charge/mass ratio, which imparts similar electrophoretic properties to linear DNA molecules of widely varying lengths. We will use “molecule” to refer to a linear piece of DNA, but keep in mind that a single DNA “molecule” may contain the sequences of multiple genes or parts of genes.
Agarose gels are porous matrices
Agarose is a polysaccharide purified from red algae, or seaweed. Agarose is more highly purified (and significantly more expensive!) than agar, which is obtained from the same 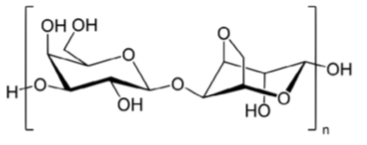 seaweed. Agarose molecules are long, linear polymers of a repeating disaccharide D-galactose and 3,6-anhydro-α-L-galactopyranose (right). A typical agarose molecule contains over one hundred subunits. The agarose used for electrophoresis has been highly purified. The purification process removes contaminants that would interfere with the enzymes used in molecular cloning, such as restriction endonucleases. The process also generates an agarose preparation with desirable electrophoretic properties and minimal background fluorescence, which is important for visualizing DNA molecules.
Agarose molecules are able to form gels with relatively defined pore sizes because of
the chemical properties of agarose molecules. Agarose demonstrates hysteresis - its melting temperature is higher than its gelling temperature. Agarose molecules dissolve at about 90°C, forming random coils in solution. Gels form when the temperature falls to approximately 40°C. As the gel forms, the agarose molecules first assemble into helical fibers, which then further aggregate to form networks of supercoiled helices stabilized by hydrogen bonds. The sizes of the pores, which typically range from 50 to 200 nm, depend on the concentration of agarose. As the agarose concentration increases, the average diameter of the pore decreases.
Several factors affect the migration of DNA through agarose gels
Because of the negative charge of the phosphate residues in the DNA backbone, DNA molecules move toward the positive pole (anode) of the electrophoresis apparatus. The actual migration rate of DNA molecules in a particular experiment is affected by multiple factors.
Some of these factors are intrinsic to the DNA molecules, while other factors relate to the electrophoretic conditions. Intrinsic factors include both the length and conformation of
the DNA molecules that are being analyzed. Within a certain size range dictated by the gel conditions, the migration rate of linear DNA molecules is inversely proportional to the log10(number of base pairs). The migration of more structured DNA molecules, such as supercoiled plasmids, is much less predictable. The migration rates of these more highly structured DNAs are influenced by the density of coils, the presence of nicks, and other structural features.
The migration rates of DNA molecules in agarose gels are also affected by the composition of the gel. The migration rate of a DNA molecule decreases as the concentration of agarose in the gel increases. Researchers commonly adjust the agarose concentration to optimize the resolution of DNA molecules within a particular size range. The two buffers commonly used in labs, TAE (Tris: acetate: EDTA) and TBE (Tris: borate: EDTA), also affect electrophoresis rates.
Because of this inherent variability, researchers ALWAYS include a lane of DNA standards with known sizes on the same gel as the samples being analyzed. Importantly, these standards need to have a similar structure (e.g. linear or supercoiled) and to be subjected to the same chemical modifications as the DNA samples being analyzed.
Fluorescent intercalating agents are used to visualize DNA molecules in gels
Nucleic acids are visualized by fluorescent dyes that bind strongly to DNA. The dyes are intercalating agents that insert into the DNA helix and into structured regions of single-stranded nucleic acids. The fluorescence of these dyes increases by an order of magnitude when they bind nucleic acids, so the background fluoresence on agarose gels is usually low. In this class, we will use ethidium bromide (EtBr) to visualize DNA fragments. EtBr absorbs light in the ultraviolet (UV) range and emits orange light. Gels are viewed with special transilluminators containing UV lights. EtBr is a light-sensitive compound, so stocks are stored in the dark.
Standards are used to estimate the sizes of DNA molecules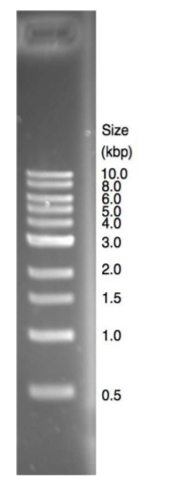
The figure on the right shows a lane from an EtBr-stained 1% agarose gel containing DNA size standards. The 1 kb ladder shown in this student gel
is a proprietary mixture of linear DNA fragments ranging in size from 0.5 to 10 kilobases (kb). The staining intensity of bands on agarose gels reflects the quantity of DNA in the band, because EtBr intercalates fairly evenly along the length of linear DNA molecules. As you can see, this particular mixture contains similar quantities of each DNA fragment, with the exception of the 3 kb fragment, which has ~2.5 more DNA than the other fragments. The greater intensity of the 3 kb fragment serves as a useful orientation marker in situations where smaller fragments might have run off the end of the gel or when some markers are not well resolved from one another. (These are common occurrences!)
Note that the shortest molecules on the gel are more well separated from one another than the longer molecules. The PCR products that you will be analyzing in this lab are mostly in the 400-1000 bp range. To increase the resolution of these molecules, we will use 1.25% agarose gels. (This will reduce the resolution of larger DNA molecules). Note also that smaller bands appear fuzzier on the stained gel, because they have been more affected by random diffusion as they have migrated through the network of agarose polymers.