5.1.1: Population Size and Density
- Page ID
- 32072

Learning Objectives
- Describe how ecologists measure population size and density.
- Describe three different patterns of population distribution.
Population Size and Density
Populations are characterized by their population size (total number of individuals) and their population density (number of individuals per unit area). A population may have a large number of individuals that are distributed densely, or sparsely. There are also populations with small numbers of individuals that may be dense or very sparsely distributed in a local area. Population size can affect potential for adaptation because it affects the amount of genetic variation present in the population. Density can have effects on interactions within a population such as competition for food and the ability of individuals to find a mate.
Population Research Methods
Counting all individuals in a population is the most accurate way to determine its size. However, this approach is not usually feasible, especially for large populations or extensive habitats. Instead, scientists study populations by sampling, which involves counting individuals within a certain area or volume that is part of the population’s habitat. Analysis of sample data enables scientists to infer population size and population density about the entire population.
A variety of methods can be used to sample populations. Scientists usually estimate the populations of sessile or slow-moving organisms with the quadrat method. A quadrat is a square that encloses an area within a habitat. The area may be defined by staking it out with sticks and string, or using a square made of wood, plastic, or metal placed on the ground (Figure \(\PageIndex{1}\)).

A field study usually includes several quadrat samples at random locations or along a transect in representative habitat. After they place the quadrats, researchers count the number of individuals that lie within the quadrat boundaries. The researcher decides the quadrat size and number of samples from the type of organism, its spatial distribution, and other factors. For sampling daffodils, a 1 m2 quadrat could be appropriate. Giant redwoods are larger and live further apart from each other, so a larger quadrat, such as 100 m2, would be necessary. The correct quadrat size ensures counts of enough individuals to get a sample representative of the entire habitat.
Species Distribution
In addition to measuring simple density, further information about a population can be obtained by looking at the distribution of the individuals. Species dispersion patterns (or distribution patterns) show the spatial relationship between members of a population within a habitat at a particular point in time. In other words, they show whether members of the species live close together or far apart, and what patterns are evident when they are spaced apart.
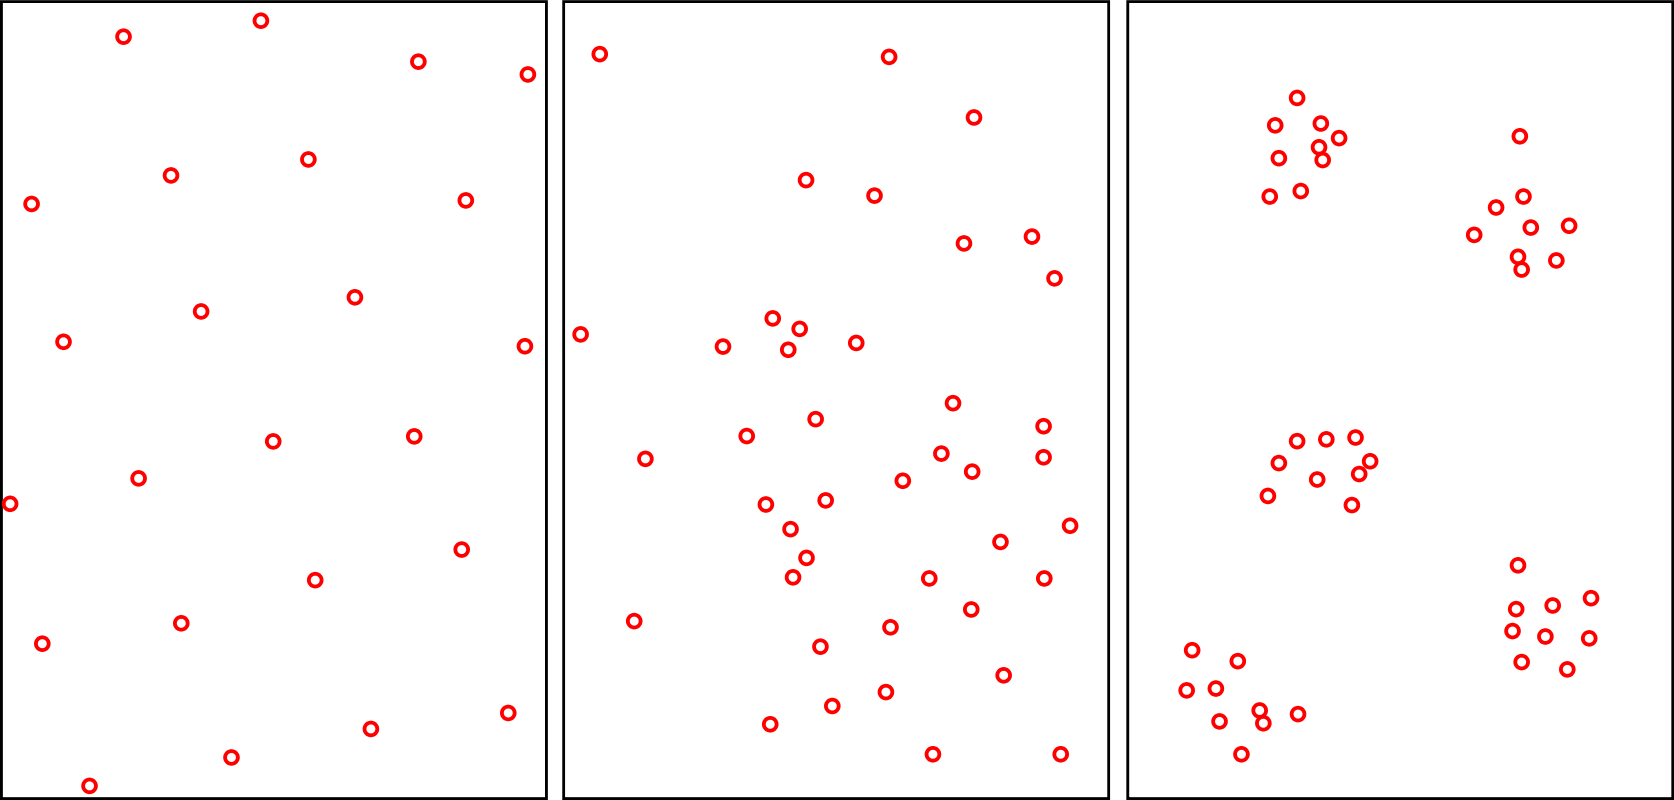
Individuals of a population can be distributed in one of three basic patterns: they can be more or less equally spaced apart (uniform dispersion), dispersed randomly with no predictable pattern (random dispersion), or clustered in groups (clumped dispersion). (Figure \(\PageIndex{2}\)). Plants with wind-dispersed seeds disperse randomly, as they germinate wherever they happen to fall in a favorable environment. Uniform dispersion is observed in plants that secrete substances inhibiting the growth of nearby individuals (such as the release of toxic chemicals by the sage plant Salvia leucophylla, a phenomenon called allelopathy). A clumped dispersion may be seen in plants that drop their seeds straight to the ground, such as oak trees.