
6.3: How to Use Site Index Curves
- Page ID
- 20276

6.3 How to Use Site Index Curves
Site Index is defined as the height of a tree at some base age. Height is in feet. For young stands, a base age of 50 years is typically used; for mature stands a base age of 100 is used. As rotation lengths decline, more and more site index values are indexed to a base age of 50. In the literature of Pacific Northwest species, if the age is not referenced, a base age of 100 years is understood. In practice, most second-growth stands are indexed to age 50. For some short-lived species, such as red alder (Alnus rubra), a base age of 20 years may be used.
Therefore, a stand with an average 50-yr site index of 110 would indicate that the trees are capable of reaching a total height of 110 feet at 50 years. By establishing a base age, stands of any age can be evaluated and compared, and thus the number “110” becomes an index to the site’s productivity. We know whether this is a high site or low site when compared with other tree heights at this age.
Site index curves have been developed by plotting heights of different aged trees from study areas throughout a region. Best-fit lines are drawn through the plotted trees, and harmonic curves developed. The curves for King’s 50-yr site index for Douglas-fir, developed from stem analysis of trees in western Washington, are shown in Figure 6.5. Note that as site quality improves, the curves are steeper, particularly for young trees. Growth rates tend to level out as the trees mature.
The growth curves also allow one to estimate a tree’s height at any age. By tracing along the curves, a tree that is 40 years old can be “grown” to obtain its estimated height at age 50 or 100 years. Likewise, a curve can estimate how tall a 90 year-old tree was at age 50 (see Figure 6.5). In this way, the growth curves can use current height and age data to predict the height of trees at a common or index age. Site index (SI), defined as the height of dominant and codominant trees at a base age (usually 50 or 100 years), puts trees of all ages on a relative basis so that the index number has meaning and comparisons can be made. The lower the index number, regardless of the tree’s current age, the poorer the site; the higher the index number, the better the site.
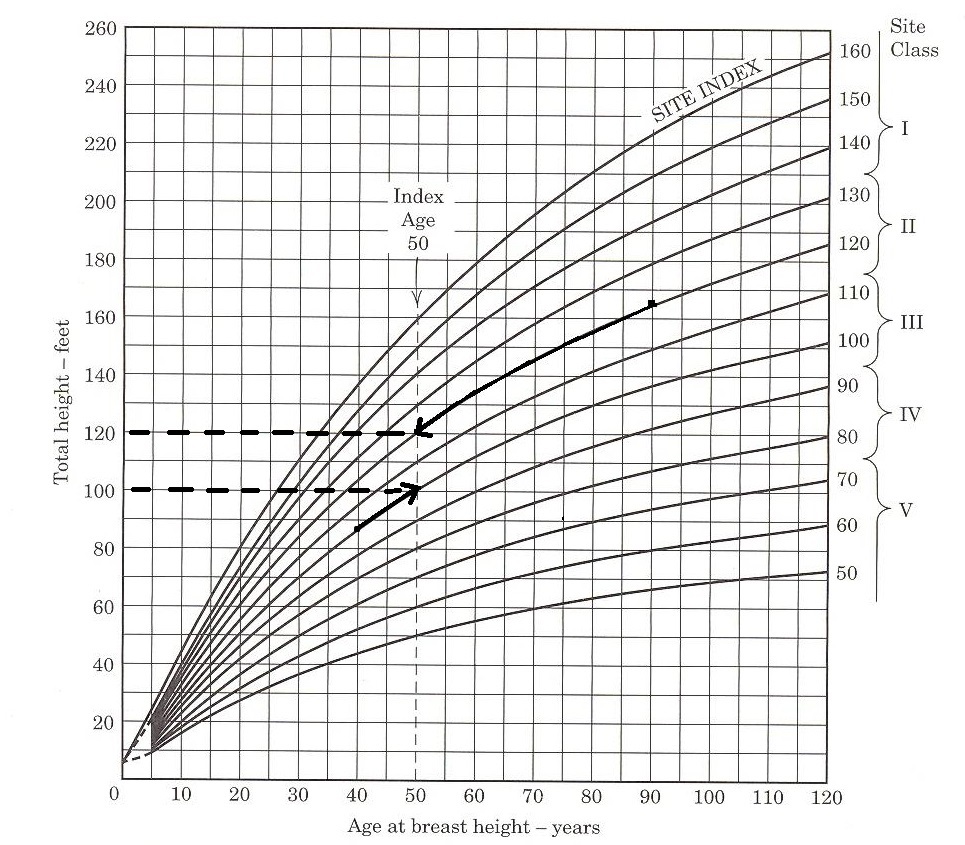
Figure 6.5. Tracing height growth backward (top line) or forward (bottom line) to reach age 50. (From Smith et al. 1997.)