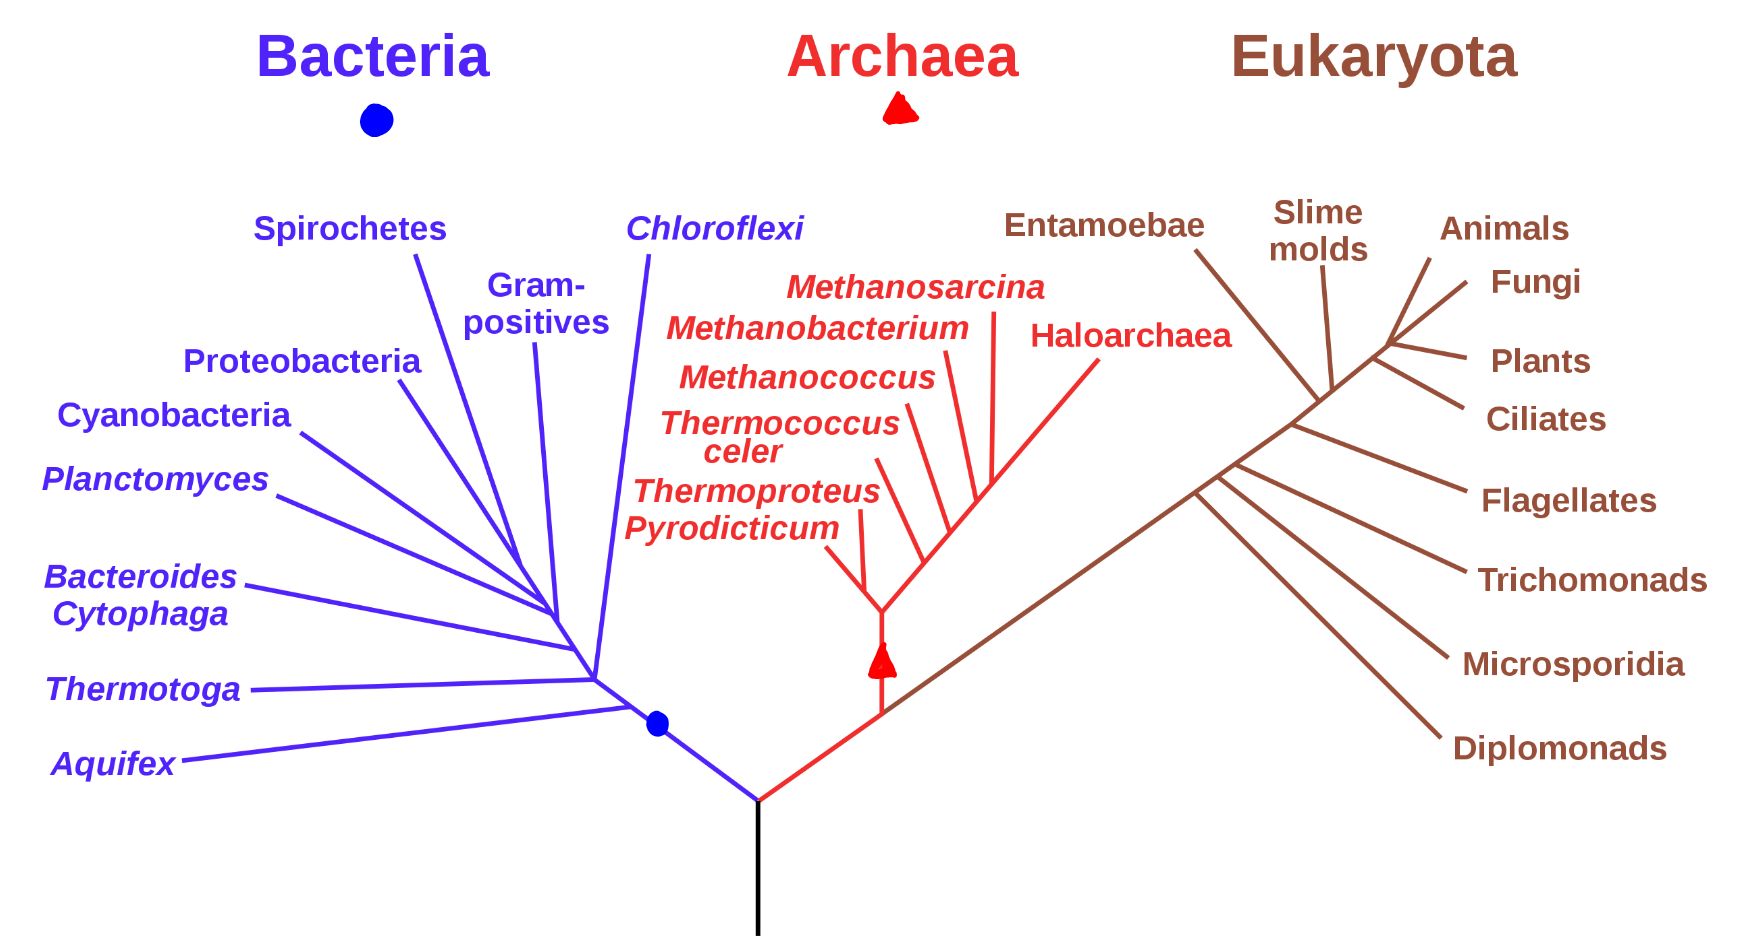
As of the 1970's, life has been classified into three domains: Bacteria, Archaea, and Eukarya (shown in Figure \(\PageIndex{1}\) as Eukaryota). All known life on Earth is thought to have descended from a single common ancestor: LUCA (last universal common ancestor). The relationship between the three domains of life is depicted in the phylogenetic tree below. This diagram represents Archaea and Eukarya as sister taxa, more closely related than either group is to Domain Bacteria.
Figure \(\PageIndex{1}\): "A phylogenetic tree of living things, based on RNA data and proposed by Carl Woese, showing the separation of bacteria, archaea, and eukaryotes. Trees constructed with other genes are generally similar, although they may place some early-branching groups very differently, thanks to long branch attraction. The exact relationships of the three domains are still being debated, as is the position of the root of the tree. It has also been suggested that due to lateral gene transfer, a tree may not be the best representation of the genetic relationships of all organisms. For instance some genetic evidence suggests that eukaryotes evolved from the union of some bacteria and archaea (one becoming an organelle and the other the main cell)." This vector version produced in 2006: Eric Gaba (Sting, fr:Sting), Cherkash, Public domain, via Wikimedia Commons.
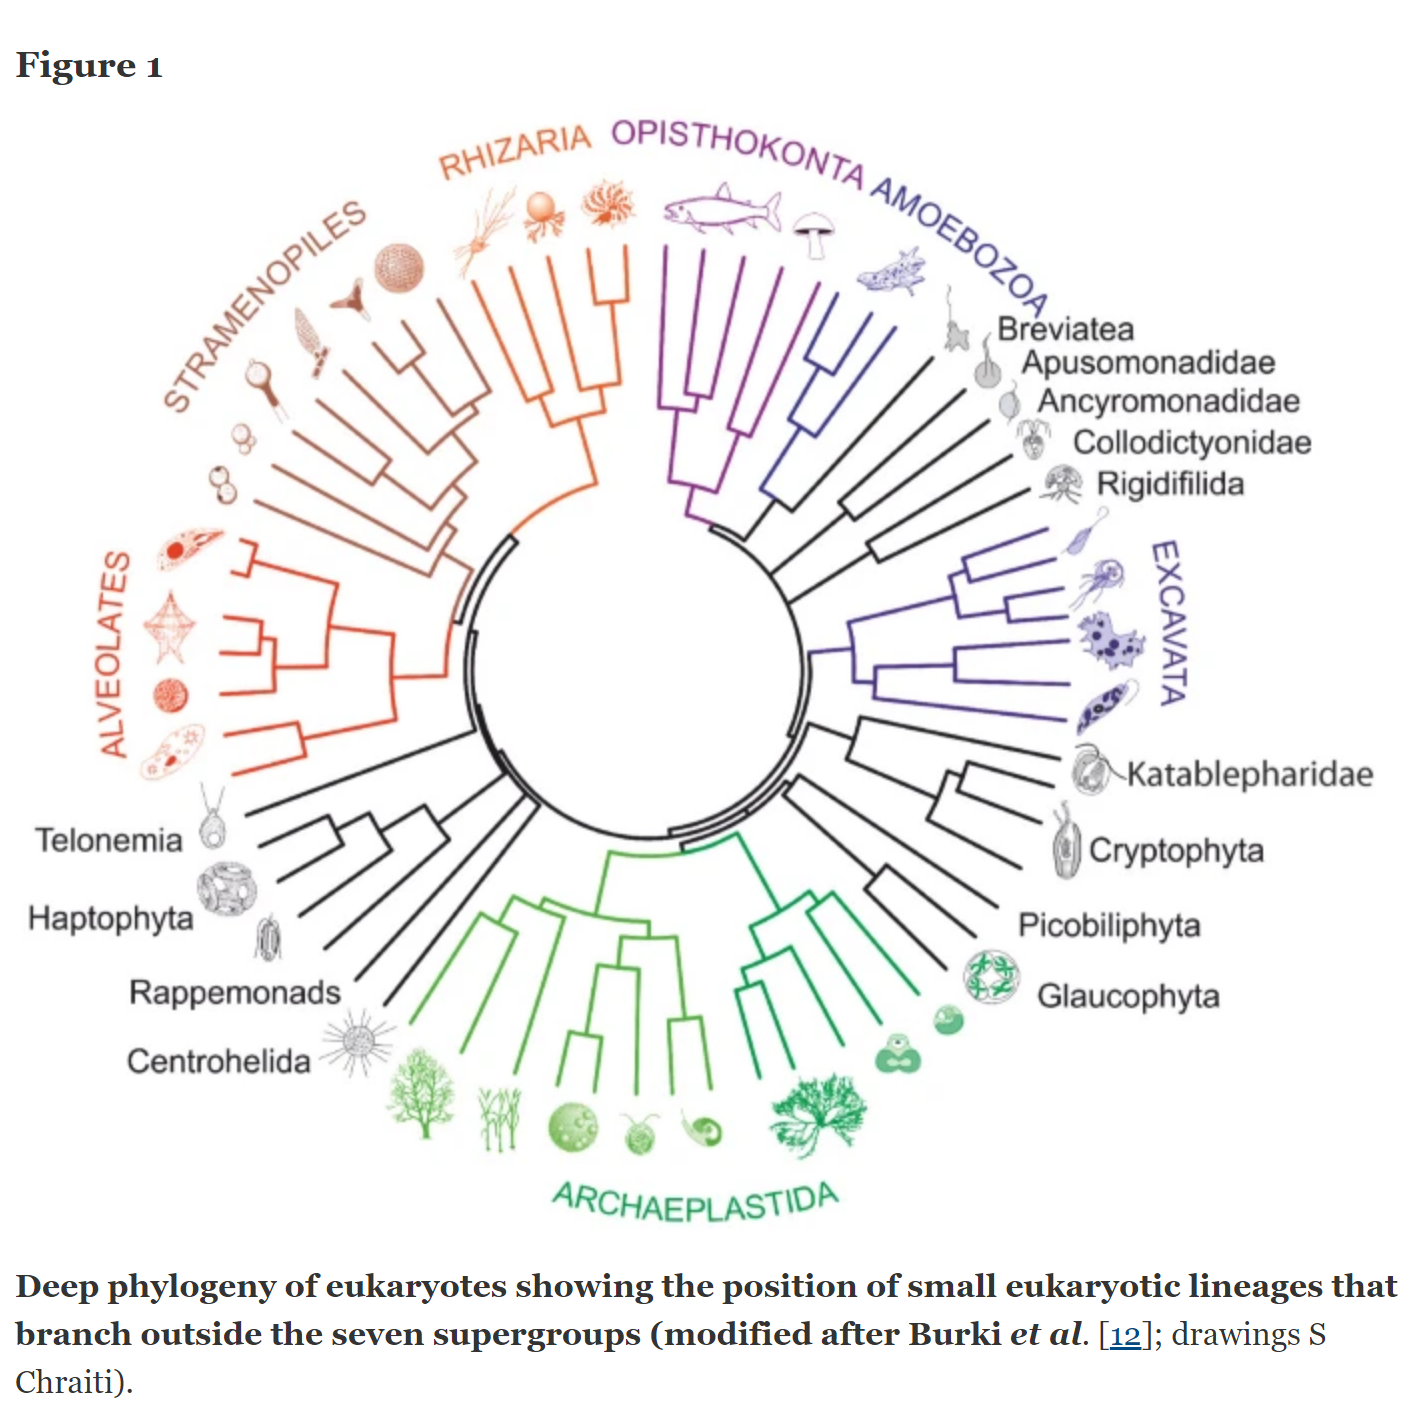
Relationships Within Eukarya
Depicting Relationships
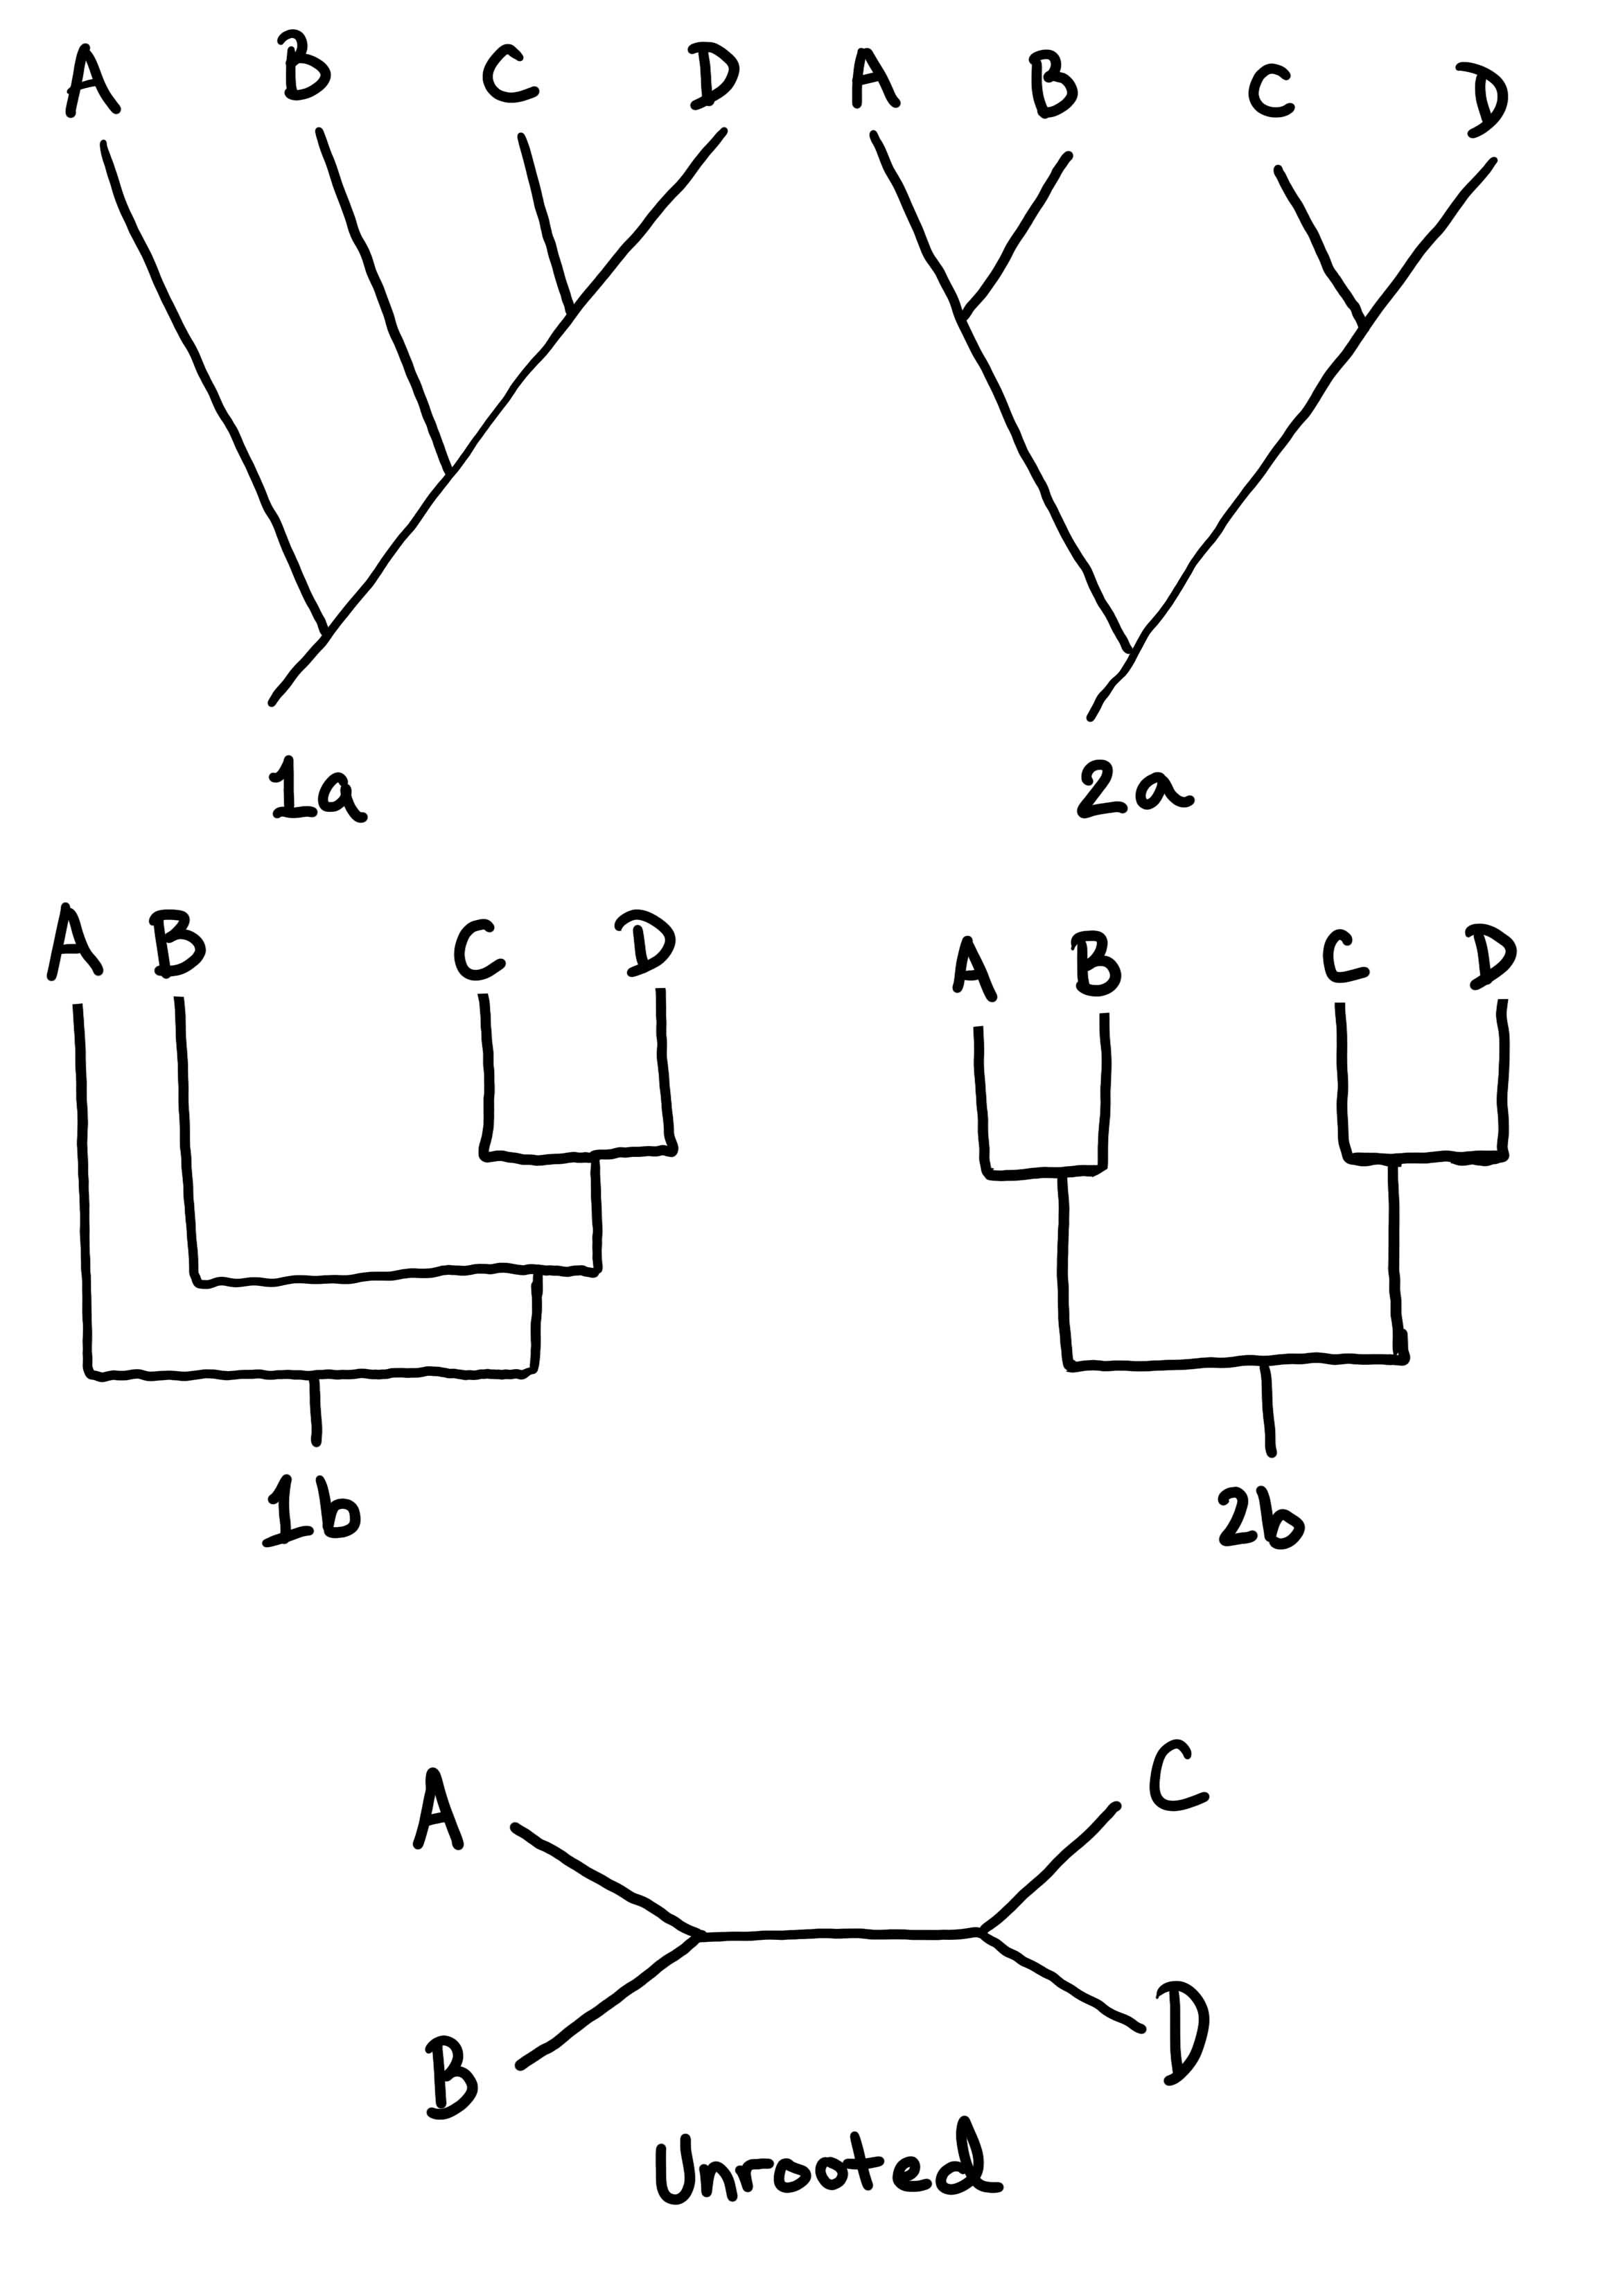
Branching tree diagrams (like the phylogenies shown above) are used to communicate a hypothesis for how organisms are related. In Figure \(\PageIndex{3}\) and Figure \(\PageIndex{4}\), some example trees are drawn to show how this works.
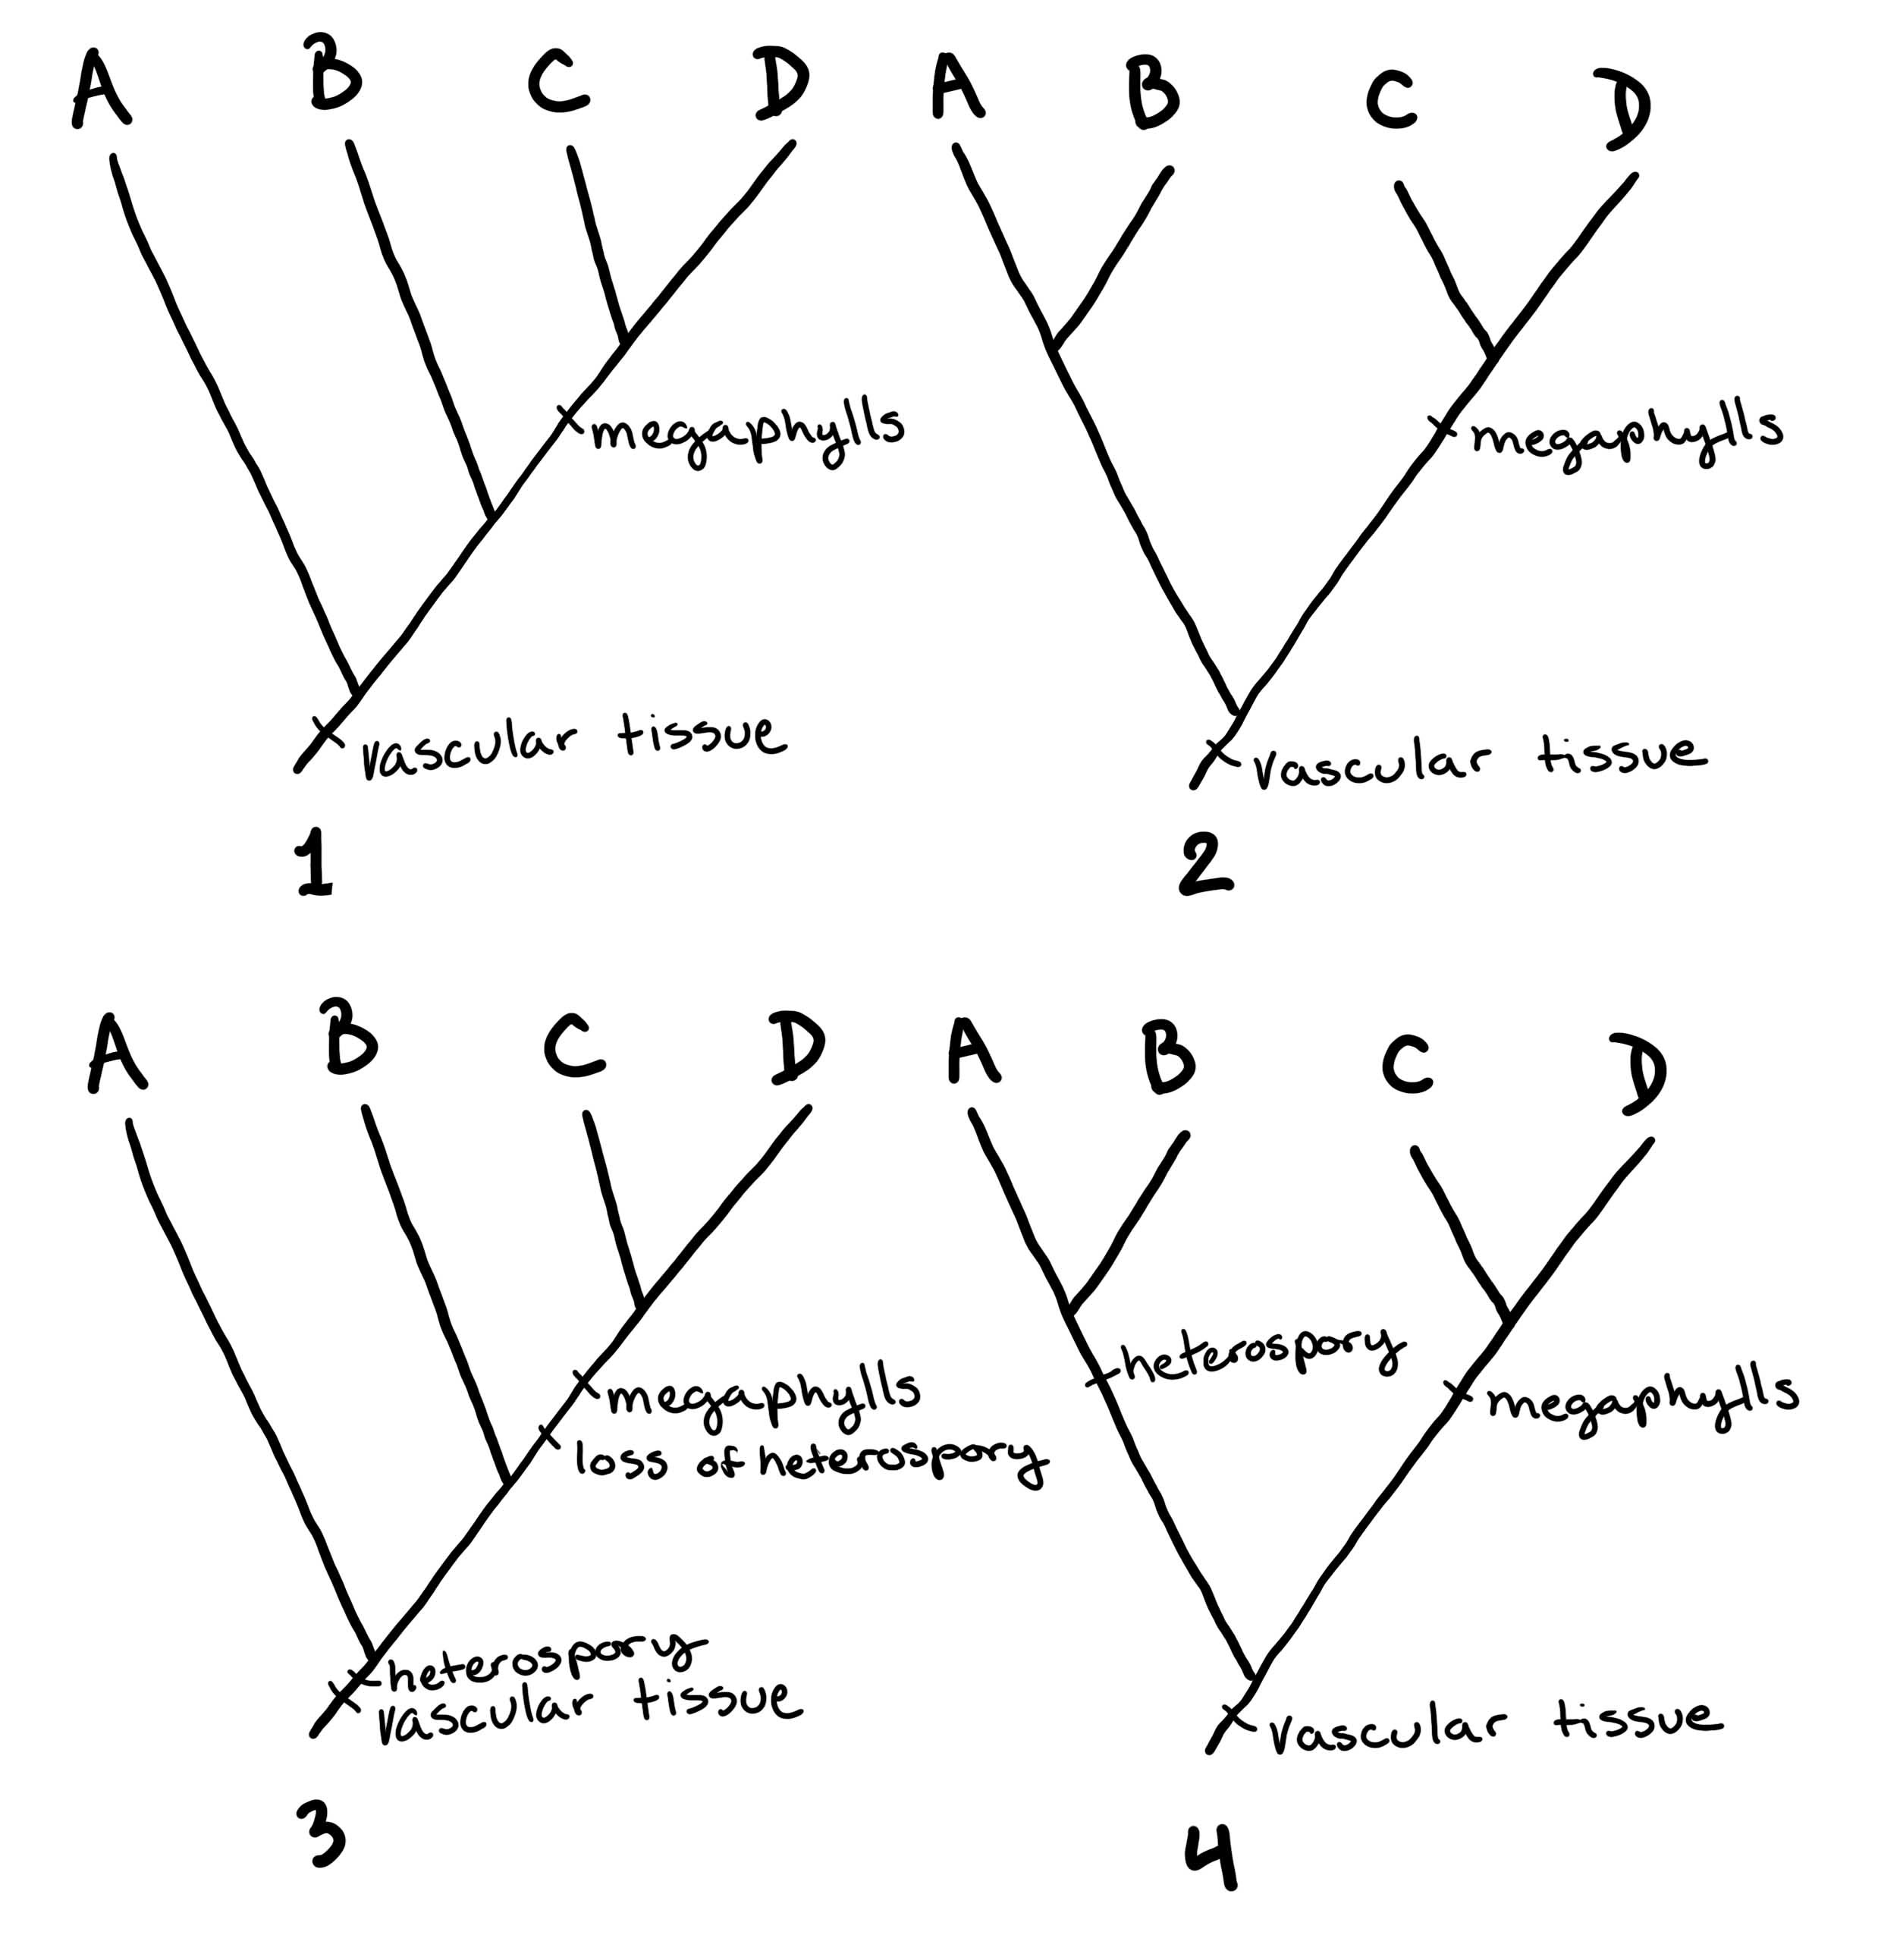
Figure \(\PageIndex{3}\): These diagrams (cladograms) show hypotheses for four different taxa: A, B, C, and D. These taxa could represent individuals, different species, or any other level of classification. Trees 1a and 1b are drawn differently but represent the same hypothesis: C and D are most closely related (sister taxa) and A is the most ancestral lineage. Trees 2a and 2b represent a slightly different hypothesis: C and D are sister taxa, but A and B are also sister taxa; neither lineage is depicted as "older" than the other. This last relationship is also represented in the "Unrooted" tree: there is no hypothesis in this tree for which group is most ancestral (no "root"). Images drawn by Maria Morrow, CC-BY.Figure \(\PageIndex{4}\): In these four trees, we are again looking at hypotheses for how A, B, C, and D are related. However, in these trees we have some information about why these determinations were made: traits have been included. In trees 1 and 2, vascular tissue and megaphylls have been added to the two different hypotheses presented in Figure \(\PageIndex{3}\). Vascular tissue appears on the root of the trees as an ancestral trait. This means that A, B, C, and D all have vascular tissue. Megaphylls appears in both trees as a shared derived characteristic (synapomorphy) of C and D. This means C and D have megaphylls, but A and B do not. Both tree 1 and tree 2 are equally parsimonious. In trees 3 and 4, a third trait has been added: heterospory. In addition to the information from trees 1 & 2, we now see that A and B are heterosporous, while C and D are not. In tree 3, heterospory appears as an ancestral trait which is lost in C and D. In tree 4, heterospory is a synapomorphy of A and B. Tree 3 has four changes, while tree 4 only has three. This means that tree 4 is more parsimonious and therefore more likely (though not necessarily correct!). Images drawn by Maria Morrow, CC-BY.
Genetic Information as Traits
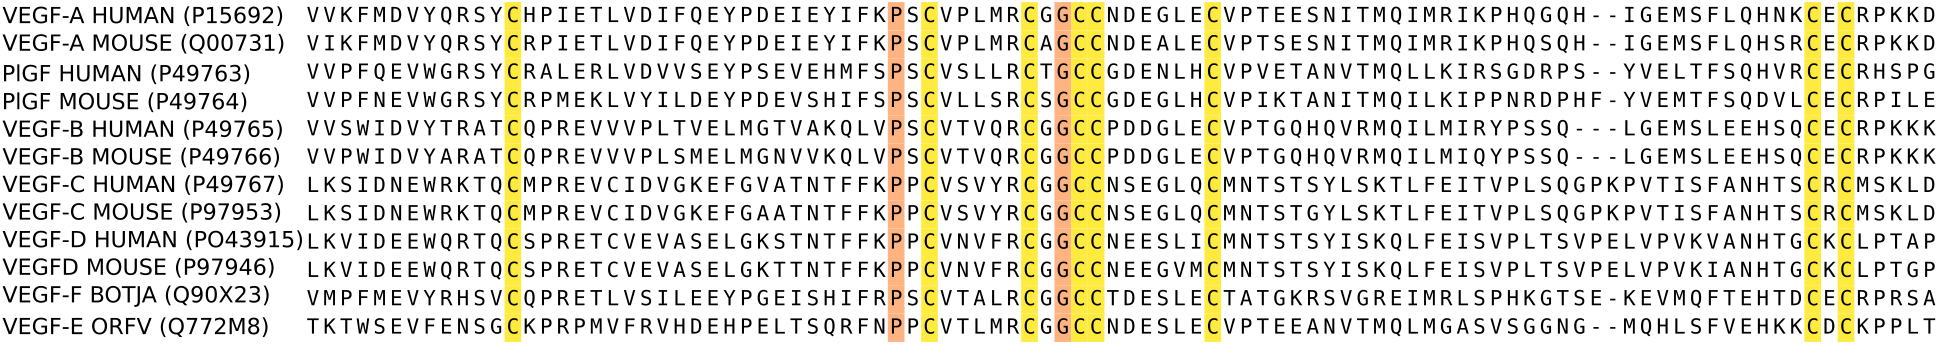
Figure \(\PageIndex{4}\): This image shows amino acid sequences for the same protein (VEGF) in humans and mice. The sequences have been aligned to find similarities and differences. The bars across the sequences show amino acids that are unchanged across the organisms tested. These positions are considered shared ancestral characteristics. At all other locations, there may be differences in the amino acids between organisms. We can use these as synapomorphies to build a tree, assuming that organisms who share more similar sequences are more closely related. This information has revolutionized the way phylogenies are built. "Alignment of the VEGF Homology Domain of representative VEGFs (all mammalian VEGFs from human and mouse plus one VEGF-E (viral) and one VEGF-F (snake venom)" Mjeltsch, CC BY-SA, via Wikimedia Commons.