
5.5: Stand Growth and Development Over Time
- Page ID
- 20271

5.5 Stand Growth and Development Over Time
In addition to giving us a snapshot of current stand conditions, stand exams can also provide clues to stand development over time if conducted periodically on the same site. Tree density, species composition, crown class distinctions and live crown ratios are all interwoven, and their relationships evolve over time to paint a picture of stand development. Although this is the subject of future ecology and silviculture classes, a brief introduction here will give you a better understanding of the crown dynamics you observe as you are measuring in the forest.
Evenaged stands typically originate after large-scale disturbances occur on a site – wildfire, harvesting, windthrow, etc. Resulting forest development tends to follow a pattern of progression through four or more identifiable stages as described by Oliver and Larson (1996):
Stand initiation or open shrub stage: the open condition after disturbance allows colonization by a variety of plants. Forest floor herbs, shrubs and seedlings may have survived the disturbance, as well as new individuals and pioneer species that appear over a period of several years. This is generally a period of diverse species composition. Planted seedlings are part of this stage (Figure 5.9A below).
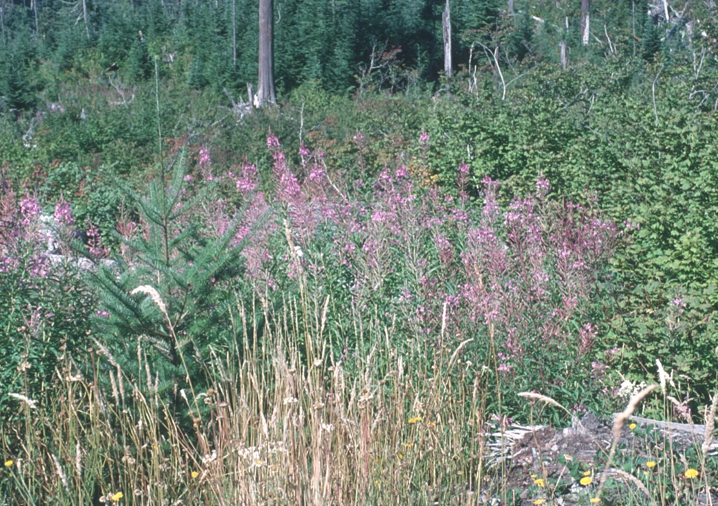
Figure 5.9A. The open shrub stage is dominated by shrubs, grasses, and seedlings.
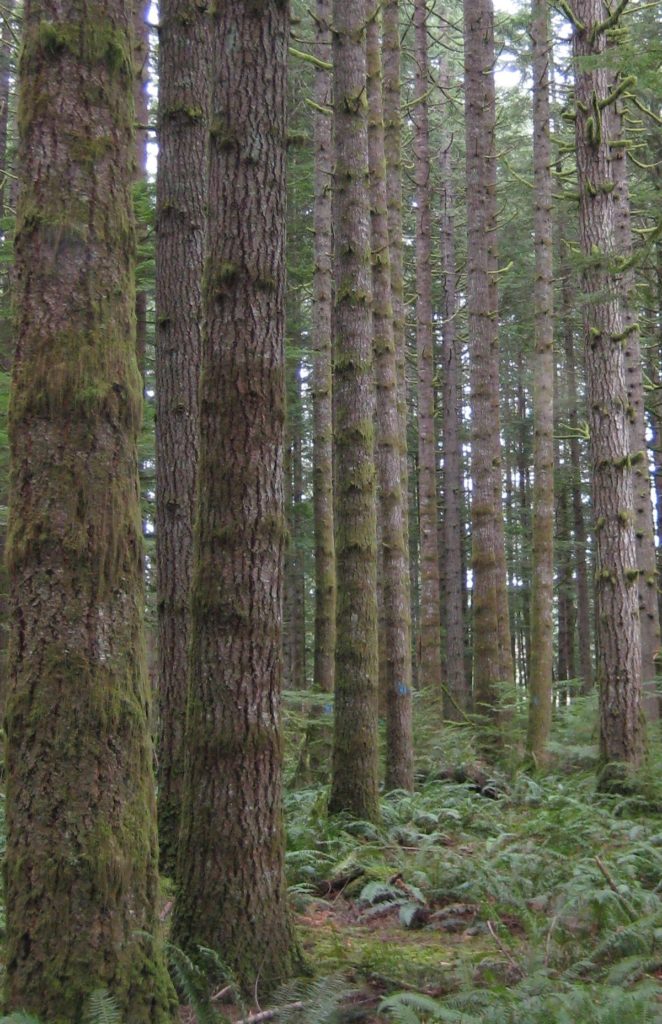
Figure 5.9B. The stem exclusion stage is typified by low levels of understory vegetation.
Stem exclusion stage: crown closure occurs as tree crowns touch and available growing space is occupied. Overstory competition for light and growing space intensifies, and roots compete for soil moisture and nutrients. Some species die out and understory seedlings become scarce. This is generally a period of low biodiversity (Figure 5.9B).
Understory reinitiation stage: small gaps of light in the canopy are created by breakage or death of individual trees – those lost to suppression, pests, windthrow, etc. This creates an opportunity for new species or individuals to establish in the understory, or for shade tolerant saplings already established in the understory to grow quickly into the gap. This stage generally contains more plant and animal species than the stem exclusion stage, but fewer than the stand initiation stage (Figure 5.9C).
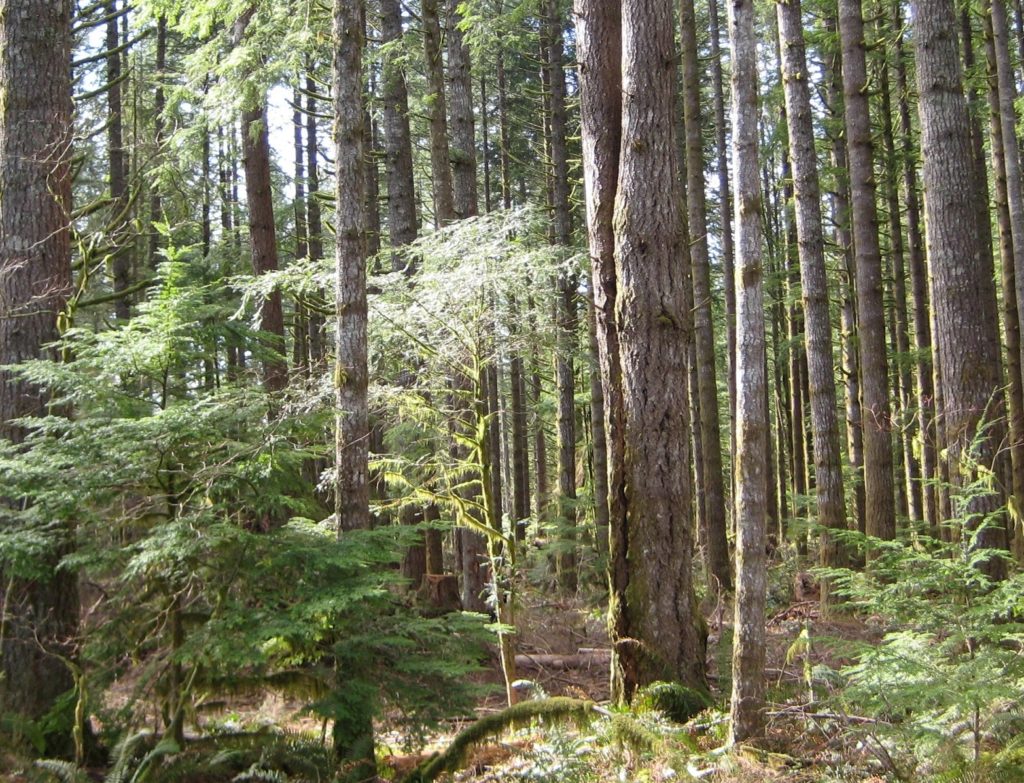
Figure 5.9C. In the understory reinitiation stage, saplings occupy pockets of light that develop in the understory.
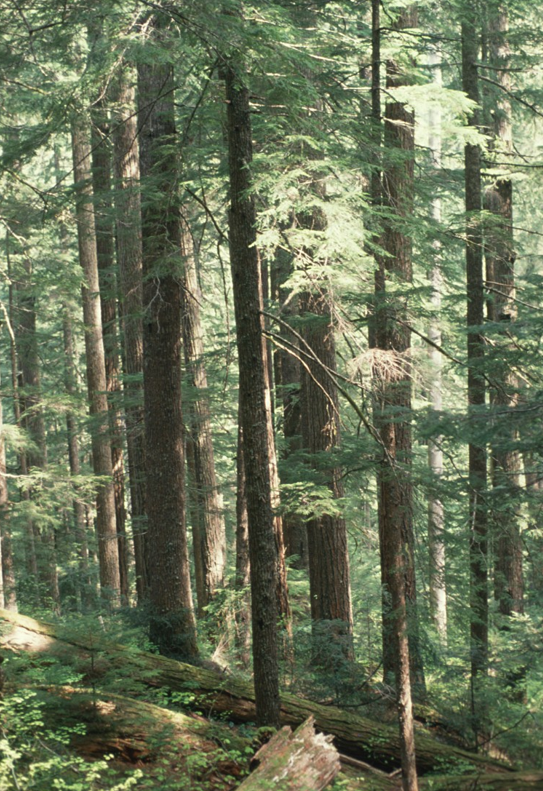
Figure 5.9D. The old growth/complex stage is multistoried with woody debris on the ground.
Old-growth stage: large overstory trees are replaced by younger understory trees. As the original cohort making up the crown gradually dies, very large gaps allow the trees in the lower forest layers to grow into the canopy. This happens in an irregular fashion, so a multilayered structure emerges. This is the stage of the greatest structural diversity, and is complemented by high species diversity (Figure 5.9D).
During all stages of stand development, plants are competing for light, nutrients, water, and growing space. Different species have different strategies for maximizing their ability to accumulate these resources, but the reality is clear; there is only so much to go around. During the stand initiation or open shrub stage, the forest may be dominated by herbs, shrubs and small seedlings. During this time, shrubs may grow the fastest, often outcompeting trees for sunlight. Seedlings overtopped by shrubs will die out, but the trees that grow taller than the shrubs begin to dominate the light source. As they fill out their crowns and get big enough to touch each other, crown closure occurs. Trees generally have high LCR’s and nearly all occupy dominant crown classes as the stand enters the stem exclusion stage. Competition between trees for light becomes particularly intense during this stage, as nearly all the crowns are about the same height and size. Light to the understory is drastically reduced, as evidenced by the limited number and abundance of understory plants.
As trees continue to grow, they require more physical space for branch and crown expansion, and differentiation into crown classes becomes evident. The healthiest trees, able to grow faster and occupy more space, become the dominant trees. Slower growing trees become codominant, and inferior trees lag behind, creating the intermediate crown classes. These trends become more and more pronounced with time. Large dominants remain dominant, while those that are not as competitive become codominant as their LCR’s shrink. Some codominants are outcompeted and become intermediates, while the weakest trees become suppressed and eventually die. This is called self-thinning, and continues throughout the life of the stand as the trees get larger and larger (Figure 5.10). Thus, an area initially supporting 600 seedlings per acre may only support 200 trees per acre when they reach 50 years, or 30 trees per acre by the time they reach old-growth.
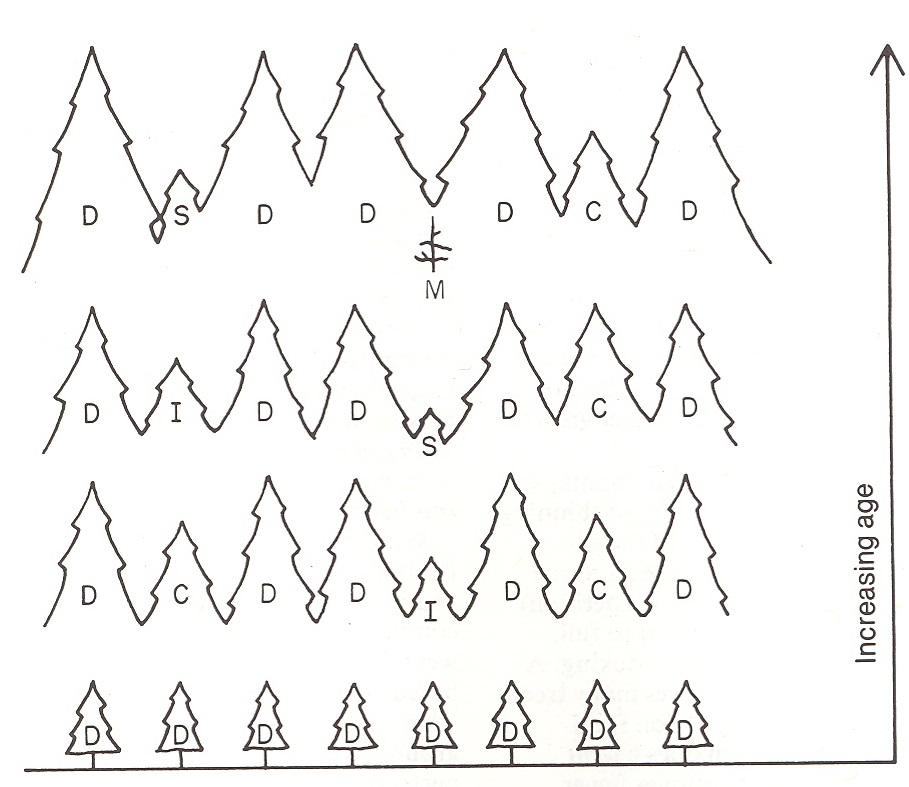
Figure 5.10. Trees differentiate into crown classes with time, as competition for growing space increases. (Emmingham and Elwood 1993)
A direct relationship exists between a tree’s diameter and its leaf biomass. The greater the volume of space a crown occupies, the more foliage a tree can support, and the more light it can capture. The more sugar it produces from those leaves, the more energy it has available for growth and the more wood it can produce each year. On the other hand, the smaller a tree’s crown is, the less space it has for foliage, and the smaller its growth rings will be. Thus we arrive at the diameter distribution in Figure 4-5. There is a range of diameters from 6”-36”, even though all trees are in the same canopy layer or cohort. Subordinate crown classes in the overstory with low LCR’s account for the small diameter trees, and dominant trees make up the larger diameter classes.
A fascinating exercise that demonstrates the interrelationships among neighboring trees as they compete for light and growing space over time, is to chart individual tree diameter growth from increment core samples. The growth rings reflect individual tree crown expansion, and can help explain why some trees become dominant, while others are classified as intermediate.
The illustration below shows diameter growth of four Douglas-fir trees growing side by side in an evenaged stand (Figure 5.11). Cores were taken at dbh, so no data are available to chart how many years it took each tree to reach dbh or which year each tree germinated and began to grow. But as you can see, the tree classified as intermediate (Tree10), appears to be about 10 years younger than the other three trees, and although its growth rates are on par with the other trees for the first 15 years, its curve flattens off after 1973, revealing its inability to capture much crown space, even though it occupies the same canopy layer as the larger trees. (This tree illustrates why even-layered is not necessarily evenaged, and why the term “cohort” rather than “age class” is preferred by some when discussing forest structural layers.) The dominant tree (Tree 11) maintains its high growth rate throughout its lifespan, and really pulls away from the other trees after 1983. The codominants (Trees 14 and15) display early growth equal to dominant Tree 11, then taper off over the last 25-30 years. It is likely that the stem exclusion stage began around 1968, and the effects of the more intense competition for light and growing space become evident over the following 5 -10 years.
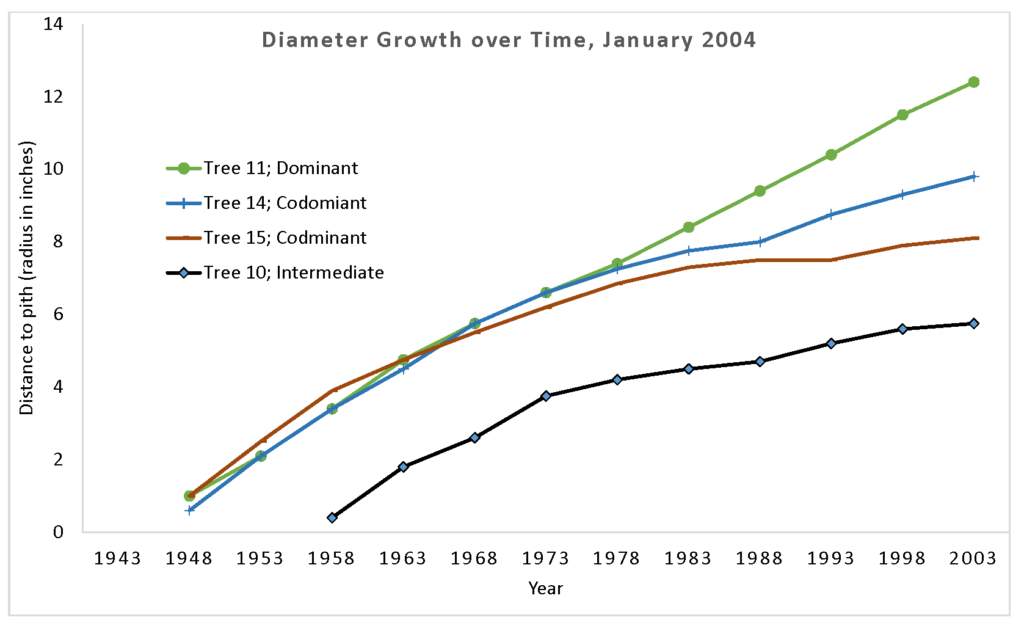
Figure 5.11. Diameter growth of four neighboring trees over time, taken from core samples. Data collected in an evenaged stand on a west slope by MHCC Forest Measurements I students January 2004.
There are two interesting sidelights to observe with the codominant trees. Look at Tree 14. Its growth is similar to dominant Tree 11 until a sharp decline starts in 1968. Was there an event between 1968 and 1973 that would have resulted in a sudden loss of growth during that period? Many trees in this stand showed crooks in the trunks at about the same height, indicating that perhaps the 1969 ice storm caused top breakage in the stand. However, the last 15 years show that this tree has recovered, and is again displaying fairly rapid growth. Codominant Tree 15 on the other hand, shows a gradual slowdown and relatively flat growth rate since 1983. Does this indicate lower vigor? Will this tree ultimately become an intermediate tree as the surrounding stronger trees garner more and more light and growing space? At this point, it certainly appears that it is losing ground to the other trees. It is amazing what you can learn from four cores samples!