
6.6: Use of PC and internet for biochemical research
- Page ID
- 18159

There are a variety of resources on the web related to biochemical research. These resources typically include general categories of:
- Databases of information
- Software for analysis of data
- Software for graphing and representing data
- Published reports and reviews (literature)
Databases of information
There are numerous repositories of information related to biological molecules and biochemistry. A few of these (along with some sample links) include:
- Databases of nucleic acid sequences, including commonly used plasmids.
The Entrez Nucleotide Database
New England Biolabs ™ Database of vectors and plasmids
- Protein sequence databases
Protein sequence database (Protein Information Resource)
Swiss-Prot knowledge database
- Protein structure database
The Protein Databank (PDB)
- Nucleic acid structure database
- Protein stability and thermodynamic database
Protherm Database
- Protein 2-D gel electrophoresis databases (proteomics)
EXPASY 2-D PAGE links
Software for analysis of data
Software can either be run on a local machine (i.e. your PC on your desktop), or on a server over the web. Sometimes, it is a combination of the two (i.e a Java™ applet that is served on a host machine, but requires Java software installed on your PC.
In general terms, if your data is expected to follow a particular mathematical model (e.g. Michaelis-Menten kinetics) then you needgeneral-purpose curve-fitting software. Links to non-linear least-square fit software include:
Datafit™ from Oakdale Engineering
LSM Least Squares Method curve fitting
Programs such as these allow you to simple write an equation, input your experimental values, and then the parameters of the equation (i.e. model) will be refined to give the best fit to the data. Thus, a single program can be used for a variety of applications (i.e. any situation where an equation is available that describes the behavior of the data)
Special purpose programs are available for specific applications.
Software for graphing and presenting data
In distinction to software for analysis (although sometimes combined in the same package) is software for graphing and representing data. The subtle point here is that after the data has been analyzed, you may need to prepare a report to communicate the results. In this case, there are other issues of data presentation - i.e. colors, line thicknesses, arrow styles, axis-breaks, fonts, legends, etc. that may need to be fussed with. Basic fitting software often does not include extensive presentation tools, and similarly, presentation software often does not have robust and general purpose fitting tools. Examples of graphing and presentation software for scientific data are:
Origin™ from MicroCal™
KaleidaGraph from Synergy Software™
SigmaPlot™ from SPSS, Inc.
In addition to graphic representation of experimental data, some forms of data require three-dimensional representations. For example, biomolecular structures (e.g. RNA, DNA and protein molecules) are stored in databases (e.g. PDB) as a series of atomic coordinates, however, the data only really makes sense if you can convert such data into a representation of a three-dimensional molecule. Furthermore, understanding the structural information is possible by manipulation of such representations (e.g. rotations, translations, zooming in/out, etc.). Software for such manipulations includes:
Swiss PDB viewer
DS Viewer™ from Accelrys
O
Furthermore, publication of figures of molecular structures often necessitate artistic embellishments - such as raytracing, shading, etc. The above programs can often output their figures in POV format, which allows such modifications using the following:
Literature databases
Scientific reports are published in various journals, meeting proceedings, and various books. Search engines are available to search electronic repositories of these materials. PubMed, a service of the National Library of Medicine, includes over 14 million citations for biomedical articles back to the 1950's. These citations are from MEDLINE and additional life science journals. PubMedincludes links to many sites providing full text articles and other related resources.
Here is a link to PubMed™
Additionally, it is also useful to be able to easily download, maintain, and format such references in papers or manuscripts that you have to prepare. Bibliography software allows you to do this quite easily. Examples of such software include ProCite, Reference Manager and Endnote (all from ISI ResearchSoft:
Endnote™ from ISI ResearchSoft™
Understanding DNA sequence information files
When requesting DNA sequence information there is a lot of additional information that is included in the file - in addition to the actual sequence. Here is an example of part of the file for the sequence of the plasmid pUC19:
Plasmid pUC19
Update 6/5/02
Features:
469- 146 lacZ alpha CDS (start 469, complementary strand)
519- 514 Plac promoter -10 sequence (TATGTT)
543- 538 Plac promoter -35 sequence (TTTACA)
575- 563 CAP protein binding site
396- 452 multiple cloning site (EcoRI-HindIII)
1455- 867 origin of replication (counterclockwise)
(RNAII -35 to RNA/DNA switch point):
1273-1278 RNAI transcript promoter -35 sequence (TTGAAG)
1295-1300 RNAI transcript promoter -10 sequence (GCTACA)
1309-1416 RNAI transcript
1419- 867 RNAII transcript (complementary strand)
1434-1429 RNAII transcript promoter -10 sequence (CGTAAT)
1455-1450 RNAII transcript promoter -35 sequence (TTGAGA)
2486-1626 beta-lactamase (bla; amp-r) CDS
(start 2486, complementary strand)
2486-2418 beta-lactamase signal peptide CDS
(start 2486, complementary strand)
2521 bla RNA transcript start (complementary strand)
2535-2530 bla promoter -10 sequence (GAGACA)
2556-2551 bla promoter -35 sequence (TTCAAA)
puc19.seq Length: 2686 June 5, 2002 13:46 Type: N Check: 4141 ..
1 TCGCGCGTTT CGGTGATGAC GGTGAAAACC TCTGACACAT GCAGCTCCCG
51 GAGACGGTCA CAGCTTGTCT GTAAGCGGAT GCCGGGAGCA GACAAGCCCG
101 TCAGGGCGCG TCAGCGGGTG TTGGCGGGTG TCGGGGCTGG CTTAACTATG
151 CGGCATCAGA GCAGATTGTA CTGAGAGTGC ACCATATGCG GTGTGAAATA
The actual DNA sequence starts towards the bottom of this file (it is truncated because it goes on for about 3000 bases). The start of the file is called the "header" and provides notes about features of the DNA sequence. For example, nucleotide bases 867 - 1455 comprise an origin of replication. It is listed as 1455 - 867 to communicate that the orientation of this "ori" is actually counterclockwise around the plasmid (plasmids are circular). There also is a gene for b-lactamase (bla; which provides for ampicillin resistance, or ampR selectable marker) that runs from basepair 1626 to 2486. It is also counterclockwise. Furthermore, the promoter for transcribing this gene is located from basepairs 2551 - 2521 (i.e. just "upstream" of the bla gene). The vector looks like this:
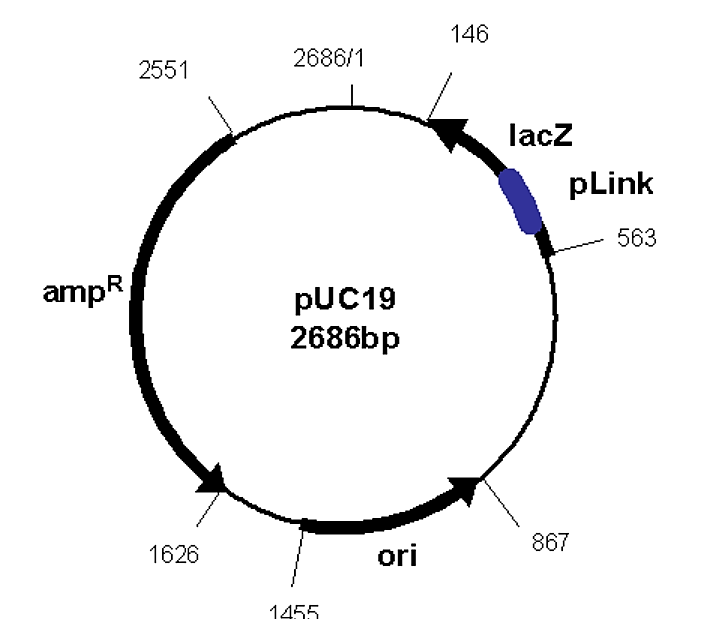.png?revision=1&size=bestfit&width=325&height=281)
Figure 6.6.1: pUC Vector
The "start" of the sequence is basepair number 1, and is oriented at 12:00 (straight up). The sequence then runs clockwise around the plasmid. The plasmid diagram will use arrows to indicate the locations of the various features of the DNA, and the basepair numbers associated with the start and end locations of such features is also typically given on such figures.