
27.1: Regulation of Gene Expression in Bacteria
- Page ID
- 15206


Introduction
Each nucleated cell in a multicellular organism contains copies of the same DNA. Similarly, all cells in two pure bacterial cultures inoculated from the same starting colony contain the same DNA, except for changes that arise from spontaneous mutations. If each cell in a multicellular organism has the same DNA, then how is it that cells in different parts of the organism’s body exhibit different characteristics? Similarly, how is it that the same bacterial cells within two pure cultures exposed to different environmental conditions can exhibit different phenotypes? In both cases, each genetically identical cell does not turn on, or express, the same set of genes. Only a subset of proteins in a cell at a given time is expressed.
Genomic DNA contains both structural genes, which encode products that serve as cellular structures or enzymes, and regulatory genes, which encode products that regulate gene expression. The expression of a gene is a highly regulated process. Whereas regulating gene expression in multicellular organisms allows for cellular differentiation, in single-celled organisms like prokaryotes, it primarily ensures that a cell’s resources are not wasted making proteins that the cell does not need at that time.
Elucidating the mechanisms controlling gene expression is important to the understanding of human health. Malfunctions in this process in humans lead to the development of cancer and other diseases. Understanding the interaction between the gene expression of a pathogen and that of its human host is important for the understanding of a particular infectious disease. Gene regulation involves a complex web of interactions within a given cell among signals from the cell’s environment, signaling molecules within the cell, and the cell’s DNA. These interactions lead to the expression of some genes and the suppression of others, depending on circumstances.
Prokaryotes and eukaryotes share some similarities in their mechanisms to regulate gene expression; however, gene expression in eukaryotes is more complicated because of the temporal and spatial separation between the processes of transcription and translation. Thus, although most regulation of gene expression occurs through transcriptional control in prokaryotes, regulation of gene expression in eukaryotes occurs at the transcriptional level and post-transcriptionally (after the primary transcript has been made).
In bacteria and archaea, structural proteins with related functions are usually encoded together within the genome in a block called an operon and are transcribed together under the control of a single promoter, resulting in the formation of a polycistronic transcript, as shown in Figure \(\PageIndex{1}\). In this way, regulation of the transcription of all of the structural genes encoding the enzymes that catalyze the many steps in a single biochemical pathway can be controlled simultaneously, because they will either all be needed at the same time, or none will be needed. For example, in E. coli, all of the structural genes that encode enzymes needed to use lactose as an energy source are encoded next to each other in the lactose (or lac) operon under the control of a single promoter, the lac promoter. French scientists François Jacob (1920–2013) and Jacques Monod at the Pasteur Institute were the first to show the organization of bacterial genes into operons, through their studies on the lac operon of E. coli. For this work, they won the Nobel Prize in Physiology or Medicine in 1965.
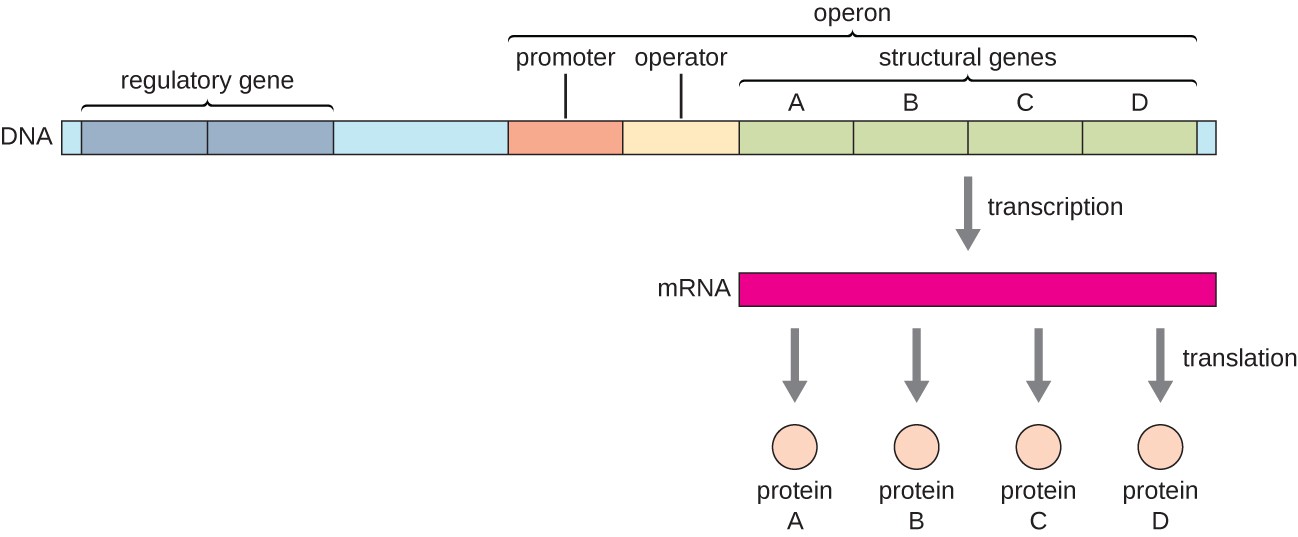
Each operon includes DNA sequences that influence its own transcription; these are located in a region called the regulatory region. The regulatory region includes the promoter and the region surrounding the promoter, to which transcription factors, proteins encoded by regulatory genes, can bind. Transcription factors influence the binding of RNA polymerase to the promoter and allow its progression to transcribe structural genes. A repressor is a transcription factor that suppresses the transcription of a gene in response to an external stimulus by binding to a DNA sequence within the regulatory region called the operator, which is located between the RNA polymerase binding site of the promoter and the transcriptional start site of the first structural gene. Repressor binding physically blocks RNA polymerase from transcribing structural genes. Conversely, an activator is a transcription factor that increases the transcription of a gene in response to an external stimulus by facilitating RNA polymerase binding to the promoter. An inducer, a third type of regulatory molecule, is a small molecule that either activates or represses transcription by interacting with a repressor or an activator.
In prokaryotes, there are examples of operons whose gene products are required rather consistently and whose expression, therefore, is unregulated. Such operons are constitutively expressed, meaning they are transcribed and translated continuously to provide the cell with constant intermediate levels of the protein products. Such genes encode enzymes involved in housekeeping functions required for cellular maintenance, including DNA replication, repair, and expression, as well as enzymes involved in core metabolism. In contrast, other prokaryotic operons are expressed only when needed and are regulated by repressors, activators, and inducers.
Prokaryotic operons are commonly controlled by the binding of repressors to operator regions, thereby preventing the transcription of the structural genes. Such operons are classified as either repressible operons or inducible operons. Repressible operons, like the tryptophan (trp) operon, typically contain genes encoding enzymes required for a biosynthetic pathway. As long as the product of the pathway, like tryptophan, continues to be required by the cell, a repressible operon will continue to be expressed. However, when the product of the biosynthetic pathway begins to accumulate in the cell, removing the need for the cell to continue to make more, the expression of the operon is repressed. Conversely, inducible operons, like the lac operon of E. coli, often contain genes encoding enzymes in a pathway involved in the metabolism of a specific substrate like lactose. These enzymes are only required when that substrate is available, thus expression of the operons is typically induced only in the presence of the substrate.
The trp Operon - A Repressible Operon
E. coli can synthesize tryptophan using enzymes that are encoded by five structural genes located next to each other in the trp operon, as shown in Figure \(\PageIndex{2}\). When environmental tryptophan is low, the operon is turned on. This means that transcription is initiated, the genes are expressed, and tryptophan is synthesized. However, if tryptophan is present in the environment, the trp operon is turned off. Transcription does not occur and tryptophan is not synthesized.
When tryptophan is not present in the cell, the repressor by itself does not bind to the operator; therefore, the operon is active and tryptophan is synthesized. However, when tryptophan accumulates in the cell, two tryptophan molecules bind to the trp repressor molecule, which changes its shape, allowing it to bind to the trp operator. This binding of the active form of the trp repressor to the operator blocks RNA polymerase from transcribing the structural genes, stopping the expression of the operon. Thus, the actual product of the biosynthetic pathway controlled by the operon regulates the expression of the operon.
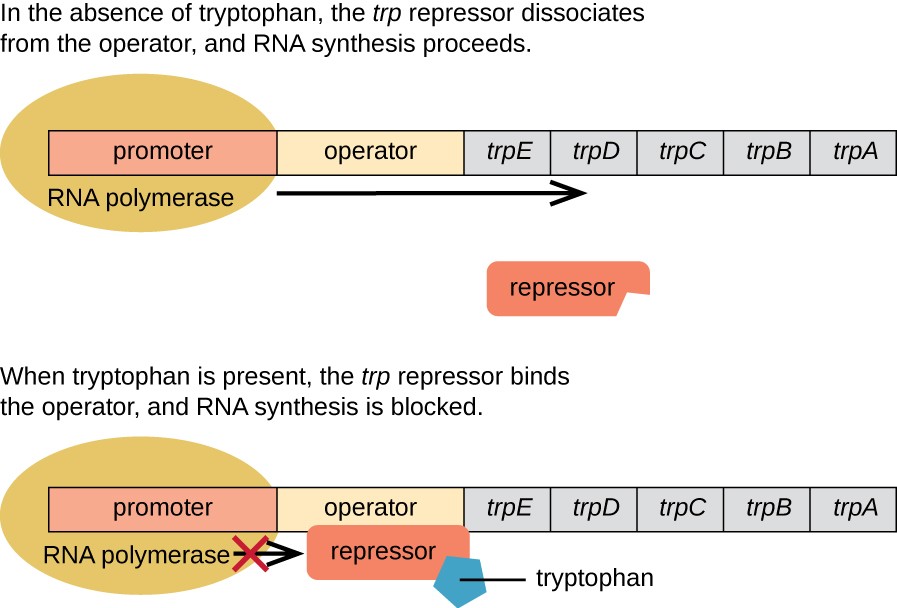
Figure \(\PageIndex{2}\): The Trp Operon. Parker, N., et. al. (2019) Microbiology. Openstax
The five structural genes needed to synthesize tryptophan in E. coli are located next to each other in the trp operon. When tryptophan is absent, the repressor protein does not bind to the operator, and the genes are transcribed. When tryptophan is plentiful, tryptophan binds the repressor protein at the operator sequence. This physically blocks the RNA polymerase from transcribing the tryptophan biosynthesis genes.
Figure \(\PageIndex{3}\) shows an interactive iCn3D model of the E. Coli Trp repressor - operator complex (1TRO).
_.png?revision=1&size=bestfit&width=427&height=331)
The Trp repressor is shown as a dimer with one subunit gray and the other gold. The backbone of the two DNA strands is shown in spacefill magenta and cyan, except where the bases on the major grove interact with the Trp repressor. The tryptophan in each of the proton monomers is shown in spacefill with CPK colors and labeled. Noncovalent interactions (hydrogen bonds and salt bridges) between the protein and DNA are shown with dotted lines. 6 water-mediated hydrogen bonds to phosphate are not shown. Note that there are few H bonds between the protein and base hydrogen bond donors and acceptors, suggesting that the repressor might bind specifically through geometric interactions with the backbone along with the water-mediated hydrogen bonds.
The Lac Operon: An Inducible Operon
The lac operon is an example of an inducible operon that is also subject to activation in the absence of glucose. The lac operon encodes three structural genes, lacZ, lacY, and lacA, necessary to acquire and process the disaccharide lactose from the environment, as shown in Figure \(\PageIndex{4}\).
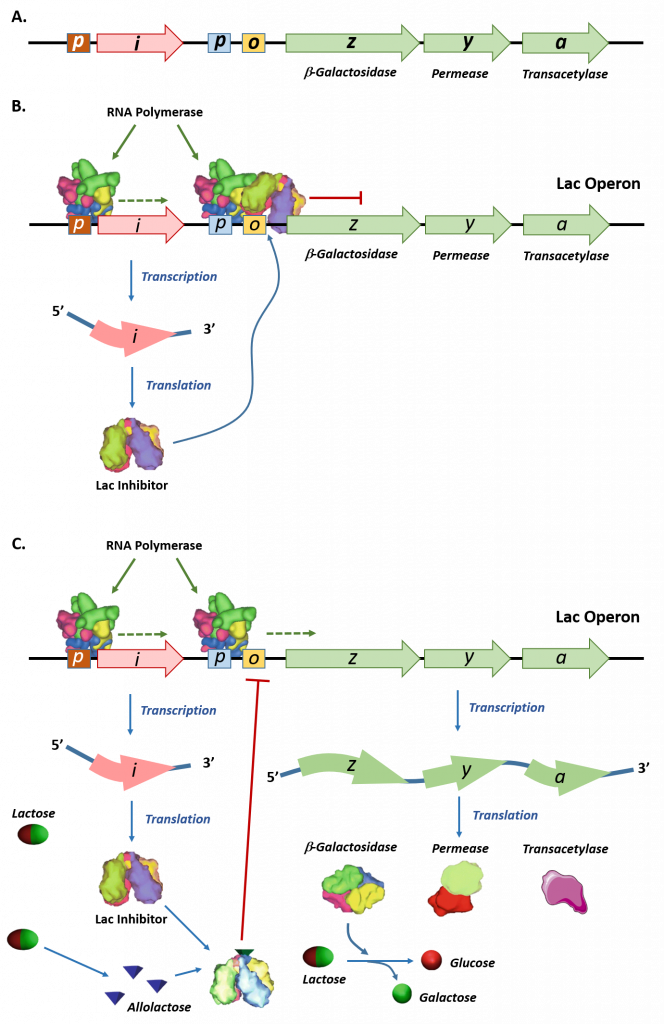
Panel (A) shows a schematic representation of the lac operon in E. coli. The lac operon has three structural genes, lacZ, lacY, and lacA that encode for β-galactosidase, permease, and galactoside acetyltransferase, respectively. The promoter (p) and operator (o) sequences that control the expression of the operon are shown. Upstream of the lac operon is the lac repressor gene, lacI, controlled by the lacI promoter (p).
Panel (B) shows the lac repressor inhibition of the lac operon gene expression in the absence of lactose. The lac repressor binds with the operator sequence of the operon and prevents the RNA polymerase enzyme which is bound to the promoter (p) from initiating transcription.
Panel (C) shows that in the presence of lactose, some of the lactose is converted into allolactose, which binds and inhibits the activity of the lac repressor. The lac repressor-allolactose complex cannot bind with the operator region of the operon, freeing the RNA polymerase and causing the initiation of transcription. Expression of the lac operon genes enables the breakdown and utilization of lactose as a food source within the organism
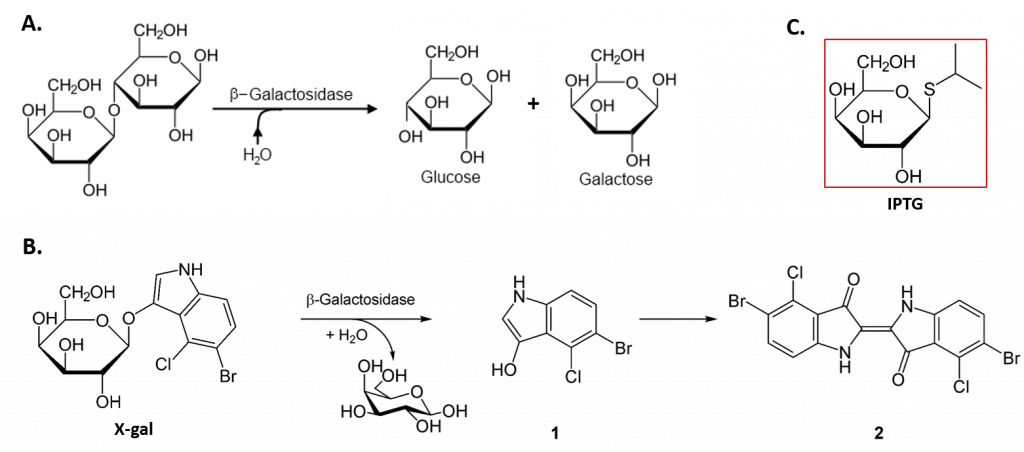
The lacZ gene encodes the β-galactosidase (β-gal) enzyme responsible for the hydrolysis of lactose into simple sugars glucose and galactose, as shown in Figure \(\PageIndex{5}\). The β-gal enzyme can also mediate the breakdown of the alternate substrate 5-bromo-4-chloro-3-indolyl-β-D-galactopyranoside (Xgal) (panel B). The breakdown product, 5-bromo-4-chloro-3-hydroxyindole – 1, spontaneously dimerizes to form the intensely blue product, 5,5′-dibromo-4,4′-dichloro-indigo – 2. Thus, Xgal has been a valuable research tool, not only in the study of the enzymatic activity of β-gal but also in the development of the commonly used blue-white DNA cloning system that utilizes the β-gal enzyme as a marker in molecular cloning experiments.
The lac operon contains two more genes, in addition to lacZ (Fig. 4). The lacY gene encodes a permease that increases the uptake of lactose into the cell and lacA encodes a galactoside acetyltransferase (GAT) enzyme. The exact function of GAT during lactose metabolism has not been conclusively elucidated but acetylation is thought to play a role in the transport of the modified sugars.
For the lac operon to be expressed, lactose must be present. This makes sense for the cell because it would be energetically wasteful to create the enzymes to process lactose if lactose was not available.
In the absence of lactose, the lacI gene is constitutively expressed, expressing the lac repressor protein (Fig. 28.2.3 B). The lac repressor binds with an operator region of the lac operon and physically prevents RNA polymerase from transcribing the structural genes (Fig. 28.2.3 B). However, when lactose is present, the lactose inside the cell is converted to allolactose. Allolactose serves as an inducer molecule, binding to the repressor and changing its shape so that it is no longer able to bind to the operator DNA (Fig. 28.2.3 C). Removal of the repressor in the presence of lactose allows RNA polymerase to move through the operator region and begin transcription of the lac structural genes. In addition to lactose, laboratory experiments have revealed that the non-natural compound Isopropyl β-D-1-thiogalactopyranoside (IPTG) can also bind with the lac repressor and cause the expression of lac operon (panel C). Similar to Xgal, this compound has also been used as a research tool for molecular cloning.
Figure \(\PageIndex{6}\) shows an interactive iCn3D model of the lactose operon repressor and its complexes with DNA (1LBG).
.png?revision=1&size=bestfit&width=525&height=364)
The resolution of the structure above was insufficient to show the amino acid side chains. Figure \(\PageIndex{7}\) shows an interactive iCn3D model of the NMR solution structure of the dimer of LAC repressor DNA-binding domain complexed to its natural operator O1 (2KEI).
.png?revision=1&size=bestfit&width=574&height=286)
Note the presents of white spheres representing hydrogen atoms (these don't appear in crystal structure but do in NMR structures. Color coding is the same as above. Zoom in to see specific interactions between the protein and the exposed DNA base hydrogen bond donors and acceptors. The complex of O1 and O2 shows similar specific and nonspecific contacts, which makes sense given the lambda repressor has similar affinity for those two operator sites. In contrast, one side of the O3 complex shows a loss of protein: DNA interactions, consistent with its lower affinity of its operator O3.
The Lac Operon: Activation by Catabolite Activator Protein
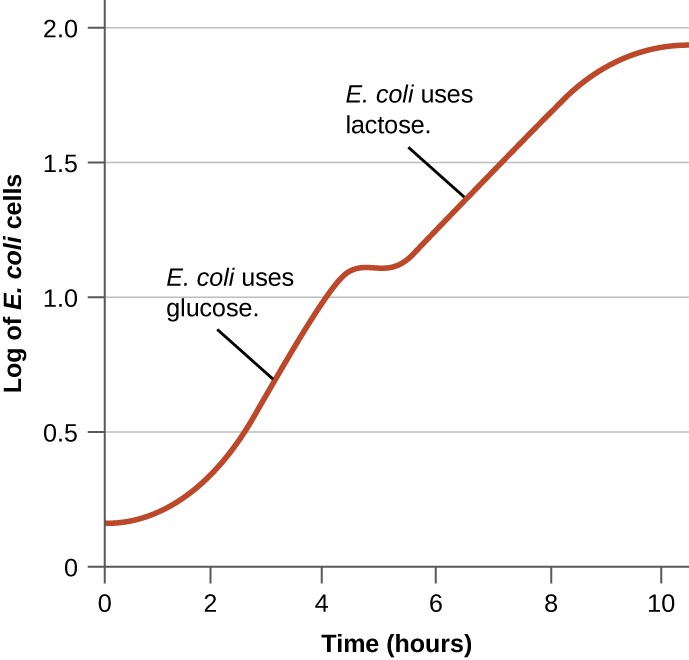
Bacteria typically can use a variety of substrates as carbon sources. However, because glucose is usually preferable to other substrates, bacteria have mechanisms to ensure that alternative substrates are only used when glucose has been depleted. Additionally, bacteria have mechanisms to ensure that the genes encoding enzymes for using alternative substrates are expressed only when the alternative substrate is available. In the 1940s, Jacques Monod was the first to demonstrate a preference for certain substrates over others through his studies of E. coli’s growth when cultured in the presence of two different substrates simultaneously. Such studies generated diauxic growth curves, like the one shown in Figure \(\PageIndex{8}\). Although the preferred substrate glucose is used first, E. coli grows quickly and the enzymes for lactose metabolism are absent. However, once glucose levels are depleted, growth rates slow, inducing the expression of the enzymes needed for the metabolism of the second substrate, lactose. Notice how the growth rate in lactose is slower, as indicated by the lower steepness of the growth curve.
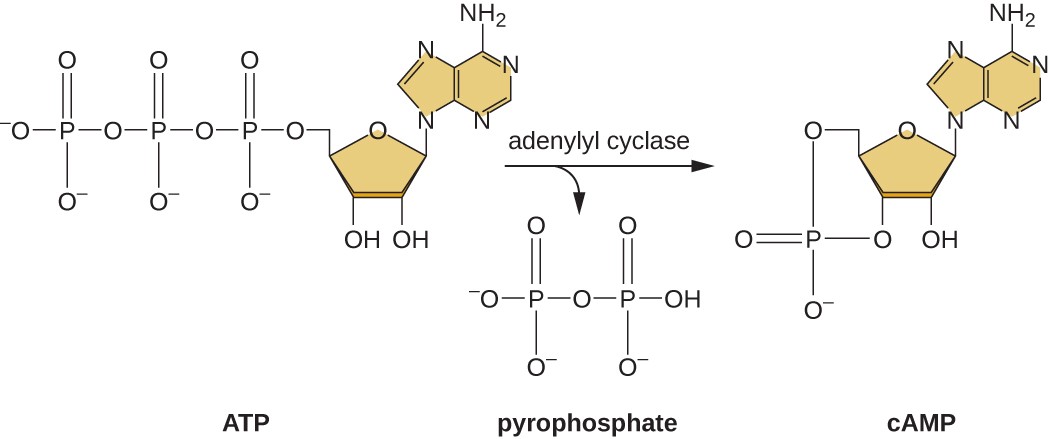
The ability to switch from glucose use to another substrate like lactose is a consequence of the activity of an enzyme called Enzyme IIA (EIIA). When glucose levels drop, cells produce less ATP from catabolism and EIIA becomes phosphorylated. Phosphorylated EIIA activates adenylyl cyclase, an enzyme that converts some of the remaining ATP to cyclic AMP (cAMP), a cyclic derivative of AMP and an important signaling molecule involved in glucose and energy metabolism in E. coli, as shown in Figure \(\PageIndex{9}\). As a result, cAMP levels begin to rise in the cell. This is an indicator to the cell, that overall energy levels are low and that ATP is being depleted.
The lac operon also plays a role in this switch from using glucose to using lactose. When glucose is scarce, the accumulating cAMP caused by increased adenylyl cyclase activity binds to catabolite activator protein (CAP), also known as cAMP receptor protein (CRP). The complex binds to the promoter region of the lac operon, as shown in Figure \(\PageIndex{10}\). In the regulatory regions of these operons, a CAP binding site is located upstream of the RNA polymerase binding site in the promoter. The binding of the CAP-cAMP complex to this site increases the binding ability of RNA polymerase to the promoter region to initiate the transcription of the structural genes. Thus, in the case of the lac operon, for transcription to occur, lactose must be present (removing the lac repressor protein) and glucose levels must be depleted (allowing the binding of an activating protein). When glucose levels are high, there is catabolite repression of operons encoding enzymes for the metabolism of alternative substrates. Because of low cAMP levels under these conditions, there is an insufficient amount of the CAP-cAMP complex to activate the transcription of these operons.
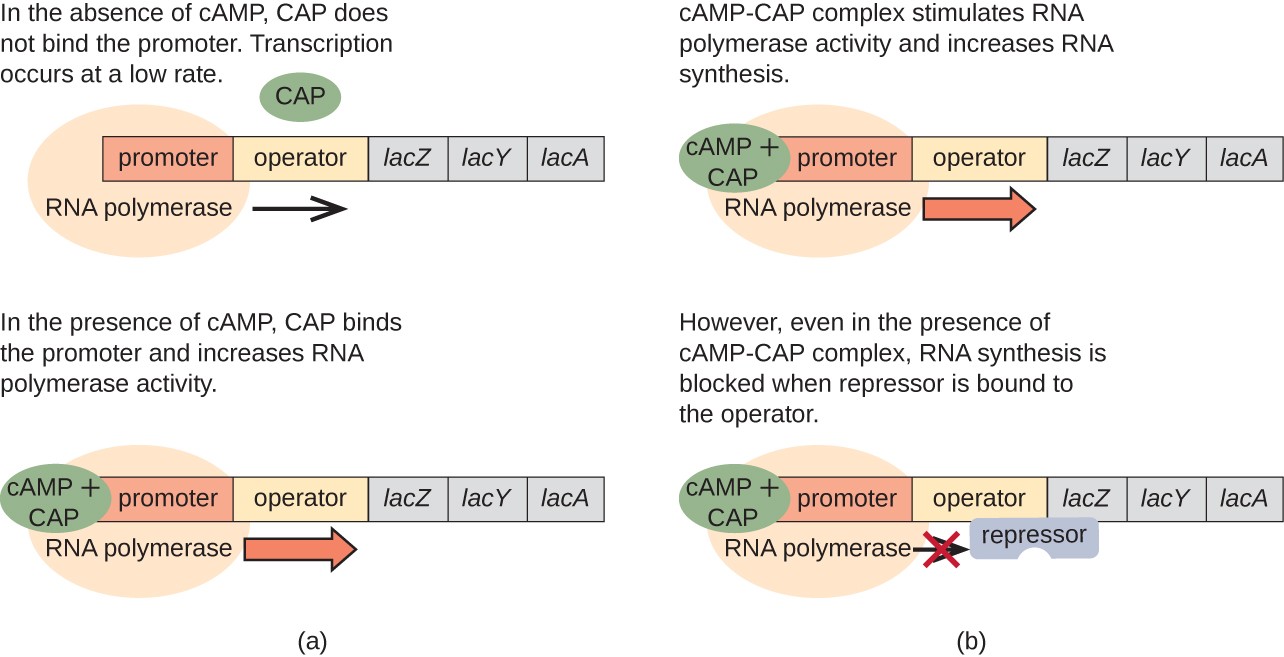
Figure \(\PageIndex{11}\) shows an interactive iCn3D model of the Catabolite activator protein CAP-DNA complex with bound cAMP (2CGP).
.png?revision=1&size=bestfit&width=449&height=335)
Global Responses of Prokaryotes
In prokaryotes, several higher levels of gene regulation have the ability to control the transcription of many related operons simultaneously in response to an environmental signal. A group of operons all controlled simultaneously is called a regulon.
Alarmones
When sensing impending stress, prokaryotes alter the expression of a wide variety of operons to respond in coordination. They do this through the production of alarmones, which are small intracellular nucleotide derivatives, such as guanosine pentaphosphate (pppGpp), as shown in Figure \(\PageIndex{12}\).

Figure \(\PageIndex{12}\): Structure of Guanosine Pentaphosphate (pppGpp). Yikrazuul
Alarmones change which genes are expressed and stimulate the expression of specific stress-response genes. For example, pppGpp signaling is involved in the stringent response in bacteria, causing the inhibition of RNA synthesis when there is a shortage of amino acids present. This causes translation to decrease and the amino acids present are therefore conserved. Furthermore, pppGpp causes the up-regulation of many other genes involved in stress response such as the genes for amino acid uptake (from surrounding media) and biosynthesis.
The use of alarmones to alter gene expression in response to stress appears to be important in pathogenic bacteria, as well. On encountering host defense mechanisms and other harsh conditions during infection, many operons encoding virulence genes are upregulated in response to alarmone signaling. Knowledge of these responses is key to being able to fully understand the infection process of many pathogens and to the development of therapies to counter this process.
Quorum Sensing
Quorum sensing (QS) is an intercellular communication mechanism of bacteria used to coordinate the activities of individual cells at the population level in response to surroundings through the production and perception of diffusible signal molecules such as Acyl Homoserine Lactones or small signaling peptides, as shown in Figure \(\PageIndex{13}\). The signal synthase, signal receptor, and signal molecules are three essential elements of the basic QS circuit machinery. Genes encoding signal-generating proteins are also included among the QS target genes. This forms an autoinduction feedback loop to modulate the generation of signal molecules. Several bacterial behaviors including virulence factors expression, secondary metabolites production, biofilm formation, motility, and luminescence are regulated by QS. Through complex regulatory networks, bacteria are capable of expressing corresponding genes according to their population size and of behaving in a coordinated manner.

The left panel shows the typical Gram-negative quorum sensing mechanism. Acyl homoserine lactone molecules, synthesized by LuxI, passively pass the bacterial cell membrane and when a sufficient concentration is reached (threshold level) activate the intracellular LuxR which subsequently activates target gene expression in a coordinated way. Note that a single cell is shown for simplicity. However, acyl homoserine lactones will commonly diffuse and target neighboring cells within the colony to mediate a communal or population response within the bacterial colony.
The right panel shows that quorum-sensing peptides are synthesized by the bacterial ribosomes as pro-peptidic proteins and undergo posttranslational modifications during excretion by active transport. The quorum-sensing peptides bind membrane-associated receptors which get autophosphorylated and activate intracellular response regulators via phosphotransfer. These phosphorylated response regulators induce increased target gene expression.
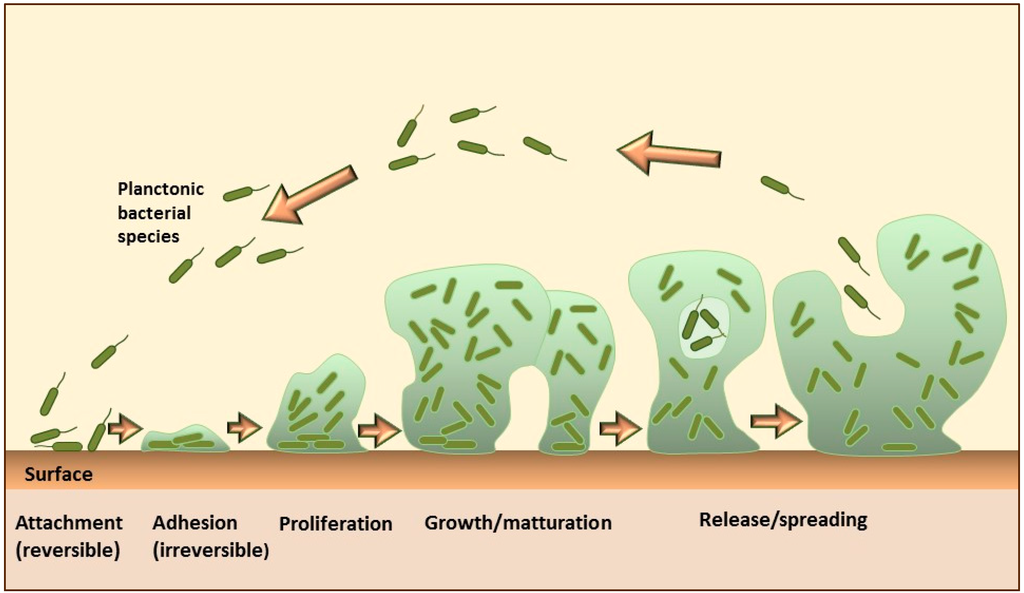
For example, some microbial species, such as Staphylococcus aureus, can encase their community within a self-produced matrix of hydrated extracellular polymeric substances that include polysaccharides, proteins, nucleic acids, and lipid molecules. These encasements are known as biofilms. The formation of the biofilm on solid surfaces is a step-wise process comprising several stages, as shown in Figure \(\PageIndex{14}\). It starts with the conditioning of the surface through the coating with macromolecules from the aqueous surrounding, which enables the initial reversible adhesion of microorganisms. The next step is the formation of stronger, irreversible attachments to the surface, followed by the proliferation and aggregation of microorganisms into multicellular and multilayered clusters, which actively produce an extracellular matrix. Some cells in the mature biofilms continuously detach and separate from the aggregates, representing a continuous source of planktonic bacteria that can subsequently spread and form new microcolonies.
Biofilms are a common cause of chronic, nosocomial (originating in a hospital), and medical device-related infections because they can develop either on vital or necrotic tissue as well as on the inert surfaces of different implanted materials. Moreover, biofilms are linked with high-level resistance to antimicrobials, frequent treatment failures, and increased morbidity and mortality. As a consequence, biofilm infections and accompanying diseases have become a major health concern and a serious challenge for both modern medicine and pharmacy. The rough estimation shows that more than 60% of hospital-associated infections are attributable to the biofilms formed on indwelling medical devices, which result in more than one million cases of infected patients annually and more than $1 billion in hospitalization costs per year in the USA.
Biofilm infections share some common characteristics: slow development in one or more hot spots, delayed clinical manifestation, and persistency for months or years, usually with interchanging periods of acute exacerbations and absence of clinical symptoms. Even though they are less aggressive than acute infections, their treatment is challenging to a greater extent. There is upto a 1000-fold decrease in the susceptibility of biofilms to antimicrobial agents and disinfectants as well as resistance to host immune response. Thus, ways to reduce or inhibit biofilm formation are highly sought. The majority of the proposed biofilm-control methods focus on: (i) prevention and minimization of biofilm formation by selection and surface modifications of anti-adhesive materials; (ii) debridement techniques including ultrasound and surgical procedures; (iii) disruption of biofilm QS-signaling system; or (iv) achieving proper drug penetration and delivery to formed biofilms by the use of an electromagnetic field, ultrasound waves, photodynamic activation or specific drug delivery systems.
Alternate σ Factors
Since the σ subunit of bacterial RNA polymerase confers specificity as to which promoters should be transcribed, altering the σ factor used is another way for bacteria to quickly and globally change what regulons are transcribed at a given time. The σ factor recognizes sequences within a bacterial promoter, so different σ factors will each recognize slightly different promoter sequences. In this way, when the cell senses specific environmental conditions, it may respond by changing which σ factor it expresses, degrading the old one and producing a new one to transcribe the operons encoding genes whose products will be useful under the new environmental condition. For example, in sporulating bacteria of the genera Bacillus and Clostridium (which include many pathogens), a group of σ factors controls the expression of the many genes needed for sporulation in response to sporulation-stimulating signals.
Prokaryotic Attenuation and Riboswitches
Although most gene expression is regulated at the level of transcription initiation in prokaryotes, there are also mechanisms to control both the completion of transcription, as well as translation, concurrently. Since their discovery, these mechanisms have been shown to control the completion of transcription and translation of many prokaryotic operons. Because these mechanisms link the regulation of transcription and translation directly, they are specific to prokaryotes, because these processes are physically separated in eukaryotes.
One such regulatory system is attenuation, whereby secondary stem-loop structures formed within the 5’ end of an mRNA being transcribed determine if transcription to complete the synthesis of this mRNA will occur and if this mRNA will be used for translation. Beyond the transcriptional repression mechanism already discussed, attenuation also controls the expression of the trp operon in E. coli as shown in Figure \(\PageIndex{15}\). The trp operon regulatory region contains a leader sequence called trpL between the operator and the first structural gene, which has four stretches of RNA that can base pair with each other in different combinations. When a terminator stem-loop forms, transcription terminates, releasing RNA polymerase from the mRNA. However, when an antiterminator stem-loop forms, this prevents the formation of the terminator stem-loop, so RNA polymerase can transcribe the structural genes.
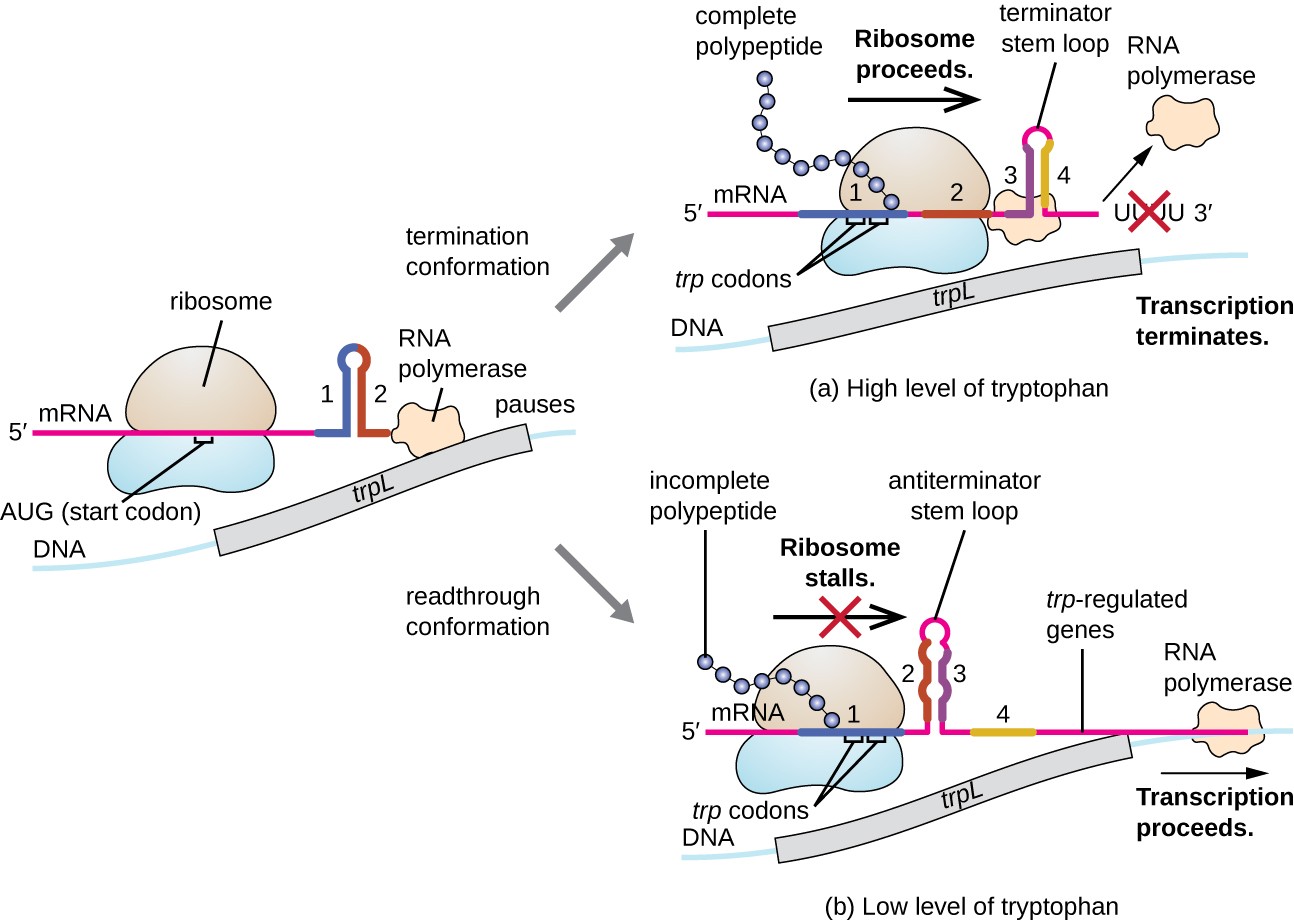
When tryptophan is plentiful, translation of the short leader peptide encoded by trpL proceeds, the terminator loop between regions 3 and 4 forms, and transcription terminates. When tryptophan levels are depleted, translation of the short leader peptide stalls at region 1, allowing regions 2 and 3 to form an antiterminator loop, and RNA polymerase can transcribe the structural genes of the trp operon.
A related mechanism of concurrent regulation of transcription and translation in prokaryotes is the use of a riboswitch, a small region of noncoding RNA found within the 5’ end of some prokaryotic mRNA molecules, as shown in Figure \(\PageIndex{16}\). A riboswitch may bind to a small intracellular molecule to stabilize certain secondary structures of the mRNA molecule. The binding of the small molecule determines which stem-loop structure forms, thus influencing the completion of mRNA synthesis and protein synthesis.
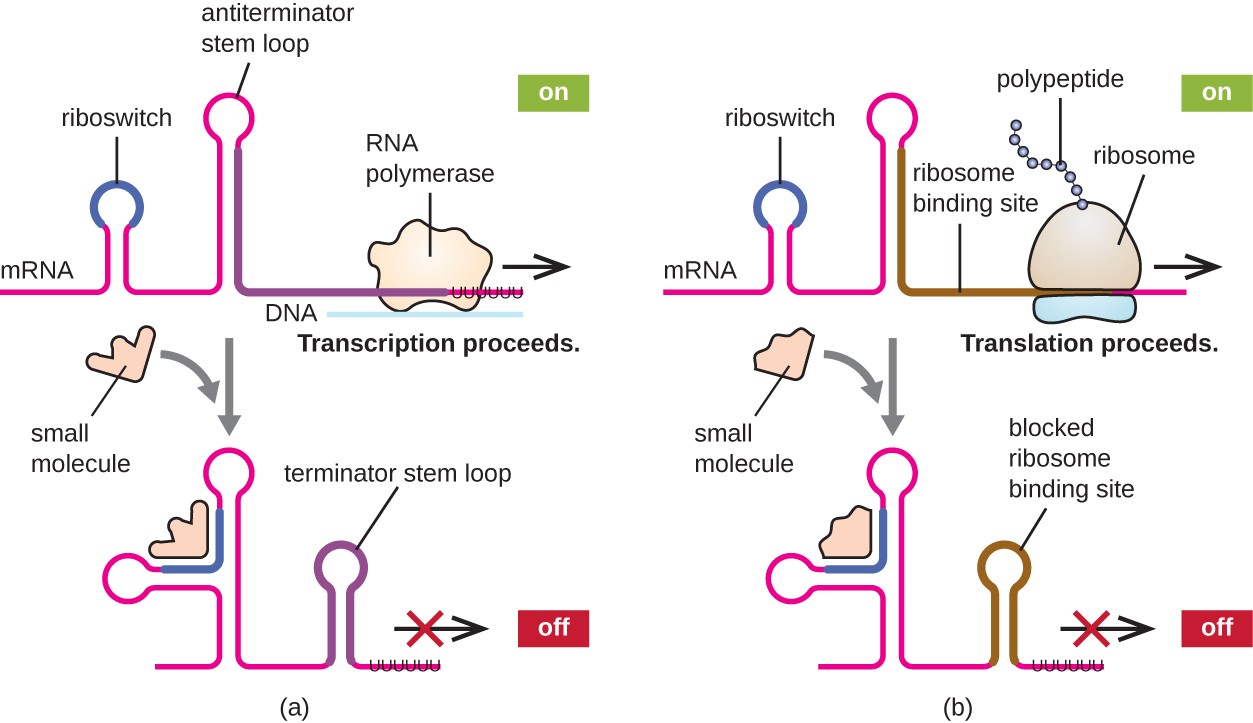
Riboswitches found within prokaryotic mRNA molecules can bind to small intracellular molecules, stabilizing certain RNA structures, and influencing either the completion of the synthesis of the mRNA molecule itself (left) or the protein made using that mRNA (right).
Figure \(\PageIndex{17}\) shows interactive iCn3D models of a series of bacterial riboswitches. They are described in the legend below.
|
Guanine-responsive riboswitch bound to metabolite hypoxanthine (4FE5)
A. (Copyright; author via source). Click the image for a popup or use this external link: https://structure.ncbi.nlm.nih.gov/i...Nh1Sv7oSSyC6Z6 |
Divalent cation-sensing regulatory RNA (2QBZ)
B. (Copyright; author via source). Click the image for a popup or use this external link: https://structure.ncbi.nlm.nih.gov/i...VbU9Vf6DUA4VE8 |
|
Cyclid-di-GMP RNA riboswitch (3IRW)
C. (Copyright; author via source). Click the image for a popup or use this external link:https://structure.ncbi.nlm.nih.gov/i...wVntbdScP3VCF8 |
GlmS ribozyme bound to glucosamine-6-phosphate (2Z75)
D. (Copyright; author via source). Click the image for a popup or use this external link: https://structure.ncbi.nlm.nih.gov/i...w9T4K9ffK1NU27 |
.png?revision=1)
.png?revision=1)
.png?revision=1)
.png?revision=1)
A: Guanine-responsive riboswitch bound to metabolite hypoxanthine (4FE5) - Hypothanine, involved in purine metabolism, is shown bound to RNA representing the 5' untranslated region of the xanthine phosphoribosyltransferase (xbt)/ xanthine-specific purine permease (pbux) genes that lead to transcription termination.
B: The M-box in mycobacterial genes regulating Mg2+ transport binds divalent cation. They are transcribed under low Mg2+ concentrations. Salt bridges (ion-ion interactions) are shown in cyan and pi-cation interactions in red dotted lines
C: Bis-(3'-5')-cyclic dimeric guanosine monophosphate (c-di-GMP) is a second messenger in bacteria and regulates many cellular processes including the formation of biofilms. The riboswitch shown here is from Vibrio cholerae. The U1 small nuclear ribonucleoprotein A is shown in cyan. Figure \(\PageIndex{18}\) shows a cartoon of the actual riboswitch in the 5' untranslated region of target genes

D. This ribozyme is in the 5′ untranslated region of glucosamine-6-phosphate synthase mRNA. The protein enzyme, 2. This protein enzyme catalyzes the conversion of fructose 6-phosphate and glutamine to glucosamine 6-phosphate (GlcN6P) and glutamate. The glmS ribozyme in the 5'-untranslated region cleaves itself on binding GlcN6P. This self-cleavage is inhibited by glucose 6-phosphate (Glc6P). Hence high levels of the gene product for the synthase lead to cleavage of its own mRNA. The glmS ribozyme RNA is shown in gray and its substrate RNA in cyan.
References
- Parker, N., Schneegurt, M., Thi Tu, A-H., Lister, P., Forster, B.M. (2019) Microbiology. Openstax. Available at: https://opentextbc.ca/microbiologyopenstax/
- Chan, K-G., Liu, Y-C., and Chang C-Y. (2015) Inhibiting N-acyl-homoserine lactone synthesis and quenching Pseudomonas quinolone quorum sensing to attenuate virulence. Front. Microbiol. 6:1173. Available at: https://www.frontiersin.org/articles/10.3389/fmicb.2015.01173/full
- Rukavina, Z., and Vanic Zeljka. (2016) Current trends in development of liposomes targeting bacterial biofilms. Pharmaceutics 8(2):18. Available at: https://www.mdpi.com/1999-4923/8/2/18/htm
- Wikipedia contributors. (2020, April 18). Guanosine pentaphosphate. In Wikipedia, The Free Encyclopedia. Retrieved 16:26, August 23, 2020, from https://en.Wikipedia.org/w/index.php?title=Guanosine_pentaphosphate&oldid=951778776
- Verbeke, F., De Craemer, S., Debunne, N., Janssens, Y., Wynendaele, E., Van de Wiele, C., and De Spiegeleer. B. (2017) Peptides as quorum sensing molecules: measurement techniques and obtained levels in vitro and in vivo. Frontiers in Neuroscience 11:183. Available at: https://www.researchgate.net/publication/316055402_Peptides_as_Quorum_Sensing_Molecules_Measurement_Techniques_and_Obtained_Levels_In_vitro_and_In_vivo
- Yesudhas, D., Batool, M., Anwar, M.A., Panneerselvam, S., and Choi, S. (2017) Proteins recognizing DNA: Structural uniqueness and versatility of DNA-binding domains in Stem Cell Transcription Factors. Genes 8(8):192. Available at: https://www.mdpi.com/2073-4425/8/8/192/htm
- Castellanos, M., Mothi, N., and Muñoz, V. (2020) Eukaryotic transcription factors can track and control their target genes using DNA antennas. Nature Comm. 11:540. Available at: https://www.nature.com/articles/s41467-019-14217-8
- Neideracher, G., Klopf, E., and Schüller, C. (2011) Interplay of dynamic transcription and chromatin remodeling: Lessons from yeast. Int J Mol Sci 12(8):4758-4769. Available at: https://www.ncbi.nlm.nih.gov/pmc/articles/PMC3179130/
- Kim, S., and Kaang, B-K. (2017) Epigenetic regulation and chromatin remodeling in learning and memory. Exp. & Mol. Med. 49:e281. Available at: https://www.nature.com/articles/emm2016140#Fig1
- Tvardovskly, A., Schwämmle, V., Kempf, S., Rogowska-Wrzesinka, A., and Jensen, O.N. (2016) Accumulation of histone variant H3.3 with age is associated with profound changes in the histone methylation landscape. Nuc. Acids Res. 45(16):1093. Available at: https://www.researchgate.net/publication/318987684_Accumulation_of_histone_variant_H33_with_age_is_associated_with_profound_changes_in_the_histone_methylation_landscape
- Cipolletti, M., Fernandez, V.S., Montalesi, E., Marino, M., Fiochetti, M. (2018) Beyond the antioxidant activity of dietary polyphenols in cancer: The modulation of estrogen receptors (ERs) signaling. Int J. Mol Sci 19(9)2624. Available at: https://www.mdpi.com/1422-0067/19/9/2624/htm
- Griekspoor, A., Zward, W., Neefjes, J., and Michalides, R. (2007) Visualizing the action of steroid hormone receptors in living cells. Nucl. Recept. Signal. 5:e003 Available at: https://www.ncbi.nlm.nih.gov/pmc/articles/PMC1853070/
- Mitsis, T., Papargeorgiou, L., Efthimiadou, A., Bacopoulou, F., Vlachakis, D., Chrousos, G.P., Eliopoulos, E. (2020) A comprehensive structural and functional analysis of the ligand binding domain of the nuclear receptor superfamily reveals highly conserved signaling motifs and two distinct canonical forms through evolution. World Acad Sci J 1: 264-274, 2019. Available at: https://www.spandidos-publications.com/10.3892/wasj.2020.30
- Reed, S.M., and Quelle, D.E. (2015) p53 Acetylation: Regulation and consequences. Cancers 7(1):30-69. Available at: https://www.mdpi.com/2072-6694/7/1/30/htm.
- Maclaine, N.J., and Hupp, T.R. (2009) The regulation of p53 by phosphorylation: a model for how distinct signals integrate into the p53 pathway. Aging 1(5):490-502. Available at: https://www.ncbi.nlm.nih.gov/pmc/articles/PMC2806026/
- Wikipedia contributors. (2020, August 1). Estrogen. In Wikipedia, The Free Encyclopedia. Retrieved 01:28, September 6, 2020, from https://en.Wikipedia.org/w/index.php?title=Estrogen&oldid=970560042
- Kluska, K., Adamczyk, J., and Krezel, A. (2018) Metal binding properties, stability, and reactivity of zinc fingers. Coord. Chem Rev. 367:18-64. Available at: https://www.sciencedirect.com/science/article/pii/S0010854517305441
- Wikipedia contributors. (2020, July 4). Leucine zipper. In Wikipedia, The Free Encyclopedia. Retrieved 07:00, September 7, 2020, from https://en.Wikipedia.org/w/index.php?title=Leucine_zipper&oldid=965962667
- Wikipedia contributors. (2020, April 15). Zinc finger. In Wikipedia, The Free Encyclopedia. Retrieved 18:28, September 7, 2020, from https://en.Wikipedia.org/w/index.php?title=Zinc_finger&oldid=951116840
- Horsthemke, B. (2018) A critical view on transgenrational epigenetic inheritence in humans. Nat. Comm. 9:2973. Available at: https://www.nature.com/articles/s41467-018-05445-5#rightslink