15.3: Glycogenolyis and its Regulation by Glucagon and Epinephrine Signaling
- Page ID
- 77731


In the previous section, you learned that glucagon signaling down-regulates glycogen synthesis. Now let's look at glycogen breakdown, called glycogenolysis, and its control by two hormones, glucagon, and epinephrine. Only two enzymes are required for the breakdown of glycogen, the glycogen phosphorylase enzyme, and the glycogen debranching enzyme.
Glycogenolysis: An Overview
Two key enzymes are required for the stepwise catabolism of glycogen, glycogen phosphorylase, and glycogen debranching enzyme. In the liver, the ultimate end product is glucose-1-phosphate, which is dephosphorylated in the liver to enable the export of free glucose into the circulation. In contrast, in the respiring skeletal muscle, it is converted to glucose-6-phosphate for use in glycolysis. Glycogenolysis is also activated by the hormones glucagon and epinephrine.
Glycogen Phosphorylase
Glycogen phosphorylase (GP) catalyzes the release of glucose 1-phosphate from the alpha 1→ 4 non-reducing ends of glycogen. An overview of this reaction is shown in Figure \(\PageIndex{1}\).
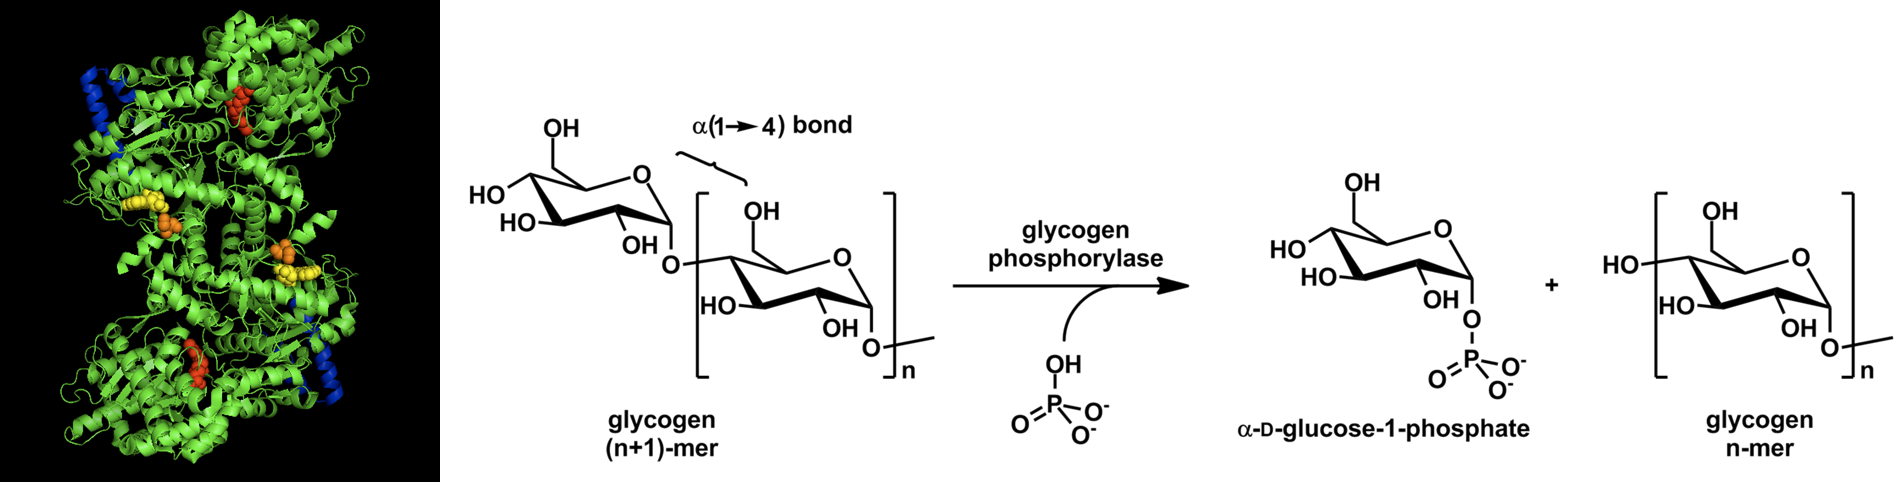
Figure \(\PageIndex{1}\): Overview of Glycogen Phosphorylase Reaction. Images from Ascherer730 and Michal Sobkowski
Glycogen phosphorylase is a homodimer with two active sites. It also requires a cofactor, pyridoxal phosphate (PLP) to be functional (Figure \(\PageIndex{2}\)). The PLP is derived from Vitamin B6. You may have heard previously that low levels of B vitamins are associated with lethargy or a lack of energy. We will continue to see that the B vitamins provide essential cofactors for enzymes involved in the production of ATP. Thus, if you lack B vitamins, you are not efficiently producing ATP. The PLP cofactor of GP is attached covalently to the enzyme through a Schiff-base linkage with a Lysine (K) residue.
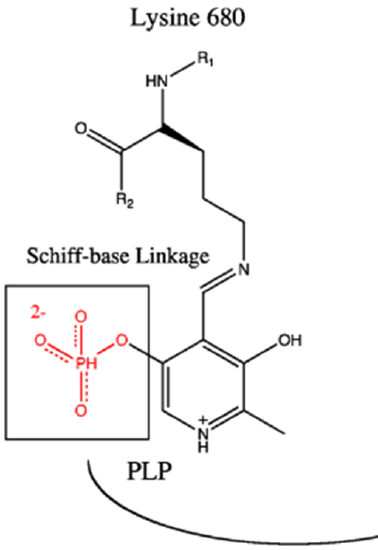
Figure \(\PageIndex{2}\): Pyridoxyl Phosphase Cofactor Associated with Glycogen Phosphorylase Image modified from Ascherer730
The reaction mechanism of glycogen phosphorylase is detailed in Figure \(\PageIndex{3}\). When glycogen phosphorylase binds with glycogen a free inorganic phosphate anion is positioned by the PLP and the enzyme active site in proximity with the anomeric carbon position of the non-reducing end residue of the glycogen molecule. The oxygen involved in the glycosidic bond attacks the partially charged hydrogen associated with the phosphate ion, leading to the cleavage of the glycosidic bond. The cleaved glycogen chain leaves the active site and one of the phosphate oxygens attacks the carbocation intermediate created during the cleavage. This results in the release of the terminal glucose residue as glucose 1-phosphate
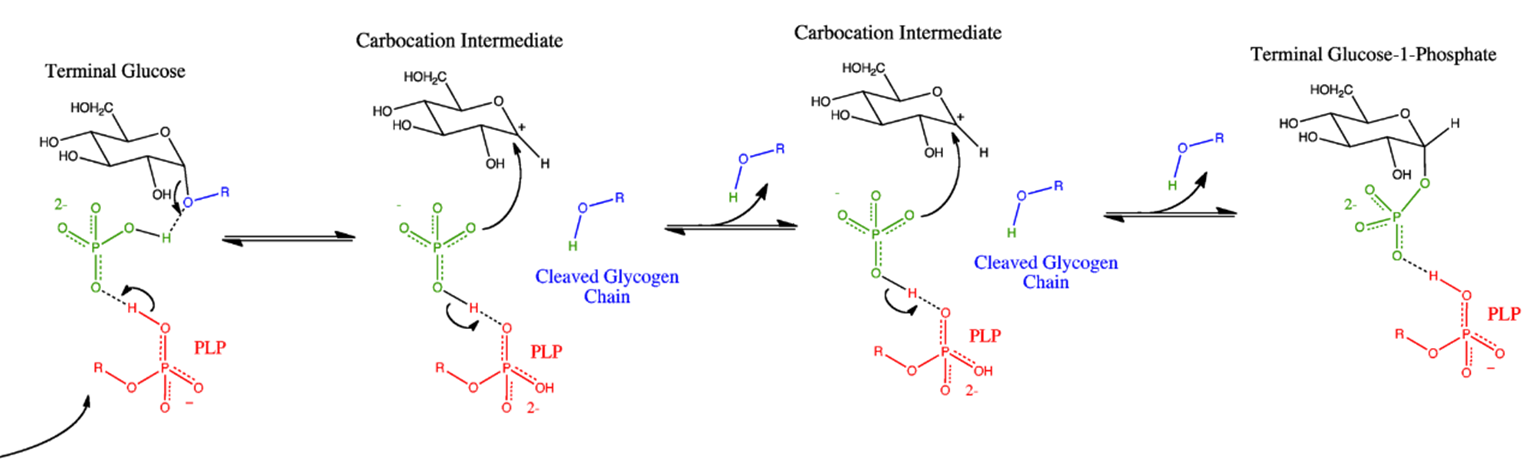
Figure \(\PageIndex{3}\): Glycogen Phosphorylase Reaction Mechanism. Image from Ascherer730
Glycogen Debranching Enzyme
Glycogen phosphorylase cannot cleave the alpha 1 → 6 linkages, and it also cannot cleave alpha 1 --> 4 linkages that are within 4 residues of an alpha 1→ 6 linkage (the glycogen chain will no longer fit into the active site of the enzyme) The Glycogen Debranching Enzyme (GDE) has two catalytic activities that enable it to deal with this problem. The first catalytic activity is a Glycosyl Transferase (GT) activity. In this process, the three remaining alpha 1 → 4 extended units on the branch site (colored in green) are clipped off of the branch site and attached to a straight chain of alpha 1 → 4 extended glucose residues. The second part of the reaction requires the Glucosidase (GC) activity that mediates the hydrolysis of the alpha 1 → 6 glycosidic bond and the release of free glucose in the process. Glycogen Phosphorylase can then resume the breakdown of the remaining alpha 1 → 4 chain. An overview of glycogen breakdown is shown in Figure \(\PageIndex{4}\).
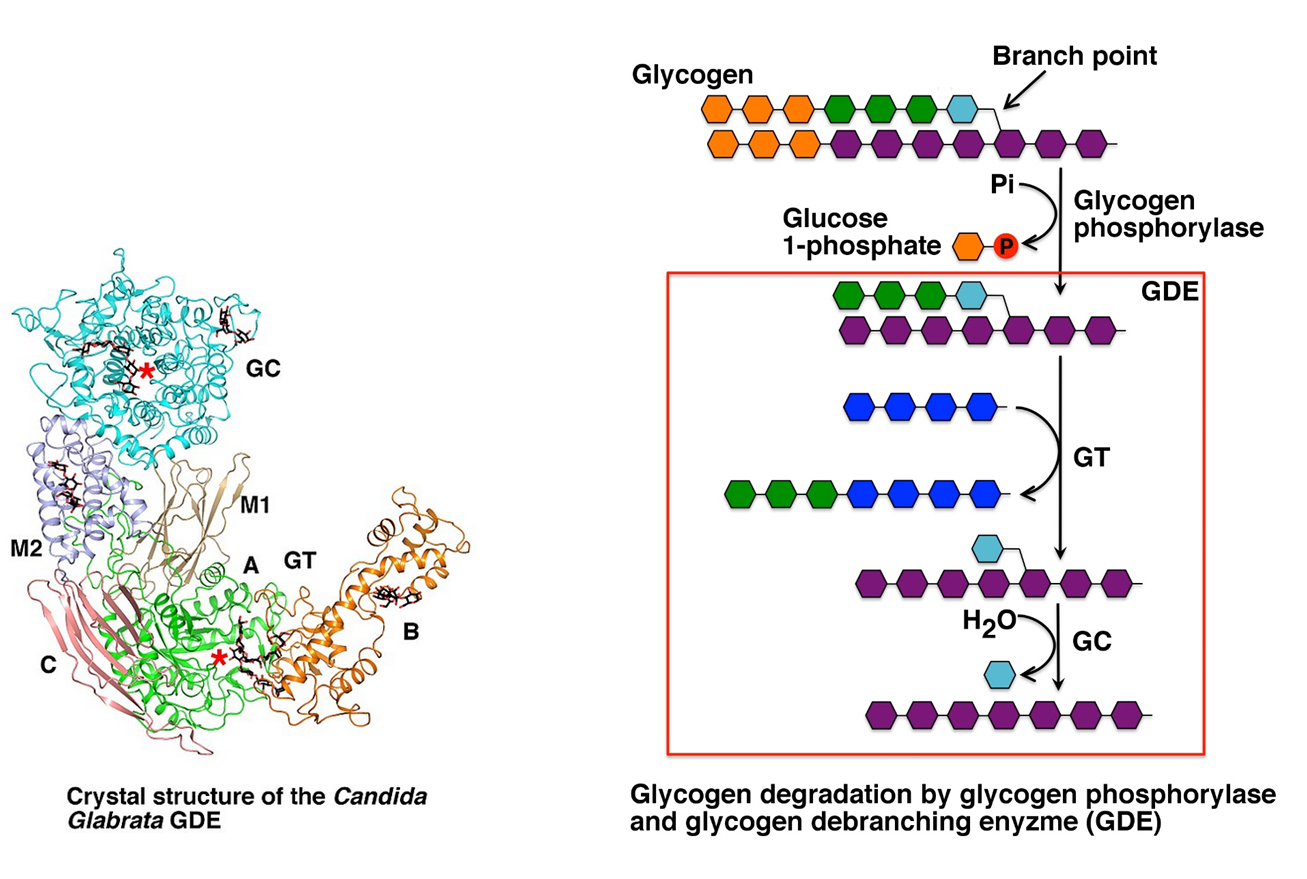
Figure \(\PageIndex{4}\): Biological Activity of the Glycogen Debranching Enzyme. Image modified from XiangSong
Dephosphorylation of Glucose 1-Phosphate
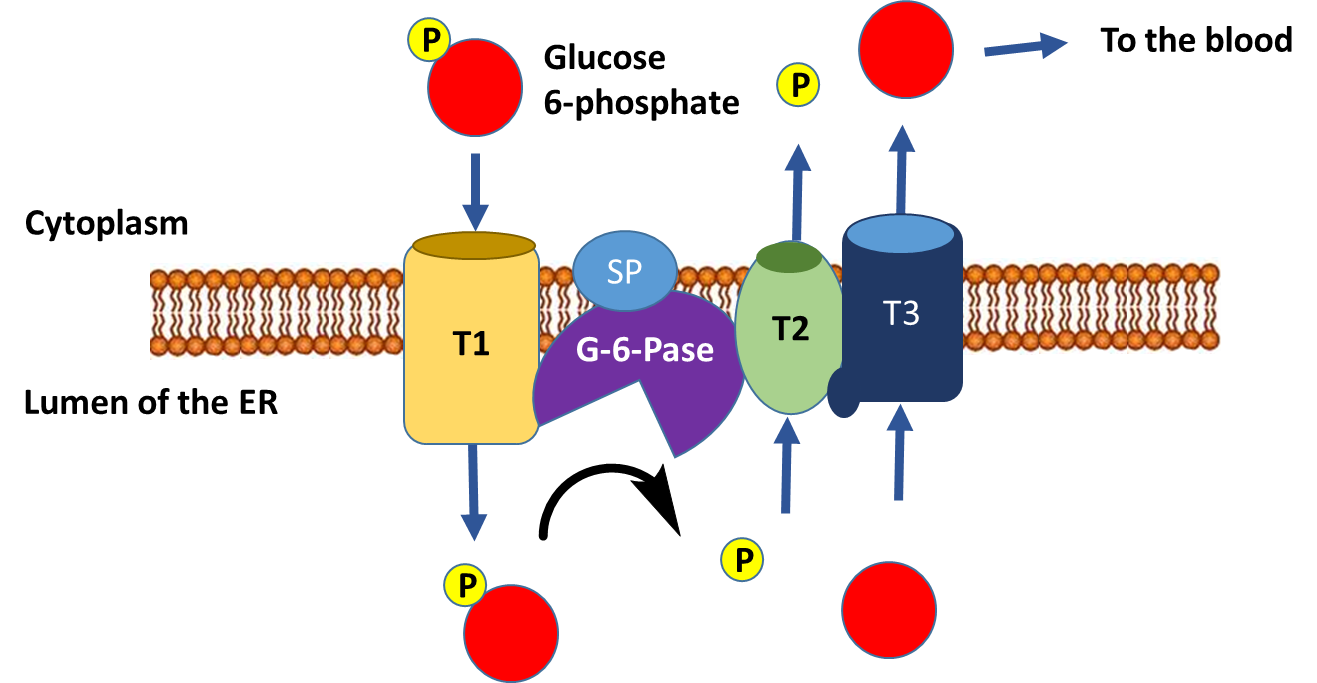
Following the activation of glycogenolysis, the liver cell has now released large quantities of glucose 1-phosphate from glycogen, as well as a smaller amount of free glucose from the clipped branch residues. The free glucose can be transported to the bloodstream straight away, but the glucose 1-phosphate must be dephosphorylated prior to release (Figure \(\PageIndex{5}\)).

Figure \(\PageIndex{5}\): Process of Glucose Dephosphorylation in Liver Cells
The dephosphorylation of glucose only occurs in liver cells, as this is the primary location for the regulation of blood glucose levels. Free glucose can exit the cell while phosphorylated forms are trapped inside the cell. Figure \(\PageIndex{6}\) outlines the process of glucose dephosphorylation in the liver. To mediate the dephosphorylation of glucose, glucose 6-phosphate is transported from the cytoplasm into the lumen of the endoplasmic reticulum (ER) through transporter 1 (T1). The glucose 6-phosphatase (G-6-Pase) then cleaves the phosphate from the substrate, releasing inorganic phosphate (P) and glucose (red molecule). The inorganic phosphate is then transported back into the cytoplasm through transporter 2 (T2) and glucose is transported through Transporter 3 (T3). Free glucose is then transported back into the bloodstream through a glucose (GLUT) transporter located in the plasma membrane.
Hormonal Control of Glycogen breakdown
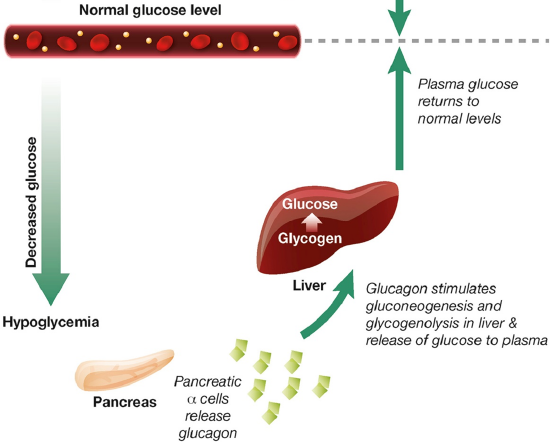
In the previous sections, we’ve discussed insulin signaling and the process of building glycogen (glycogenesis) in detail. Now let’s take a look at the other side of the homeostatic balance which begins with glucagon signaling. During hypoglycemia (or low blood glucose levels), pancreatic alpha (α) cells release the hormone peptide, glucagon, which stimulates gluconeogenesis (the formation of glucose) and glycogenolysis (the breakdown of glycogen) in the liver, resulting in the release of glucose to the plasma, and the raising of blood glucose levels, as shown in Figure \(\PageIndex{7}\).
Let’s review a few terms before we begin. In the last section, we were introduced to glycogenesis, the synthesis of glycogen. We saw that this pathway was activated during insulin signaling. In glucagon signaling, this pathway is inhibited and the opposite pathway, glycogenolysis (glycogen breakdown) is activated. Glucagon signaling in the liver also down-regulates glycolysis (the utilization of glucose for energy production), as the liver is trying to use glucose to maintain blood glucose levels. It doesn’t utilize it for its own energy needs during this time. Instead, lipids can be used by liver cells to generate ATP, and in fact, glucagon signaling increases lipolysis or the breakdown of lipids. Finally, glucagon also up-regulates the process of gluconeogenesis or the generation of glucose from non-sugar metabolites. We will address the mechanisms of glycolysis and gluconeogenesis regulation in a later section. Here we will only take a cursory look at these pathways and will focus more on the process of glycogenolysis.
Overview of Glucagon Signaling
Glucagon signaling begins when the hormone binds with its receptor on liver cells as shown in Figure \(\PageIndex{8}\). Glucagon receptors are not widespread within the body as insulin receptors. Since the purpose of this hormone is to cause the release of glucose back into the bloodstream, this process is highly controlled and only the liver can deliver glucose back into the bloodstream to maintain homeostasis. Thus, other target tissues such as skeletal muscle do not need to have these receptors expressed and are not sensitive to glucagon signaling.
The glucagon receptor is a G-protein-coupled receptor and is also referred to as a 7TM receptor (as it contains 7 transmembrane domains that span the plasma membrane). This family of receptors is widespread throughout the body and responsible for many of the pharmaceutical mechanisms of action seen in our treatment of different disease conditions. With regards to this pathway, once glucagon binds to the receptor, the receptor moves laterally in the plasma membrane and binds with a G-protein that is stationed as a peripheral protein to the plasma membrane. The G-protein contains three major domains, the alpha, the beta, and the gamma domain. The alpha domain is capable of binding to the GDP/GTP cofactor. When the G-protein is inactive, all three subunits stay together and the alpha subunit remains inactive and bound to GDP.
When the G-protein associates with an activated receptor, the alpha subunit exchanges GTP for the bound GDP cofactor, and the gamma and beta subunits dissociate into the cytoplasm. The activated alpha subunit moves laterally on the periphery of the plasma membrane until it contacts the adenylyl cyclase enzyme (also called adenylate cyclase). This activates the adenylyl cyclase that converts ATP into cyclic AMP (cAMP). cAMP production is an amplification step within this pathway. That means that more cAMP is produced than G-proteins are activated.
After some time a G-protein hydrolase will cause the hydrolysis of the GTP to GDP and inactivate the G-protein. At this point, the G-protein will associate with the gamma and beta subunits reforming its inactive state. Another glucagon signaling event will be required to reactivate the process. The cyclic AMP produced in the process serves as a second messenger in the process and activates a myriad of downstream targets. We will focus on two of the major targets.
The first is Protein Kinase A, which becomes activated upon binding with cAMP. The second target is a cAMP Response Element-Binding Protein (CREB). The CREB protein is also activated when bound to the cAMP molecule. This causes the CREB protein to translocate from the cytosol into the mitochondria and the nucleus. In both of these locations, the activated CREB binds to specific response element sequences in the DNA and activates the transcription of genes that are involved in gluconeogenesis. These genes and their encoded proteins have been discussed in more detail in chapter 14. What is important to note now is that glucagon signaling in the liver results in the upregulation of glucose production de novo from non-carbohydrate precursors. This is NOT a favored pathway in the body. It is expensive energetically for the liver to manufacture glucose. In fact, more expensive in the cost of ATP than can be produced from the newly formed molecule. However, organs like the brain can only utilize free glucose as an energy resource. Thus, the liver will engage in this energy deficit to build glucose for use by the brain and other cellular targets.
Glucagon signaling also leads to the downregulation of glycolysis, which we will cover in more depth in section 15.4 and glycogenesis. It also leads to an increase in glycogenolysis or the breakdown of glycogen. Let's take a further look at the regulation of both of these processes.
Regulation of Glycogenesis -
Since glycogen synthase (GS) is the primary enzyme required for glycogenesis, it is also the primary target for the regulation of this pathway. Recall that GS is active in the dephosphorylated state. Thus, PKA down-regulates the activity of this enzyme through the phosphorylation of GS, as shown in Figure \(\PageIndex{9}\). Phosphorylation of GS causes it to shift into its inactive conformation and inhibits glycogenesis.
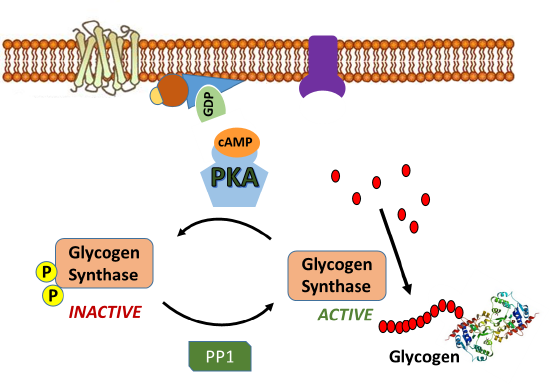
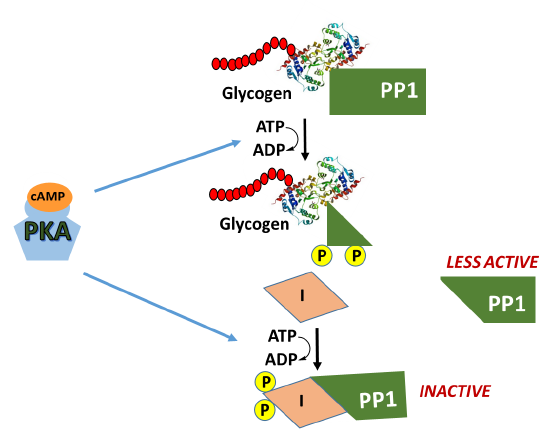
In addition, activated PKA also phosphorylates the protein phosphatase 1 (PP1) enzyme leading to the inactivation of the phosphatase. PP1 normally dephosphorylates GS, helping to retain the active conformation of GS. Thus, phosphorylation of PP1 by PKA helps to maintain the GS in the phosphorylated, inactive state. The inhibition of PP1, is quite complicated, as shown in Figure \(\PageIndex{10}\). PP1 contains a regulatory domain and a catalytic domain. Normally the regulatory domain of PP1 binds with glycogen, keeping the molecule close to the location where GS will be present. Thus, when GS is near its substrate it can also bind with PP1 and be dephosphorylated into its active state. This is more efficient than diffusing in the cell and trying to find the PP1 randomly. When PKA phosphorylates the regulatory domain of PP1, it dissociates from the catalytic domain, causing the catalytic domain to float away from the glycogen molecule. This makes PP1 less efficient at dephosphorylating GS because it is harder for the molecules to randomly come into contact with one another. Thus, PP1 is less active. PKA reduces this activity even further, by phosphorylating an allosteric inhibitor (I) of PP1. In the phosphorylated state, the inhibitor can bind to PP1 fully inactivating the phosphatase. Both phosphorylation events need to be reversed to regain full PP1 activity.
In summary, glucagon signaling in the liver downregulates glycogenesis through the activation of PKA. PKA phosphorylates GS directly, inactivating the enzyme, and maintains it in the inactive state by also inhibiting the PP1 responsible for dephosphorylating GS.
Activation of Glycogenolysis
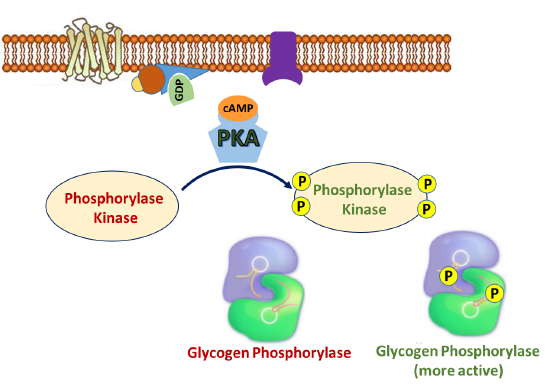
In addition to phosphorylating GS and PP1 during the inactivation of glycogenesis, PKA also phosphorylates the enzyme Phosphorylase Kinase, which is upstream of glycogen phosphorylase, the primary enzyme involved in glycogen breakdown. As its name implies, phosphorylase kinase is a protein kinase that phosphorylates the enzyme to activate it. Figure \(\PageIndex{11}\) offers a first view of the phosphorylation cascade required for glycogen phosphorylase activation.
The phosphorylase kinase enzyme is a complex enzyme that is a tetramer of a tetrameric complex, αβγδ, so the full holoenzyme has an (αβγδ)4 structure. It is large with a molecular weight of around 1.3x10⁶. As you would expect, it is highly regulated in multiple ways, including phosphorylation by PKA, ADP (an allosteric effector), divalent cations like Ca2+, and pH. The α and β are regulatory subunits that affect activity through their phosphorylation. The δ is calmodulin, a calcium-binding protein we discussed in Chapter 12.7, and its binding of calcium affects the holoenzyme activity. The γ subunit has kinase activity and has an N-terminal catalytic domain and a C-terminal calmodulin-binding domain. This is primarily regulated by phosphorylation through the PKA pathway as shown in Figure 15.3.5.
"PHK is one of the largest of the protein kinases and is composed of four types of subunit, with stoichiometry (αβγδ)4, and a total mol. wt of 1.3×10⁶ Da. Activity is regulated by cyclic AMP-dependent protein kinase phosphorylation, autophosphorylation, allosteric effectors (e.g. ADP), metal ion concentration (Ca2+ and Mg2+), proteolysis and pH (Pickett-Gies and Walsh, 1986). The α and β subunits are regulatory and are the targets for control by phosphorylation. The δ subunit is essentially identical to calmodulin and confers Ca2+ sensitivity. The 386 amino acid γ subunit is the catalytic subunit which comprises an N-terminal kinase domain (residues 1–298) and a regulatory calmodulin-binding domain (residues 299–386)"
Calcium, an allosteric regulator, may be present within cellular targets due to nerve impulse firing, muscle contraction, or through hormone signaling. The presence of calcium in the cell generally indicates that there is high energy demand on the cell at that time and that energy production is needed. Thus, calcium binding to the phosphorylase kinase is a positive effector of the enzyme and upregulates activity. Maximal activity of the enzyme is achieved through combined phosphorylation and calcium binding. Thus, phosphorylase kinase can exist in 4 different states of activity as shown in linked equilibria in Figure \(\PageIndex{12}\).
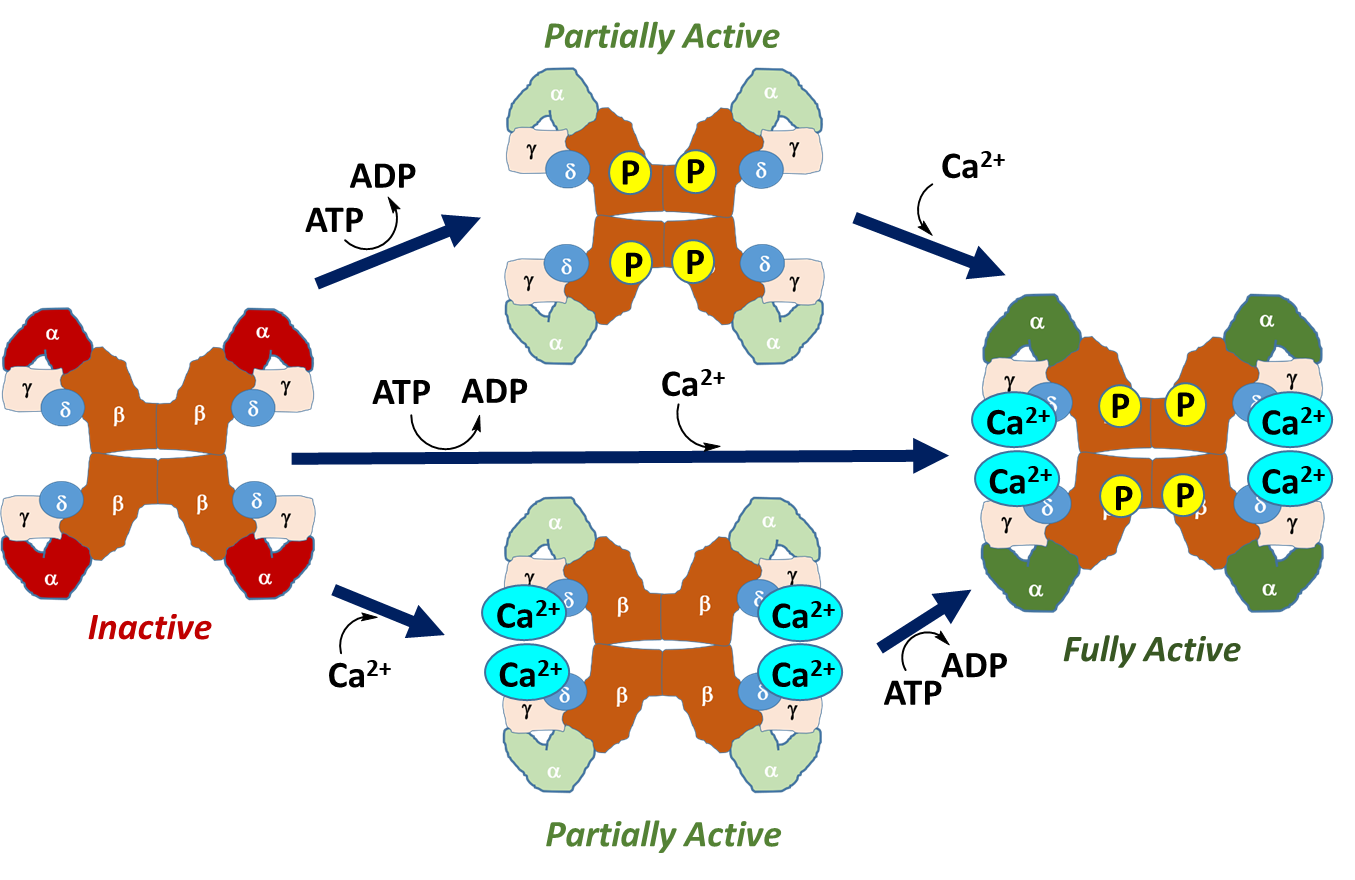
Figure \(\PageIndex{12}\): Activation States of Phosphorylase Kinase (PK). In the left-hand diagram, PK is in the inactive state, with the kinase-containing alpha domains shown in red. The upper diagram shows the activation of PK through phosphorylation by Protein Kinase A during hormone signaling. This leads to a partially active enzyme. Similarly, calcium binding, shown in the lower diagram, also results in a partially active enzyme. Calcium plays a particularly important role in the activation of this enzyme in skeletal muscle. The process of muscle contraction causes the release of high levels of calcium into the cytoplasm. Thus, the presence of calcium within the cytoplasm of muscle cells indicates high energy demand, as the muscle is being called into action. This activates PK and stimulates the breakdown of glycogen within muscle tissue to help meet energy demands. Maximal activity is obtained with both calcium binding and phosphorylation.
This diagram by now should be quite familiar. It is yet another example of a tetrameric enzyme (where the "enzyme" composition is αβγδ) existing in two major states, an inactive T state and an active R state, with the interconversion regulated by allosteric effectors (Ca2+) and post-translationally phosphorylation.
A mechanism for the phosphorylation of a Ser in a substrate target protein (i.e glycogen phosphorylase) by the catalytic domain of the γ subunit of phosphorylase kinase is shown in Figure \(\PageIndex{13}\).

Figure \(\PageIndex{13}\): A mechanism for the phosphorylation of a Ser in a substrate target protein (i.e glycogen phosphorylase) by the catalytic domain of the γ subunit of phosphorylase kinase. https://www.ebi.ac.uk/thornton-srv/m-csa/entry/35/. Creative Commons Attribution 4.0 International (CC BY 4.0) License.
The * in the mechanism denotes the serine of the target protein.
Figure \(\PageIndex{14}\) below which shows an interactive iCn3D model of a truncated form of the rabbit phosphorylase kinase gamma subunit dimer bound to a peptide substrate complex (2PHK).
.png?revision=1&size=bestfit&width=510&height=471)
 Figure \(\PageIndex{14}\): Rabbit phosphorylase kinase gamma subunit dimer bound to a peptide substrate complex (2PHK). (Copyright; author via source). Click the image for a popup or use this external link: https://structure.ncbi.nlm.nih.gov/i...3wHapyHWEy7qi9
The phosphorylase kinase dimer is shown (gray and brown subunits). A non-hydrolyzable ATP analog (adenylyl imidodiphosphate, AMPPNP) in each subunit is shown as CPK-colored sticks. The backbone of two identical peptide substrates ( blue and cyan) with the sequence RQMSFRL (similar to the target sequence in glycogen phosphorylase and an ideal peptide substrate) is shown as a backbone trace, with the central Ser which gets phosphorylated shown as CPK-colored spheres. Active site residues are shown as CPK-colored sticks and labeled in each subunit.
We have been primarily discussing the regulation of glycogenolysis in the liver. However, in considering the activity of PK and its reactivity with Ca2+ ions, we should also consider the activation of glycogenolysis in skeletal muscle, as well. Of note, glycogenolysis in liver tissue and skeletal muscle has many differences. First, the G-protein coupled pathway is activated by different hormones. Liver tissue is responsive to Glucagon stimulation, as well as stimulation through the Epinephrine hormone signaling pathway. Glycogenolysis in skeletal muscle tissue, on the other hand, is only activated by the Epinephrine signaling pathway, but not by glucagon. This is because the liver is the primary organ responsible for regulating blood glucose levels. Thus, pancreatic signaling due to low blood glucose levels primarily targets glycogenolysis within the liver tissue. Both systems are responsive to Epinephrine, which is described in more detail below.
Epinephrine Signaling
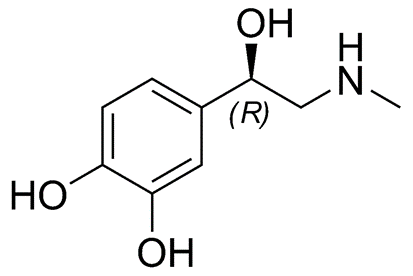
Epinephrine is a small amino acid-derived hormone (can you guess the amino acid?? Yes it is Tyrosine!!), as shown in Figure \(\PageIndex{15}\). It is also called adrenaline, as it is secreted from the adrenal glands located just above the kidneys, during the flight or fight response. It is also secreted during heavy or sustained exercise. Epinephrine has pleiotropic responses in the body, which include the activation of glycogenolysis in the liver and skeletal muscles. Epinephrine also promotes fat breakdown in adipose tissue, which releases this energy reserve into the bloodstream for utilization by muscle tissue. It also causes the relaxation of smooth muscles in the lungs and respiratory tract enabling better oxygen absorption. Cardiac contractility is also increased to increase blood flow to skeletal muscles. This supports the generation of ATP from glucose and fatty acids for sustained muscle utilization. It also reduces blood flow to the skin and causes the contraction of smooth muscles in the skin causing goosebumps.
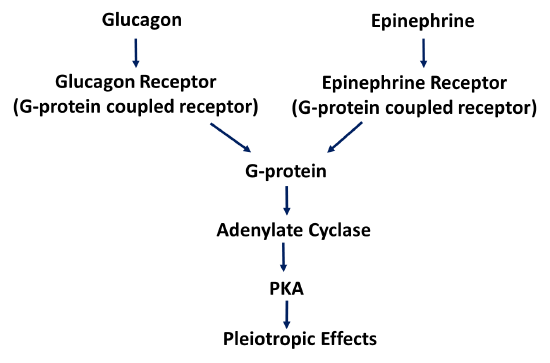
Within the liver and skeletal muscle, the epinephrine signaling pathway overlaps with the glucagon signaling pathway seen in the liver. The epinephrine receptor is also a G-protein coupled receptor related to the glucagon receptor. However, it is specific for epinephrine and cannot bind with glucagon. It does activate the same G-protein pathway leading to Protein Kinase A activation, as shown in Figure \(\PageIndex{16}\). The body is very efficient at reusing machinery in different parts of the body, in this case, it does so under different regulatory parameters.
The Glycogen Phosphorylase enzymes are also encoded by different genes within the Liver and Skeletal Muscle. These are known as isozymes. Recall, that isozymes have the same biological function, but since they are expressed from different genes, they have different enzyme kinetics and they are regulated in different and unique ways within each tissue.
The liver and skeletal muscle forms of Glycogen Phosphorylase share approximately 90% sequence identity. Yet again, both isozymes can exist in two major conformations, the a-form, and the b-form. The protein adopts the a-form when it is phosphorylated at Ser 12 by phosphorylase kinase, as shown in Figure \(\PageIndex{17}\). The Glycogen Phosphorylase enzyme can also be in two different states, the relaxed, flexible state which is the active form of the enzyme, and the tense or rigid state which is inactive. When the protein is in the a-conformation, it favors the relaxed and active state of the protein. Therefore, phosphorylation of Glycogen Phosphorylase leads to an increase in the activity of the enzyme. This is depicted in the following diagram.
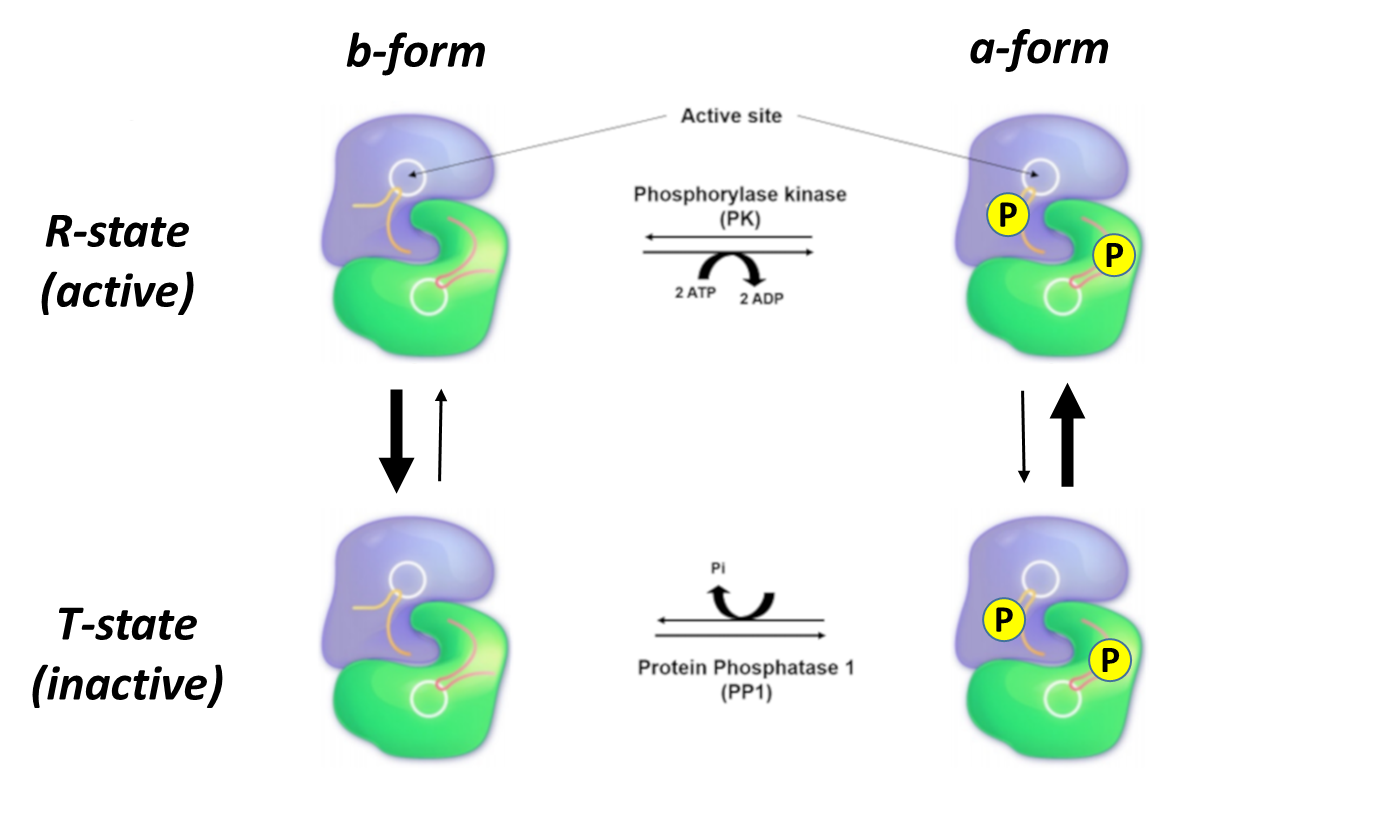
Another way to think about these four different enzyme states is that they exist in a dynamic equilibrium, with the population of each state determined by the phosphorylation state AND the presence of allosteric inhibitors and activators which we will explore below. In Figure 17 above, the R state is on top and the T state is on the bottom. The equilibrium between just those two states is indicated by the vertical arrows. The thickness of the arrows indicates the preferred direction of the reversible reaction. In the absence of phosphorylation (left-hand vertical states), the equilibrium favors the T or inactive form. When phosphorylated (right-hand vertical states) on Ser12 by the enzyme phosphorylase kinase, the R or active form is favored. The horizontal equilibria show the phosphorylation of the Ser12 by phosphorylase kinase (top, shown reversibly but the enzyme is not acting physiologically to remove phosphate) and dephosphorylation of Ser 12 by the enzyme protein phosphatase 1 (which acts physiologically only as a phosphatase).
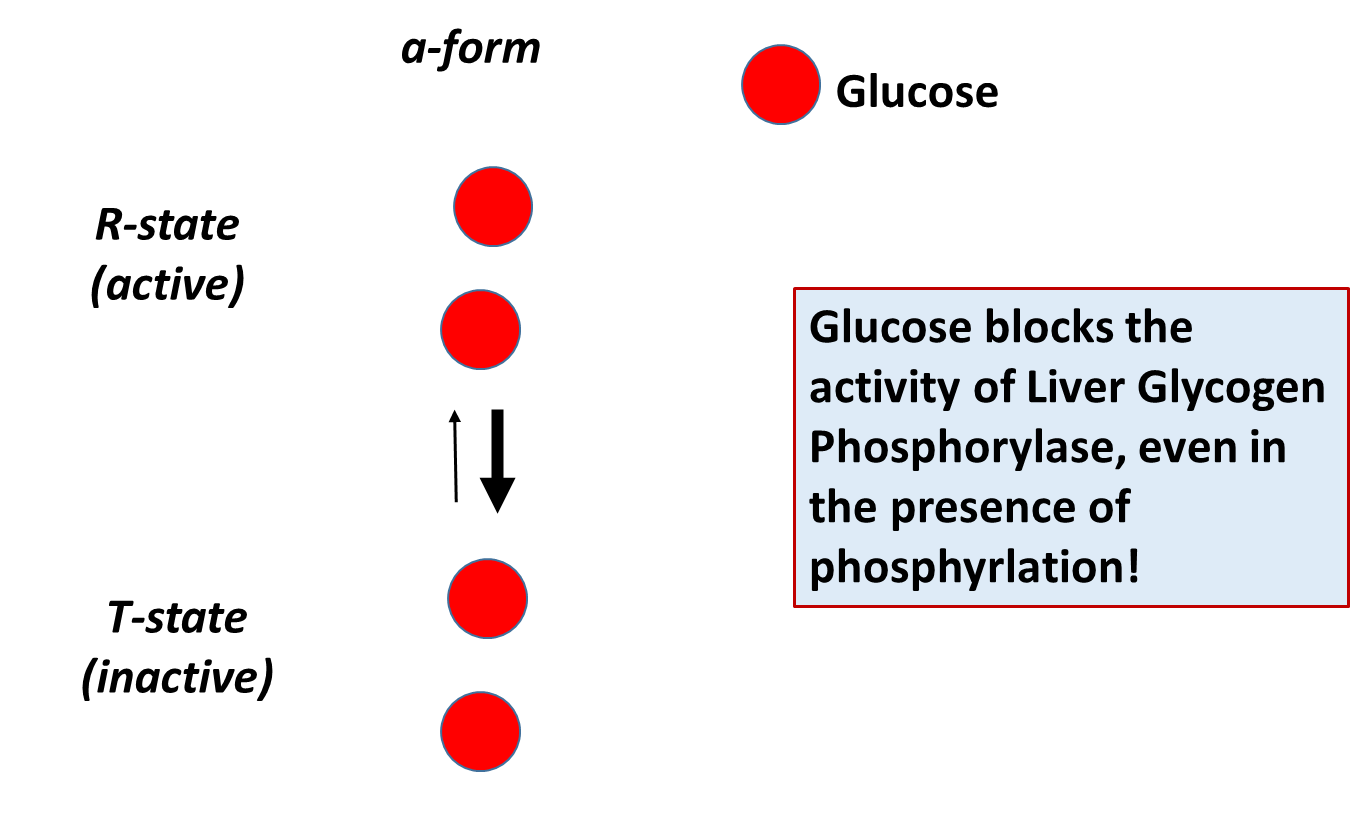
The different isozymes of the Glycogen Phosphorylase enzyme are also regulated by different, tissue-specific allosteric effectors. Within the liver, glucose is a negative regulator of Glycogen Phosphorylase, which makes sense, as the role of this pathway in liver tissue is to promote the release of glucose into the bloodstream. The presence of free glucose in the cytoplasm of the liver would indicate either the fed-state when blood glucose levels are high, or that high levels of glycogenolysis have released substantial glucose. Within liver tissue, the presence of free glucose will cause the a-form of Glycogen Phosphorylase to shift to the Tense state, reducing the activity of the enzyme. This is shown in Figure \(\PageIndex{18}\).
Skeletal muscle glycogen phosphorylase (or Myophosphorylase, as it is sometimes called), is more responsive to allosteric effectors that indicate the energy state of the cell. This makes sense, as the main purpose of glycogen breakdown in muscle tissue is to fuel the energy demand for the muscle tissue. Thus, the energy housed in glucose will be used to produce ATP within these cells. The presence of either glucose 6-phosphate or ATP within skeletal muscle indicates high levels of energy are present. Thus, glycogen breakdown will be inhibited. The presence of AMP, on the other hand, indicates a low energy state and is an activator of Glycogen Phosphorylase. This is shown in Figure \(\PageIndex{19}\) to Figure \(\PageIndex{21}\)below.
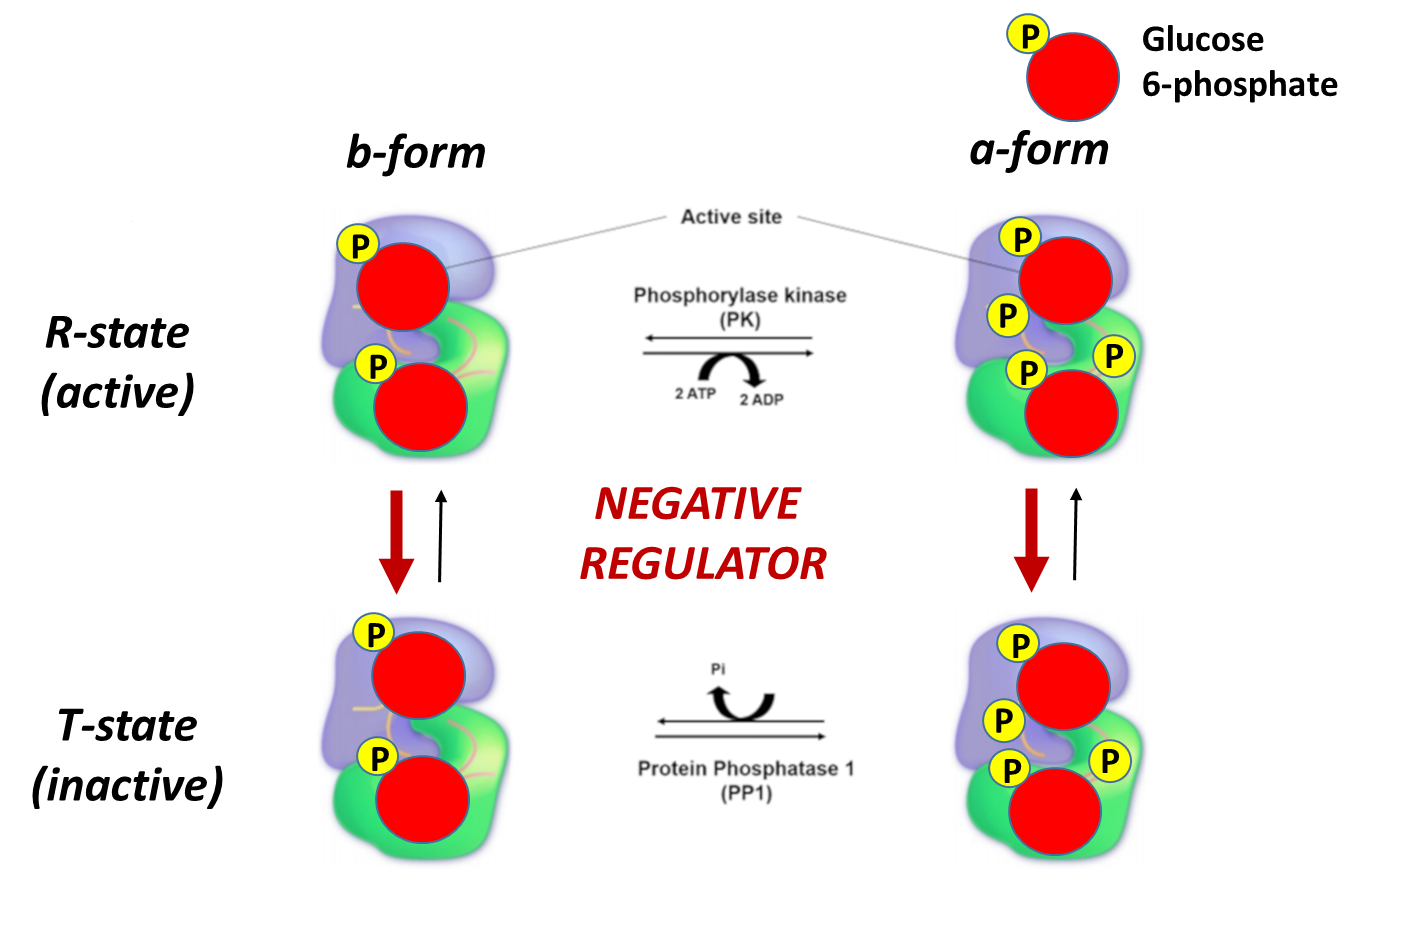
Again, note that the bold red arrows point downward, showing that on the addition of glucose-6-phosphate, the T state (inactive) is favored even if glycogen phosphorylase has been phosphorylated.
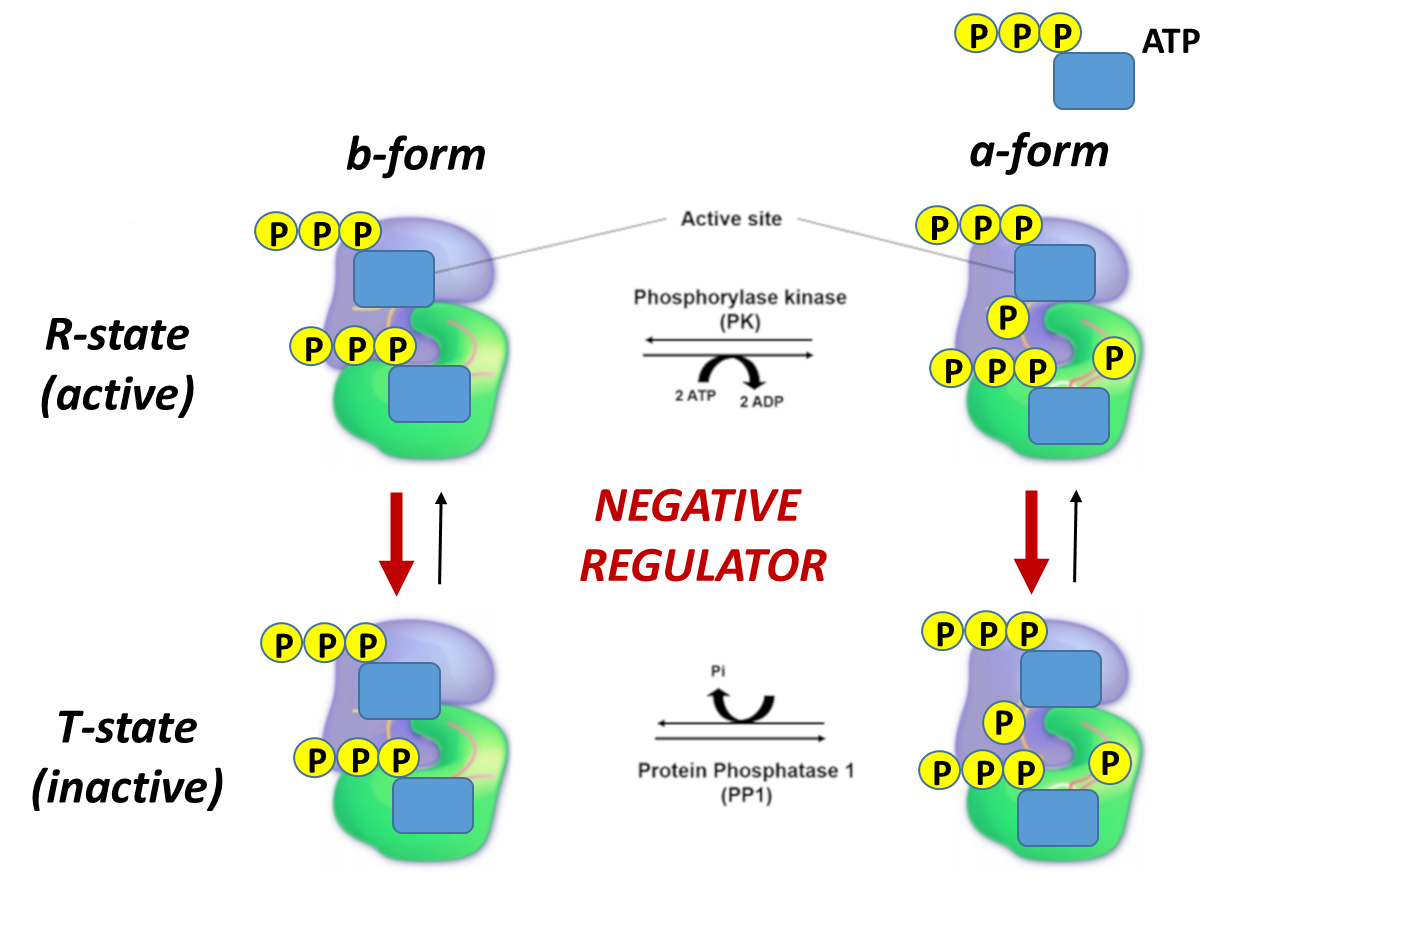
Again, note that the bold red arrows point downward, showing that when the ATP levels are high, the T state (inactive) is favored even if glycogen phosphorylase has been phosphorylated. Again, under conditions of a high energy state (as reflected by high ATP), there is no need to cleave glycogen to enter glycolysis.
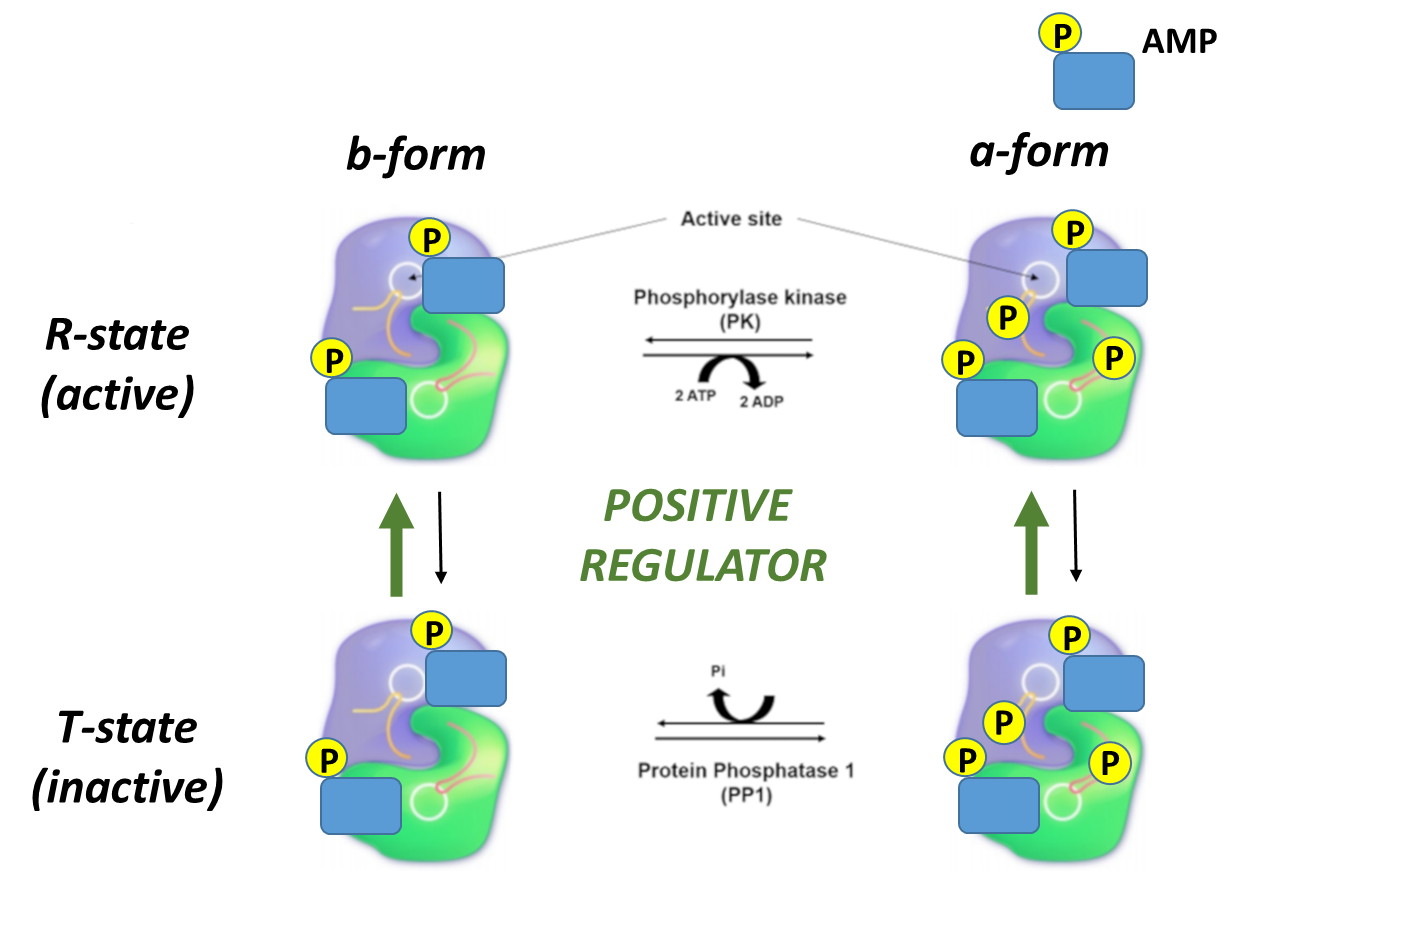
In contrast, note that the bold green arrows point upward showing that when the AMP levels are relatively high, the R state (active). Higher levels of AMP reflect a need to activate glycogen breakdown to increase ATP production.
A mechanism for the phosphorolysis of Glcn+1 to Glcn and glucose-1-phosphate is shown in Figure \(\PageIndex{22}\). Note the unusual presence of a molecule of pyridoxal phosphate covalently attached through a Schiff base linkage to Lys 568 (rabbit phosphorylase).

Figure \(\PageIndex{22}\): A mechanism for the phosphorolysis of Glcn+1 to Glcn and glucose-1-phosphate. https://www.ebi.ac.uk/thornton-srv/m-csa/entry/205/. Creative Commons Attribution 4.0 International (CC BY 4.0) License
PLP, which is covalently attached through a Schiff base, functions in this enzyme as a general acid and base, and not as a cofactor that facilitates covalent bond cleavage in amino acid substrates that are covalently attached to it (Chapter 6.8: Cofactors and Catalysis - A Little Help From My Friends).
It is important to note that the reaction is a phosphorolysis, not a hydrolysis, which would leave free glucose, which would more readily leave the cell and hence be less available for cellular energy needs and less available for glycolysis.
Figure \(\PageIndex{23}\) below which shows an interactive iCn3D model of a dimer of rabbit glycogen phosphorylase (1GDB).
.png?revision=1&size=bestfit&width=439&height=334)
Figure \(\PageIndex{23}\): Dimer of rabbit glycogen phosphorylase (1GDB). (Copyright; author via source). Click the image for a popup or use this external link:https://structure.ncbi.nlm.nih.gov/i...s1LosR5TJLjru9
The subunits in the dimeric form are shown in different colors. PLP is shown in spacefill. Active site residues are shown in both subunits as CPK-colored sticks and labeled.
Let's look at a monomer (from the tetramer) of 2 nonphosphorylated states of glycogen phosphorylase. Since they are both unphosphorylated, they both represent the b state. One (2GPB) has glucose bound, so it represents the inactive (T state). The other (3E3N) has AMP bound, so it represents the active (the R state). Figure \(\PageIndex{24}\) shows the conformation differences between the monomeric states
Figure \(\PageIndex{24}\): Conformational differences between the monomeric unphosphorylated b state of glucose-bound GP (T state, inactive) and AMP-bound GP (R state, active)
Now let's look at the conformations of two different GP activated by different means. In one, the nonphosphorylated form of GP (the b state, and inactive T state, ) binds AMP, an allosteric activator (pdb 8GPA), and converts to the active, b state (unphosphorylated R state). Let's compare its active conformation to a form of GP activated by phosphorylation (the phosphorylated a state, and active R state) to which just SO42- is also bound. In the 1st case, GP-b T state is driven to the active Gp-b R state by binding of the allosteric activator AMP. In the second case, GP-a is already in the R active state since it is phosphorylated. Figure \(\PageIndex{25}\) compares their conformations.
Figure \(\PageIndex{25}\): Comparison of the conformations of two active forms of GP - phosphorylase b bound to the allosteric activator AMP (R state) and phosphorylase a activated by phosphorylation of Ser 14.
The cyan monomer is glycogen phosphorylase b which is not phosphorylated but driven into the R state on the binding of AMP (note that two are bound at the periphery). The dark blue monomer is glycogen phosphorylase a which is phosphorylated at Ser14 (a different number in this crystal file which is shown in spacefill and labeled SEP-14) which is also in the R state. It also has two SO42- bound that help stabilize the state. Look carefully! the conformations are very similar to each other, in contrast to the different conformations for the T and R states shown in Figure 24.
Figure \(\PageIndex{26}\) below which shows an interactive iCn3D model of unphosphorylated (b state) rabbit glycogen phosphorylase with bound glucose (inactive T state, 2GPB).
_rabbit_glycogen_phosphorylase_with_bound_glucose_(inactive_T_state%252C_2GPB).png?revision=1&size=bestfit&width=456&height=397)
Figure \(\PageIndex{26}\): Unphosphorylated (b state) rabbit glycogen phosphorylase with bound glucose (inactive T state, 2GPB). (Copyright; author via source). Click the image for a popup or use this external link: https://structure.ncbi.nlm.nih.gov/i...eXQciAPczmQpLA
Only 1 monomer of the tetramer is shown. PLP and glucose are shown in spacefill, CPK colors, and labeled. Key active site residues are shown as colored sticks and labeled.
Figure \(\PageIndex{27}\) below which shows an interactive iCn3D model of unphosphorylated (b state) rabbit glycogen phosphorylase with bound AMP (active R state, 3E3N).
_rabbit_glycogen_phosphorylase_with_bound_AMP_(active_R_state%252C_3E3N).png?revision=1&size=bestfit&width=408&height=365)
Figure \(\PageIndex{27}\): Unphosphorylated (b state) rabbit glycogen phosphorylase with bound AMP (active R state, 3E3N). (Copyright; author via source). Click the image for a popup or use this external link: https://structure.ncbi.nlm.nih.gov/i...WDZJc1CcpFqEG7
Note the different locations for the binding site of the allosteric activator AMP compared to the inhibitor glucose in the previous model.
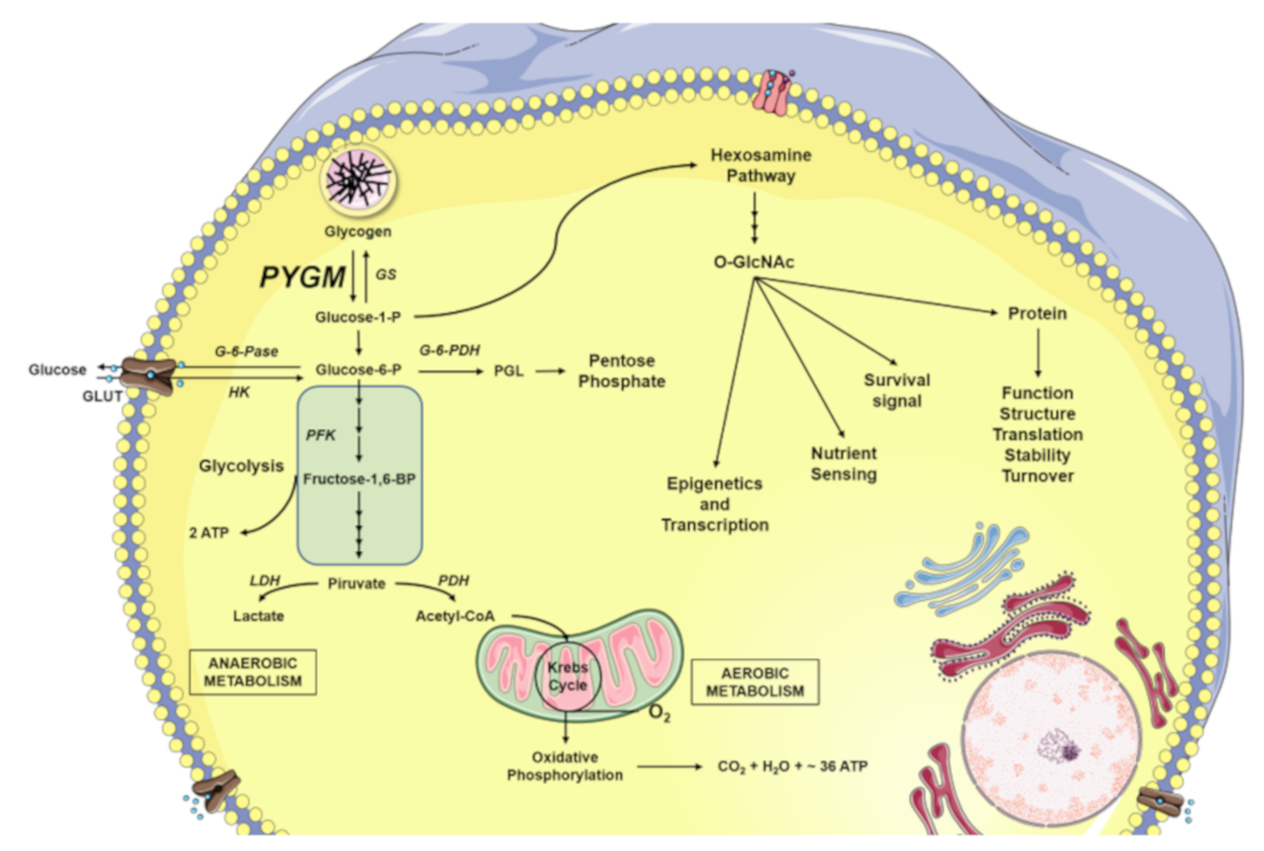
McArdle's Disease, also referred to as myophosphorylase deficiency or type V glycogen storage disease, is a recessive inherited disorder characterized by an inability to metabolize glycogen due to the absence of a functional myophosphorylase (PYGM). In Figure \(\PageIndex{28}\) shown below, the normal functional pathway is shown in blue, on the left, while the mutant pathway is shown on the right in red. Patients with this disease lack sufficient glucose-1-phosphate (G1P) monomers needed for glycolysis and the hexosamine biosynthetic pathway (HBP). This results in lower ATP and, consequently, lower muscle contraction, as well as in lower post-translational modifications by O-GlcNAcylation in comparison to normal conditions. This is especially pronounced during extended or heavy workouts, where people with McArdle’s Disease will sustain painful cramping of their muscle tissue during workouts, can have dark red/brown urine, and can easily tire during activity. Some patients also note a second-wind phenomena occur during workouts as the body shifts from carbohydrates to lipids as a primary energy source. The dark red/brown color in the urine happens if muscle tissue is damaged during the workout. The damaged muscle releases the protein myoglobin into the bloodstream. This is filtered out by the kidneys and excreted in the urine, causing the color change. The severe uncontrolled disease can cause life-threatening kidney problems.
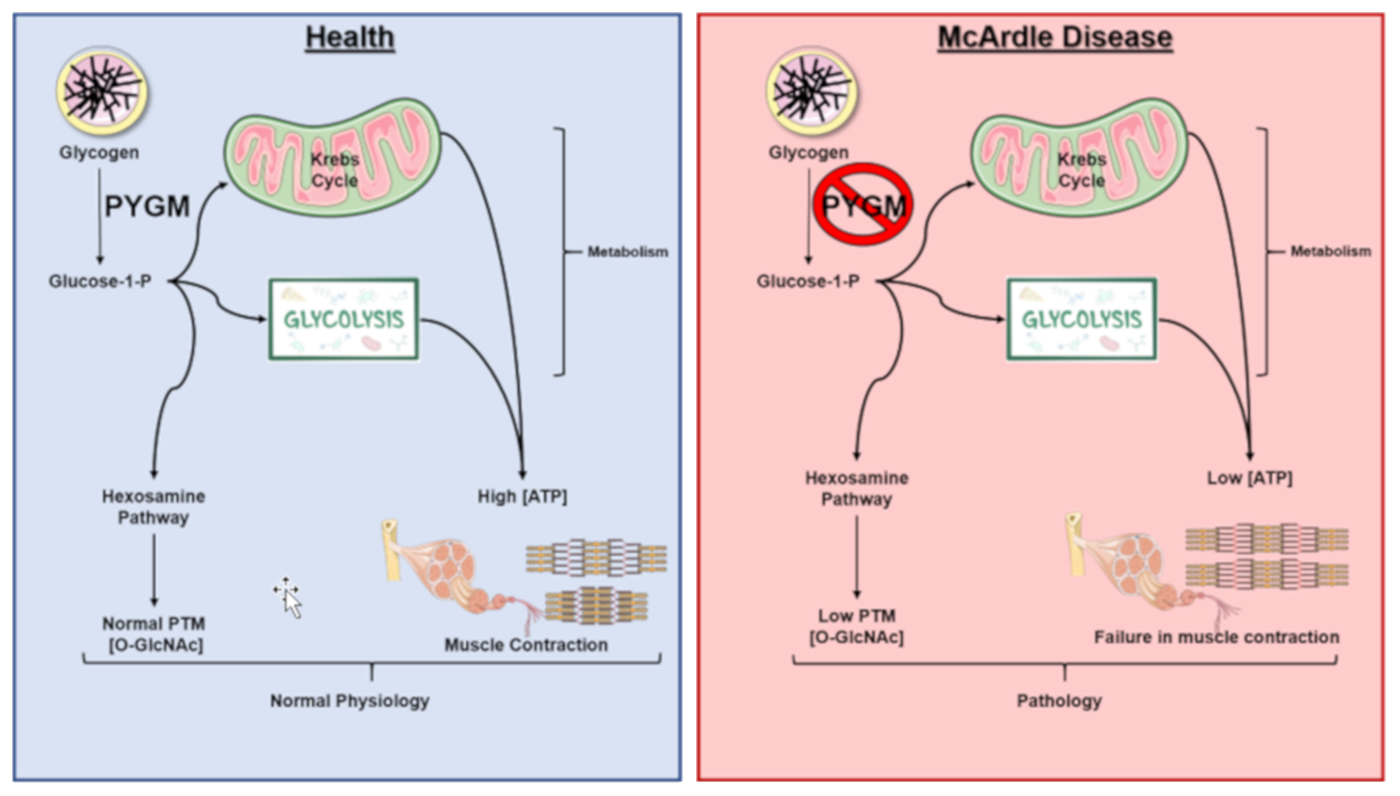
Figure \(\PageIndex{29}\) presents an overview of glucose metabolism in skeletal muscle. Both glucose-1-phosphate (G1P) released from the intracellular glycogen stores by glycogen phosphorylase (GP), as well as the glucose introduced into the cell through glucose transporters (GLUT) are converted to glucose-6-phosphate (G6P) by phosphoglucomutase (PGM) and hexokinase (HK), respectively. The G6P can be directed to different destinations. One of them is the pentose phosphate pathway for the formation of nucleic acid building blocks (ribose and deoxyribose). Another is in the formation of ATP. Here G6P enters the metabolic pathway of glycolysis. The glycolytic reactions culminate in the production of pyruvate and adenosine triphosphate (ATP). Pyruvate can be fermented to lactate by the catalysis of the lactate dehydrogenase (LDH), as happens during anaerobic muscle exercise. On the other hand, pyruvate can be used to obtain ATP through full oxidation in the Kreb Cycle. In total, oxidative phosphorylation produces between 30-36 molecules of ATP (depending on the organism and tissue), 6 molecules of carbon dioxide (CO2), and 6 molecules of water (H2O) from 1 glucose molecule. Glycolysis alone only produces two net ATP molecules per glucose. Glucose, in addition to being the main fuel of the cell’s energy metabolism, is also used by the cellular machinery as a vitally important substrate for the production of key intermediaries of the hexosamine biosynthetic pathway (HBP) forming O-GlcNAc, β-linked N-acetylglucosamine. And finally, in times of plenty, glucose will be utilized by glycogen synthase (GS) to make glycogen.