
32.13: Biochemistry, Climate Change and Human Health
- Page ID
- 101872

Search Fundamentals of Biochemistry
Introduction
Climate change affects human health and of course the health of the biosphere to which we are inextricably linked. Many, including the US CDC, describe the concept of One Health as "a collaborative, multisectoral, and transdisciplinary approach — working at the local, regional, national, and global levels — with the goal of achieving optimal health outcomes recognizing the interconnection between people, animals, plants, and their shared environment."
We all know that pollution from the use of fossil fuels also has severe health consequences independent of effects mediated more directly by climate change. A solution to both is to dramatically decrease the use of fossil fuels and mitigate pollution from their use. People most likely do not understand the extent which climate change and fossil fuel use are linked to human health. If they did, perhaps they would become advocates for climate change action. This section will cover how climate change and fossil fuel use affect aspects of human health and diseases. In this section, we will focus on heat-related illnesses and pulmonary/cardiovascular diseases. We'll tackle climate change, emerging diseases, and pandemics in the next chapter section.
Fossil fuel use and climate change obviously affect other diseases as well, some by indirect means For instance, increases in cancer deaths will occur due to lower availability of health care arising from extreme weather disasters that impact health facilities and peoples' access to them. An increase in cancer deaths occurred during the Covid pandemic since people deferred preventive healthcare treatments as well as cancer surgeries during the pandemic. Allergic illness will increase as growing seasons lengthen and species that cause allergic reactions shift to new growth regions.
Heat-Related Illness
Heat illnesses include heat cramps, heat exhaustion, heat syncope (fainting), and heat stroke, the latter of which can quickly become fatal. Heat affects normal physiology and health. It's estimated that about 1% of all cardiovascular deaths are linked to extreme temperatures. We know that the number of warm days and the number of heat waves has increased with climate change.
Figure \(\PageIndex{1}\) below shows how heat waves have changed in the US in the decades from 960 to 2022 using data from 50 large metropolitan areas. The 2020s is not even a third over but already shows increases in heat waves over the previous decade.

Figure \(\PageIndex{1}\): Climate Change Indicators: Heat Waves. EPA. https://www.epa.gov/climate-indicato...ors-heat-waves. Data source: NOAA (2022)
Many historical heat waves have occurred in recent times. A heat wave in Europe in 2003 caused 15,000 heat-exposure-related deaths in France and 70,000 throughout Europe. On June 28, 2019, France recorded a temperature of 45.9 °C (115 °F). In 2022 China experienced a two-month heat wave and drought, with a record temperature of 45 °C (113 °F) set in Chongqing. The Chicago Heat Wave of 1995, with a maximal temperature of 106 °F, caused by high temperatures and humidity, killed over 500 people. The worst might be the Russian Heat Wave of 2010 when temperatures were 5 °C (9 °F) higher than normal and reached 40 °C (104 °F). Around 55,000 people died.
Figure \(\PageIndex{2}\) shows temperature and excess mortality from the 2022 heat wave in Europe during which 60,000 people died from heat-related causes.

Figure \(\PageIndex{2}\): Weekly temperature and heat-related mortality numbers in Europe during the summer of 2022. Ballester, J., Quijal-Zamorano, M., Méndez Turrubiates, R.F. et al. Heat-related mortality in Europe during the summer of 2022. Nat Med (2023). https://doi.org/10.1038/s41591-023-02419-z. Creative Commons Attribution 4.0 International License. http://creativecommons.org/licenses/by/4.0/
Panel a shows the weekly baseline (gray line) and observed (black line) temperature (°C) averaged over Europe. Temperature anomalies are defined as the difference between observed and baseline temperatures (gray shading). Baseline temperatures were computed as the mean annual cycle of observed temperatures in the reference period 1991–2020.
Panels b and c show weekly heat-related mortality (weekly deaths) aggregated over Europe for the overall population (black), women (red) and men (blue) (b) and people aged 0–64 (blue), 65–79 (red) and 80+ (black) years (c), together with their 95% CIs (shadings). The numbers for women and men in b do not include the United Kingdom; values for the age groups in c do not include Germany, Ireland, and the United Kingdom.
Figure \(\PageIndex{3}\) below shows the steady increase in deaths as the average summer temperature in Europe has increased. The outlier in 2022 is shown as a red dot.

Figure \(\PageIndex{3}\): The summer of 2022 within the context of rising temperatures in Europe. Relationship between summer mean temperature (°C) and summer heat-related mortality (summer deaths) in the analyzed European countries. The straight line shows the linear fitting for the 2015–2022 period. Ballester et al., ibid.
In exercise studies under controlled conditions, the heart rate increases and plateaus after a temperature increase, but with further temperature increases, the heart rate increases with plateauing, which is a sign of cardiovascular strain. In humid conditions, cardiovascular strain develops even on slow walking at 34 °C (93.2 °F). Under dry conditions, the strain developed at around 41 °C (106 °F). The strain (as indicated by an increasing heart rate) proceeds by about 20 minutes a rise in core temperature.
With each temperature increase over pre-Industrial Revolution values, the annual probably of heat waves with apparent temperatures of 40 °C/104 °F (dangerous with a high incidence of heat cramps, heat exhaustion, and heat strokes) and 55 °C./131 °F (very dangerous with heat stoke very likely) increases, as shown in Figure \(\PageIndex{4}\) below.

Figure \(\PageIndex{4}\): Annual probability of occurrence of heat waves with apparent temperature (with contributions from humidity) peaks greater than 40 °C and 55 °C. Russo, S., Sillmann, J. & Sterl, A. Humid heat waves at different warming levels. Sci Rep 7, 7477 (2017). https://doi.org/10.1038/s41598-017-07536-7. Creative Commons Attribution 4.0 International License. http://creativecommons.org/licenses/by/4.0/.
Panels (a–c) show the probability of occurrence of heat waves with AT peak ≥ 40 (AT40C) calculated at each grid point for all model years with global mean temperature anomaly relative to 1861–1880 at 1.5, 2, and 4 degrees warming (see Fig. 2), respectively.
Panels (d–f) are similar to panels (a–c) but show the occurrence of heat waves with AT peak ≥ 55 (AT55C).
The USA released the 5th National Climate Assessment in 2023 which shows present and projected climate change and effects. Ones set of predictions is the change in number of days above 100 0F ( 38 0C) for different increases in the average global temperature since the pre-industrial revolution time, which is illustrated in Figure \(\PageIndex{5}\) below.
Figure \(\PageIndex{5}\): Change in number of days above 100 0F ( 38 0C) for different increases in the average global temperature since the pre-industrial revolution time. https://atlas.globalchange.gov/#explore.
The world has already reached or will within a few years (by 2025) a net increase of 1.5 0C (2.7 0F), which is shown in the map with the lightest red coloration. The other maps are for 2 0C (3.6 0F), 3 0C (5.4 0F), and 4 0C (7.2 0F). Note the significant change in going from just 1.5 0C (2.7 0F) to 2 0C (3.6 0F).
Heat Exposure and Kidney Disease
Cumulative exposure to high effective temperatures caused by sublethal combinations of heat and humidity leads to chronic kidney disease. This is happening with increasing frequency to workers in poor agricultural areas and others who work in such hot conditions in industry and outdoors. This type of kidney disease is not caused by diabetes, hypertension, and other known diseases of the glomeruli. Chronic kidney disease in such workers was noted in El Salvador and elsewhere in Central America. The disease has a high mortality rate. Just in El Salvador, the death from kidney disease is ten times higher than in the US. Initially, the disease was called Mesoamerican nephropathy.
Biochemical correlates of the diseases are yet unclear. Serum creatinine levels are increased, which might affect renal perfusion and lead to kidney damage. The effects might be generally cumulative or from repetitive episodes of exposure. Sugarcane field workers who report nausea, vomiting, headaches, muscle weakness, back pain, and fevers have high levels of creatinine. Kidney biopsies show inflammation and kidney fibrosis.
Similar diseases in other parts of the world that seem to have the same presentation include Sri Lankan nephropathy and Uddanam (in the Indian state of Andhra Pradesh) nephropathy. Some have categorized it as CKDu or Chronic Kidney Disease of Unknown etiology/Uncertain cause or as chronic kidney disease of non-traditional origin (CKDnt).
Figure \(\PageIndex{6}\) below shows the distribution of kidney disease in the Western Hemisphere in 2019.

Figure \(\PageIndex{6}\): Burden of Kidney Disease. 2019. Men and Women. Pan American Health Organization/WHO.
Other factors such as increased exposure to herbicides, heavy metals, and microbial agents might also cause or contribute to the disease. However, the disease is most prevalent in the hotter regions of affected countries, as the incidence is lower when workers work at high altitudes. Increased incidence of chronic kidney disease also appears to be occurring in workers in Florida and California.
Biochemical Mechanism for Heat Stroke
The actual biochemical mechanisms of heat stroke effects (circulatory failure, organ injury, uncontrolled clotting, death) are not fully understood. Certainly, cell death plays a major role, but not through the classical apoptotic pathway which depends on the activation of caspases (see Chapter 28.14). Rather, cell death occurs through necroptosis, a caspase-independent pathway. In necroptosis, an upstream protein kinase RIPK3 (receptor-interacting serine/threonine protein kinase 1) activates through phosphorylation the effector protein MLKL (mixed lineage kinase domain-like protein). Phosphorylated-MLKL then translocates to the cell membrane where it leads to calcium influx and plasma membrane damage in the final "execution" phase of cell necrosis.
The activation of RIPK3 and MLKL through other receptors, including the toll-like receptors (TLR3 and TLR4), and tumor necrosis factor receptor 1 (TNF-R1), is shown in Figure \(\PageIndex{7}\) below.

Figure \(\PageIndex{7}\): Activation of RIPK3 by multiple stimuli. Morgan MJ, Kim YS. Roles of RIPK3 in necroptosis, cell signaling, and disease. Exp Mol Med. 2022 Oct;54(10):1695-1704. doi: 10.1038/s12276-022-00868-z. Epub 2022 Oct 12. PMID: 36224345; PMCID: PMC9636380. Creative Commons Attribution 4.0 International License. http://creativecommons.org/licenses/by/4.0/
RIPK3 can be activated via various receptors when bound by their respective ligands. These are TNF receptor 1 (TNF-R1), CD95, death receptors (DR4/5), Toll-like receptors (TLR3/4), and Z-DNA-binding protein-1 (ZBP1)/DAI. In the first three of these pathways (but not TLR3/4 or ZBP1), RIPK1 is required and binds to RIPK3 through its receptor-interacting protein homotypic interaction motif (RHIM). In the case of ZBP1, RIPK3 is recruited directly via the ZBP1 RHIM domain, while in the case of TLR3/4, RIPK3 is recruited indirectly via the RHIM domain of TRIF. Once activated, RIPK3 autophosphorylates and then phosphorylates and activates MLKL to induce a conformational change and translocation to the membrane, where membrane permeabilization follows. During this process, post-translational modifications positively and negatively regulate the necroptosis pathway. Two E3 ligases, Pellino-1 (PELI1) and carboxy terminus of HSC70-interacting protein (CHIP), may control the basal threshold of necroptosis. Another E3 ubiquitin ligase, TRIM21, is proposed to be a regulator of necroptotic cell death in response to TRAIL. PPM1B suppresses necroptosis by dephosphorylating RIPK3.
The domain structure and phosphorylation sites on human RIPK3 are shown in Figure \(\PageIndex{8}\) below.

Figure \(\PageIndex{8}\): Meng, Y., Horne, C.R., Samson, A.L. et al. Human RIPK3 C-lobe phosphorylation is essential for necroptotic signaling. Cell Death Dis 13, 565 (2022). https://doi.org/10.1038/s41419-022-05009-y. Creative Commons Attribution 4.0 International License. http://creativecommons.org/licenses/by/4.0/
"Schematic of human RIPK3 domain architecture and the phosphorylation sites identified. Phosphorylation sites with proposed functions are shown at the top. pT224 and pS227 positively regulate necroptosis (green) by recruiting MLKL. pS164 and pT165 negatively regulate necroptosis by inhibiting RIPK3 kinase activity (red) [38]. Phosphorylation of T182 (grey) was proposed to promote RIPK3 kinase activity and to recruit PELI1 to mediate proteasomal degradation of RIPK3 [54]. Phosphorylation sites with unknown functions are shown on the bottom (white). Asterisks (*) denotes multiple serine/threonine on the same peptide, as such the exact site of phosphorylation could not be unambiguously identified."
Figure x shows a complex, the necrosome, containing multiple activated RIPK3s along with RIPK1. Aggregation of RIPK3 occurs through the RHIM (RIP homotypic interaction motifs) domain through the formation of amyloid fibers. The necrosome then phosphorylates MLKL, which forms oligomers and traffics to the membrane.
Figure x above also shows that an internal sensor protein for viral DNA can also activate RIPK3. That protein is ZBP1, or Z-DNA-Binding Protein 1, which also binds Z-RNA. Nuclear Z-RNA can derive from viruses like influenza A, leading to the activation of the same pathway. Cytokine expression then produces a systemic inflammatory response.
In addition to apoptosis and necroptosis, another type of programmed cell death caused by inflammation is called pyroptosis. Usually occurring in bacterial-infected macrophages, pyroptosis leads to the activation of intracellular inflammasomes, which then activate inflammatory cytokines through selective proteolysis by caspases. In pyroptosis, proteins called gasdermins are cleaved by caspases and their N-terminals self-associate in the cell membrane to form pores, from which the inflammatory cytokines IL-1β, and IL-18 are released.
A final programmed cell death pathway for virally-infected cells is called PANoptosis, which uses the PANoptosome complex with downstream results not explained by the other three programmed cell death pathways (pyroptosis, apoptosis, and necroptosis) ZBP-1 leads to the activation of RIPK3, caspase-8 (key in the apoptosis pathway) and the NLRP3 inflammasome.
ZBP-1 seems to play a key role in heat stroke. Its concentration increases with heat stress mediated by the heat shock transcription factor 1 (HSF1., which itself is induced by cellular stress. HSF1 induces a heat shock response which causes increased transcription of chaperones and heat shock proteins (HSPs) such as ZBP-1. Deletion/inactivation of ZBP-1, RIPK3, or MLKL and caspase 8 decreases heat stroke. The main role of ZBP-1 in cell death from heat stroke arises from the RIPK3/MLKL pathway and to less extent through cross-talk with the classical apoptosis pathway through caspase 8.
How does ZBP-1 activate cell death during heat stroke without binding to and activating dsDNA or RNA derived from a viral infection? Does ZBP-1 have an endogenous ligand other than viral Z-RNA or Z-DNA? Let's first explore the domain structures of some key proteins in the RIPK3 activation pathway. Figure 1 above shows three key proteins, RIPK1, TRIFF, and ZBP1 that interact with RIPK3. Each of these proteins and RIPK3 have a RHIM domain for protein-protein interactions. Figure \(\PageIndex{9}\) shows the domain structure of our key protein, ZBP-1, the cytosolic Z-DNA/Z-RNA sensor.
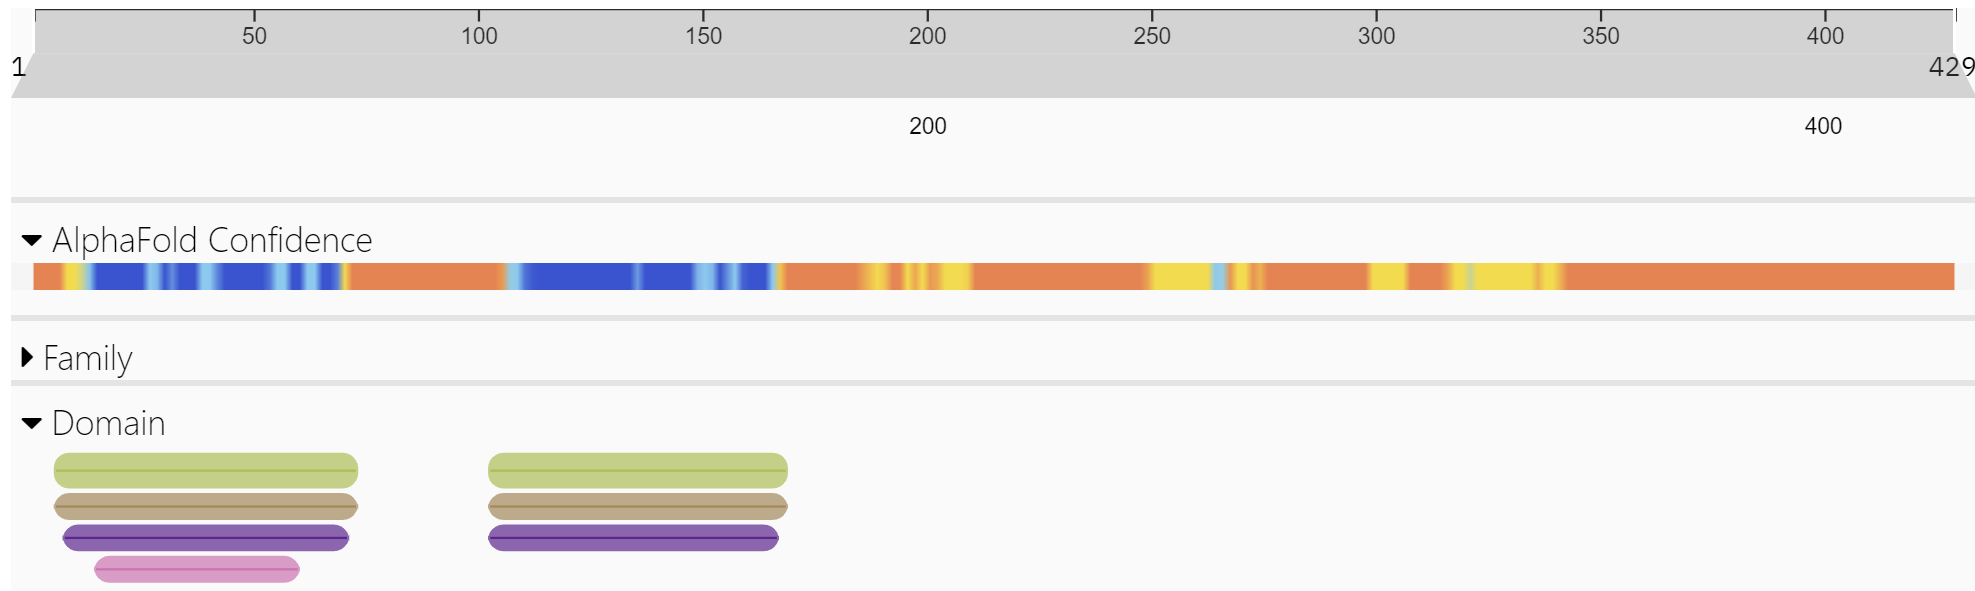
Figure \(\PageIndex{9}\): Domain structure of ZBP-1 (http://www.ebi.ac.uk/interpro/protein/UniProt/Q9H171/ )
The green bars in the N-terminal part of the protein are the Z-DNA binding domain. These are also called Zα domains. These regions are the most ordered in the protein, as indicated by the blue in the AlphaFold confidence bar.
Figure \(\PageIndex{10}\) shows an interactive iCn3D models of the AlphaFold-predicted model of human Z-DNA-Binding Protein 1 (ZBP1), (Q9H171)
-_(Q9H171.png?revision=1&size=bestfit&width=568&height=270)
Figure \(\PageIndex{10}\): AlphaFold-predicted model of human Z-DNA-Binding Protein 1 (ZBP1), (Q9H171). (Copyright; author via source). Click the image for a popup or use this external link: https://structure.ncbi.nlm.nih.gov/i...FMCRhJwHFVb1X7
The spacefill atoms labeled M1 represent the N-terminal methionine of the protein. The two Z-DNA binding domains follow, are well-ordered, and are shown as blue cartoons. Much of the protein can't be predicted as it is most likely intrinsically disordered. Two fairly well-structured motifs, shown in magenta and cyan are the RHIM1 and RHIM2 protein interaction motifs, which can be shown self-associated through their amyloid-like structures. These motifs allow ZBP1 to bind to other proteins with RHIM motifs and on to cell death through necrosis. The C-terminal domain appears to be involved in signal transduction type I interferon-mediated by DNA.
Figure \(\PageIndex{11}\) shows an interactive iCn3D model of the second Z-DNA binding domain of human DAI (ZBP1) in complex with Z-DNA (3EYI)
_in_complex_with_Z-DNA_(3EYI)V3.png?revision=1&size=bestfit&width=649&height=236)
Figure \(\PageIndex{11}\): Second Z-DNA binding domain of human DAI (ZBP1) in complex with Z-DNA (3EYI). (Copyright; author via source). Click the image for a popup or use this external link: https://structure.ncbi.nlm.nih.gov/i...SLBmo2xqV1WpS6
In the absence of viral DNA or RNA, the Zα domain can bind endogenous ligands. Moreover, it appears that a deficiency in RIPK1 or of the RHIM in RIPK1 also triggers ZBP1 to induce necroptosis and inflammation. and that its Zα domain is required. If nuclear export was stopped, ZBP1 activates nuclear RIPK3 and then necroptosis. This suggests that nuclear ZBP1 interacts with endogenous nuclear Z-nucleic acids, probably Z-RNA from retroelements to activate RIPK3-dependent necroptosis and could lead to some forms of chronic inflammation.
Here are a series of finding on RIPK3-dependent cell death on heat stress in mouse fibroblasts that show that Z-nucleic acid binding to ZBP1 is not required for heat stress effects:
- Heat (43°C for 2 hr) induces phosphorylation of RIPK3 and MLKL within 2 hours, and cleavage of pro-caspases and GSDME in 6 hours but none occurred if RIPK3 was deleted.
- Deletion of ZBP1 but not RIPK1, TRIF, affect heat induce death so so heat stress acts through ZBP1 and RIPK3.
- In mice without ZBP1, the effects of heat stress (clotting, inflammation, organ injury, and death) were prevented.
- Mutations in the RHIM domain, but not the Zα domains (made to prevent Z-nucleic acid binding) or in the C-terminal signaling region (to stop signaling) prevented death from heat stress . Hence Z-nucleic acid binding is not required but may contribute to cell death from heat stress.
- Heat stress caused the aggregation of a ZBP1-GFP (green fluorescent protein) fusion protein through the RHIM domains of ZBP-1
Hence ZBP1 is an innate pathogen sensor and also an initiator of heat-related death in the absence of pathogens.
Heat Stroke-Induced Epigenetic Changes
Short of death, heat stroke can also cause long-term health issues. Increasing global temperatures are forcing people to work at more dangerous temperatures and at night to reduce heat exposure. Data suggests that people who have had a heat-related illness are more susceptible to additional heat exposure health consequences. This has been noted in exertional heat illnesses. (such as in athletes). Additional long-term effects on immune regulation have been observed. Epigenetics may play a role in long-term effects such as greater vulnerability to additional heat challenges. Studies show that a single episode of exceptional heat stroke changes DNA methylation patterns in bone marrow-derived monocytes from mice. The monocytes become immunosuppressed allowing for increased microbial disease and reduced heat shock responses. The epigenetic changes are passed onto progeny monocytes which also shows compromised function. The epigenetic changes persist for 30 days or more and we clearly noted in inflammatory cell signaling pathways. This suggests a mechanism for the reduced tolerance to those with previous heat-related illnesses.
Cardiovascular and Pulmonary Diseases
Many factors can cause cancer and lead to mortality. For example, mortalities from cancer can increase due to lower availability of health care arising from extreme weather disasters that impact health facilities and access to them. Early detection of many cancers is key to survival. Instead of discussing climate change links to cancer we will focus on pollution and in particular small particles.
PM2.5 particulate pollution effects on cardiovascular and pulmonary health
Pollution from the combustion of fossil fuels contributes to many chronic diseases. Here we will focus on one type of pollutant, particulate matter which can be inhaled. These particles can be liquids, solids, or combinations of both. They are classified according to size with common categories including:
- PM10: diameters < 10 uM = 10,000 nm;
- PM2.5: fine particles with diameters < 2.5 um = 2500 nm
- PM0.1: ultra-fine particles with diameters < 0.1 um = 100 nm (also called nanoscopic particulate matter or NPM)
Figure \(\PageIndex{12}\) below shows the relative sizes of PM10 and PM2.5 particles compared to other biological structures.

Figure \(\PageIndex{12}\): Relative sizes of PM particles compared to biological structures. Sotirios Papathanasiou. Particulate Matter (PM2.5) Mega Guide. With Permission. https://seetheair.org/2022/05/16/par...-5-mega-guide/
Figure \(\PageIndex{13}\) below shows the relative sizes of PM0.1 particles compared to a PM2.5 particle.

Figure \(\PageIndex{13}\): Relative sizes of PM01 particles compared to a PM2.5 particle.Sotirios Papathanasiou, ibid.
Composition of PM2.5 particles
PM2.5 particles obtained by collection from polluted city air can actually be purchased from the National Institute of Standards and Technology (NIST, SRM1648a) and used for experimental studies on living cells. It is typically added to water and a suspension produced through sonication. PM2.5 particles are derived from human sources such as emissions from vehicles and industry, and both human-caused and natural processes such as the burning of biomass, and the release of dust from land. They can also include salts from land and ocean sources.
They arise from the burning of fossil fuels and wear and tear of products such as automobiles (including tires). PM2.5 particles contain mainly black carbon, polycyclic aromatic hydrocarbons (PAH), aryl hydrocarbon, volatile organic compounds (VOCs) as well as minerals, ions (sulfate, nitrate, ammonium), and general biological materials. The metal composition includes Group 1A (K, Na, Fr), Group 2A (Ca, Mg), Group 3A (Al), transition metals (Al, As, Cr, Fr, Mn, Pb, Ti, Zn), and counter ions Br and Cl. They also contain silicon and silicates. Of course, particles in the air, including dust, also derive from non-anthroprogenic sources. Atmospheric dust is also produced from land by winds and also by volcanic eruptions. In homes, dust has an abundance of dead skin cells. along with pollens, hair, fur, and fibers from clothes and paper. Humans have evolved with particulates in the air, but large increases in their abundance caused by human activities in many parts of the world pose serious health consequences.
In addition, the reaction of pollutants in the atmosphere produces "secondary" pollutants. One, the tropospheric gas ozone (O3) produced from hydrocarbons and nitrogen oxides, is a known health risk, and its levels are increased in cities on sunny, hot, and humid days. Secondary organic carbon (SOC) is also generated from primary organic carbon, typically volatile organic compounds (VOC) through oxidative photochemical reactions. These VOCs (like m-xylene and 1,2,4-trimethylbenzene) can produce aerosols (larger particles, called secondary organic aerosols by reacting with each other to produce larger structures. Terpenes containing isoprene units like α-pinene and limonene (a monoterpene found in large abundance in fruit peels) are reactants for the products of much larger structures. (See Chapter 10.1 and Chapter 21.6 for a review of isoprene and terpenes). Figure \(\PageIndex{14}\) below shows generalized pathways for the formation of particulate SOCs from smaller terpenes.

Figure \(\PageIndex{14}\): Proposed mechanisms for the formation of C20H33N3O12, C20H32N4O14, and C30H48N4O16 in the simultaneous oxidation (MIX) experiment. Takeuchi, M., Berkemeier, T., Eris, G. et al. Non-linear effects of secondary organic aerosol formation and properties in multi-precursor systems. Nat Commun 13, 7883 (2022). https://doi.org/10.1038/s41467-022-35546-1. Creative Commons Attribution 4.0 International License. http://creativecommons.org/licenses/by/4.0/.
Gas-phase mechanism via cross-reactions of α-pinene and limonene peroxy radicals (RO2·), and particle-phase mechanism via hemiacetal formation involving α-pinene and limonene oxidation products. APN-RO2, APN(=O), and APN(-OH) represent α-pinene oxidation intermediate (i.e., RO2·), α-pinene oxidation products with carbonyls, and α-pinene oxidation products with hydroxyl functional groups, respectively.
Figure \(\PageIndex{15}\) below shows the morphology of PM2.5 particles.

Figure \(\PageIndex{15}\): Morphology of PM2.5 particles. The scale bars are 20 μm for image (a) 2 μm for image (b) 1 μm for image (c) 40 μm for image (d). Shi, Y., Ji, Y., Sun, H. et al. Nanoscale characterization of PM2.5 airborne pollutants reveals high adhesiveness and aggregation capability of soot particles. Sci Rep 5, 11232 (2015). https://doi.org/10.1038/srep11232. Creative Commons Attribution 4.0 International License. http://creativecommons.org/licenses/by/4.0/.
Panel (a) shows a large area image of as-collected PM2.5 on the filamentary filter.
Panel (b) and (c) show SEM images of a particle with flat and rough top surface, respectively.
Panel (d) shows a SEM image of the PM2.5 transferred on a Silicon substrate. Inset, zoom-in SEM image of an Iron-rich particle.
Many of the PM2.5 particles have rough surfaces which can deform more easily interact with (i.e. stick to) other particles through noncovalent interactions to produce even larger particles.
Figure \(\PageIndex{16}\) below shows the elemental composition of rough, semi-rough, and flat PM2.5 particles.

Figure \(\PageIndex{16}\): EDAX Chemical composition histogram of the particles collected with SEM/EDAX classified by surface roughness; a larger surface roughness (and therefore, stickiness and deformation) are linked to a larger content of Carbon, while particles with a flat surface (low stickiness and viscosity) are richer in Oxygen and metals. Shi, Y. et al., ibid.
Figure \(\PageIndex{17}\) below shows electron micrographs of actual airborne particles. Most are PM2.5 particles with diameters < 2.5 uM = 2500 nm.

Figure \(\PageIndex{17}\): A collage of SEM images for airborne particulates. (A) General classification of airborne particulates; (B) particulates with seeds-coating composite morphology; (C) sulfate particulates with different morphologies. Clara Yuan Li et al, Journal of Environmental Protection, Vol.7 No.10, 2016. https://www.scirp.org/journal/paperi...?paperid=71021. Creative Commons Attribution 4.0 International License.
Given their composition and their structures, it doesn't take much thought to realize that the particles must cause significant health effects. Would you want to breath in these particles routinely?
Health Effects of PM2.5 Particles
PM2.5 particles are associated with just about every type of illness, including cardiovascular and pulmonary diseases, including asthma, as well as cancer. Since they are small, they can easily be inhaled and deposited in lung alveoli from where they can actually enter the bloodstream and be deposited in tissue. Particles up to 240 nm (0.25 uM) can cross the placenta and black carbon particles have been found to cross the placenta. PM2.5 particles can cause inflammation, DNA damage, organelle dysfunction and can also generate free radicals which are most likely involved in these toxic health effects.
Aerosol particles can even have acute and lethal effects. During The Great London Smog in London in December 1952, around 12,000 people died in two weeks from its effects. Figure \(\PageIndex{1}\) people in the thick smog from that event. The smog consisted of acidified water droplets arising from SO2 and NO2 released on burning coal that contains sulfur. This gas can be oxidized to sulfate in gas-phase reactions probably through the .OH free radical or in aqueous phase reactions using O3, peroxides, and NO2 as reactants/catalysts.
The reaction of SO2 with NO2 in aqueous droplets is shown below:
\begin{equation}
\mathrm{SO}_2(\mathrm{~g})+2 \mathrm{NO}_2(\mathrm{~g})+2 \mathrm{H}_2 \mathrm{O}(\mathrm{aq}) \rightarrow 2 \mathrm{H}^{+}(\mathrm{aq})+\mathrm{SO}_4^{2-}(\mathrm{aq})+2 \mathrm{HONO}(\mathrm{g})
\end{equation}
Given the stoichiometry of the reaction with NO2, the reaction proceeds significantly only in the presence of high NO2. The reaction is favored under high relative humidity. In large water drops in clouds, the droplets are not very acidic but as water evaporates from the drops, the sulfate concentration and acidity dramatically increase. However, as the acidity increases the rate of oxidation and the solubility decreases.
Major cities in China, including Beijing and Xian, have experienced high levels of haze and particulate matter in the atmosphere until recently. Yet these smogs were not lethal (very acidic) as in London due to the addition of NH3 in the droplets, which neutralizes the acidic particles. Atmospheric ammonia is derived from large amounts of agricultural fertilizers that get aerosolized and also from vehicles, which produce NH3 in catalytic converters and from urea used in the catalytic reduction in diesel engines. The relevant production of sulfates in the presence of NH3 is shown in the equation below.
\begin{equation}
\begin{aligned}
2 \mathrm{NH}_3(\mathrm{~g})+\mathrm{SO}_2(\mathrm{~g})+2 \mathrm{NO}_2(\mathrm{~g}) & +2 \mathrm{H}_2 \mathrm{O}(\mathrm{aq}) \rightarrow 2 \mathrm{NH}_4^{+}(\mathrm{aq}) + \mathrm{SO}_4^{2-}(\mathrm{aq})+2 \mathrm{HONO}(\mathrm{g})
\end{aligned}
\end{equation}
Figure \(\PageIndex{18}\) below shows a ghostly image of pedestrians in London during the Great Fog.

Figure \(\PageIndex{18}\): Ghost-like pedestrians making their way through the smog. https://heritagecalling.com/2022/12/...f-london-1952/. Public Domain
The prevailing weather conditions (cold temperatures) increased emissions from coal use. A stalled high pressure system and resulting low winds caused the buildup of stagnant air with increasingly acidic PMs. The appalling death toll led politicians to pass the Clean Air Act in 1954 which over many years led to huge improvements in air quality in London and dramatically reduced negative health effects and deaths. This was a prelude to the Clean Air Act in the US which dramatically improved air quality as well.
High levels of PM2.5s still are prevalent in much of the world, although there have been dramatic decreases in the US. The notable exceptions occur during forest fires that are exacerbated by climate change. In the US, the Air Quaility Index (AQI) is used as an indicator of health risk. It measures the value of 5 pollutants, fine particles (PM2.5 and PM10), ground-level ozone, SO2, NO2 and CO. The value of AQI at a given time is determined by which pollutant is highest. In haze produced by smoke, the reported AQI represents PM2.5 particles. AQI values < 50 or below represent good air quality, while an AQI value over 300 represents hazardous air quality. Western forest fires in Oregon in September 2020 lead to an AQI of 611 in Madras, Oregon. Forest fires in Eastern Canada, along with slow-moving weather system, led to PM2.5 levels over 800 (mg/m3) in New York City on June 7, 2023. No place is immune from PM2.5 particles from wild fires and human-caused pollution.
- AirNow - gives present pollution data, primarily PM2.5 levels, based on US zip codes
The following interactive graphs show the changes in PM2.5 particles over time (from Hannah Ritchie and Max Roser (2019), OurWorldInData.org/outdoor-air-pollution • CC BY. Source: Brauer et al. (2017) via World Bank).
Figure \(\PageIndex{19}\) shows the share of the population exposed to PM2.5 levels higher than those suggested by the World Health Organization.
Figure \(\PageIndex{19}\): Share of the population exposed to PM2.5 levels higher than those suggested by the World Health Organization.OurWorldInData.org/outdoor-air-pollution • CC BY. Source: Brauer et al. (2017) via World Bank
Figure \(\PageIndex{20}\) below shows the share of the population in the US and in India exposed to PM2.5 levels higher than those suggested by the World Health Organization.
Figure \(\PageIndex{20}\: PM2.5 levels in the US and India.Our World in Data. ibid
Finally, Figure \(\PageIndex{21}\) below shows the death rate from PM2.5/100,000 people in 2017 in countries around the world.
Figure \(\PageIndex{21}\): Death rate from PM2.5/100,000 people in 2017 in countries around the world.
Mechanisms for PM2.5 Health Effects
In Chapter 5.4, we discussed how solids such as silica, cholesterol crystals, uric acid crystals, and even aggregated proteins such as prions can be engulfed by monocytes/macrophages (much as they engulf bacteria as part of their immune function) in a process called phagocytosis. The particles are enveloped in plasma bilayer-derived membrane which buds off into the cell. This vesicle merges with a lysosome which gets damaged in the process. They then release ATP into the cytoplasm which acts as a damage signal to activate inflammation.
PM2.5 particles can also be taken up by phagocytosis to produce intracelluar phagosomes. They can also be taken up by pinocytosis, and caveolin and clathrin-mediated endocytosis to form endosomes. These can fuse with lysosomes and mitochondria and induce damage. The heavy metals from PM2.5 particles that are released into the cell also contribute to damage.
Smaller PM2.5 particles of diameter less than 0.1 uM (100 nM), sometimes called nanoscale particulate matter (NPM), offer large surface areas to which proteins can adhere. The adsorbed proteins form a "crown" called a protein corona. The corona is actually larger than the NPM. Proteins bounds to the particles include hemoglobin, albumin and fibrinogen. The corona also mediates cellular interactions and participates in the mechanisms that lead to inflammation and cellular dysfunction. As the extracellular matrix includes protein components such as collagen and fibrin, the interaction of PM2.5 with fibrin, has been studied as a model for how the particles might interact with cells. In particular, lung fibroblasts embedded in a 3D matrix of fibrin (i.e. a 3D organotypic culture) were exposed to NPM with protein coronas, and the effects of the NPM particles on cell proliferation, oxidative stress, etc. were monitored. Figure \(\PageIndex{22}\ below characterizes the interaction of the NPMs with the fibroblast in the 3D culture.

Figure \(\PageIndex{22}\): Physicochemical characterization of airborne particulate matter. Li, Y., Wang, P., Hu, C. et al. Protein corona of airborne nanoscale PM2.5 induces aberrant proliferation of human lung fibroblasts based on a 3D organotypic culture. Sci Rep 8, 1939 (2018). https://doi.org/10.1038/s41598-018-20445-7. Creative Commons Attribution 4.0 International License. http://creativecommons.org/licenses/by/4.0/.
Panel (A) shows SEM images of airborne PM2.5 (nanoscale PM2.5 is marked in red).
Panel (B) shows a chemical element analysis of PM2.5 by EDX analysis.
Panel (C) shows an atomic force microscopy (AFM) image of nanoscale PM2.5 (NPM) from air pollutant samples (scale 3.5 μm).
Panel (D) AFM image of airborne NPM from air pollutant samples (scale 1 μm).
Panel (E) shows an SEM image of airborne NPM from air pollutant samples.
Panel (F) shows an SEM image of an NPM-protein corona.
Panel (G) shows a schematic diagram of the biological interaction between NPM and protein.
Panel (H) shows a FTIR spectra of NPM, serum, and NPM-protein corona.
The NPM-protein corona particle leads to the proliferation of the 3D-cultured human lung fibroblast cells over and above stimulation of the cells with just NPMs or serum alone. The bigger the size of the corona, the greater the proliferative effect. This is consistent with the extensive fibrosis of the lungs seen after chronic exposure to PM2.5 particles. Reactive oxygen species also increased in the presence of NPM-corona particles. These data suggest that NPM-protein corona are important in PM2.5-induced lung fibrosis and pulmonary disease.
Neural Effects of PMs
PM particles, particularly the ultrafine PM0.1 particles (UFP), can enter the brain, and affect neural function. Exposure to PM2.5 over long periods of time is associated with increased incidence of dementia and Alzheimer's Disease (AD). Four particular components of PMs (SO42−, NH4+, black carbon, and organic matter) were most associated with a higher risk of dementia and AD. In the US, the first admission to a hospital for Parkinson, AD, and other dementia is "significantly" associated with the average annual mean PM2.5 exposure.
Even low levels of exposure pose risks. Transgenic mice containing mutant forms of human presenilin 1, amyloid precursor protein, and the tau protein, were exposed to subchronic, "real-world" levels of PM2.5 through inhalation for 3 months. Neuronal loss was observed in the cortex but no motor or cognitive impairment was noted. Increased levels of phosphorylated forms of Tau were observed and free radical formation, as evidenced by levels of malondialdehyde (a marker of oxidative stress), was seen in the hippocampus and olfactory centers, consistent with inhalation of PM2.5 through the noise. No abnormal amyloid plaques were observed in this short exposure time.
PMs damage to neurons occur through the generation of reactive oxygen species increased inflammatory responses and organelle damage (all of which are interrelated). Even in skin cells (keratinocytes), exposure to PM2.5 particles led to increased levels of ROS and malondialdehyde, decreased levels of superoxide dismutase, and increased DNA damage. Inflammatory Caspase levels also increased.
Cells have mechanisms to detect and eliminate aberrant species before they led to worse biological effects. One process is autophagy which degrades misfolded protein and damaged organelles, processes important for normal neural function. Aberrant autophagy is a key player in the pathogenesis of dementia. A second pathway is ferroptosis, a kind of apoptotic pathway, which kills cells that have accumulated large amounts of iron ions, which of course are free radicals themselves. Through the Fenton reaction and others, iron ions can lead to the generation of damaging reactive oxygen species and oxidation of lipids, proteins, and nucleic acids (see Chapter 12.3).
Several key proteins are involved in antioxidant defense and autophagy:
- NRF2 (Nuclear factor erythroid 2-related factor 2): This transcription factor binds to antioxidant response elements (ARE) in front of protective genes.
- Keap1 (Kelch-like ECH-associated protein 1): An adapter program that targets NRF2 for ubiquitination and as such is a sensor for oxidative stress. Under those conditions, electrophilic metabolites lead to post-translational modification of reactive Cys side chains which leads to the inactivation of ubiquitin ligase activity. This increases NRF2 and subsequent transcription of antioxidant genes.
- SQSTM1 aka p62 (Sequestosome-1): This protein bridges autophagosomes and polyubiquitinated proteins (cargo for degradation).
Hence under low oxidative stress, NRF2 are low through its degradation mediated by KEAP1. If SQSTM1 (p62), increases, and reduced autophagy, p62 biding to the NRF2 sites on KEAP1, leading to the release of NRF2, its transfer to the nucleus, and activation of gene transcription of protective genes. These three proteins also protect cells from ferroptosis. In the long term, neural cell death occurs during dementia. Hence apoptosis, necroptosis, and pyroptosis (from activation of the inflammatory response mediators capspase, Gasdermin, and key cytokines like IL-1β and IL-18) do "win out" to eventually kill cells.
Figure \(\PageIndex{23}\) below shows the domain structure of SQSTM1 (panel A) and the signaling process described above.

Figure \(\PageIndex{23}\): Positive feedback-loop of Nrf2 activation by p62/SQSTM1. Vomund S, Schäfer A, Parnham MJ, Brüne B, von Knethen A. Nrf2, the Master Regulator of Anti-Oxidative Responses. Int J Mol Sci. 2017 Dec 20;18(12):2772. doi: 10.3390/ijms18122772. PMID: 29261130; PMCID: PMC5751370. Creative Commons Attribution (CC BY) license (http://creativecommons.org/licenses/by/4.0/).
Panel (A) shows the domain structure of p62/SQSTM1;
Panel (B) shows p62/SQSTM1 as an important protein for selective autophagy, as binds to Keap1 and other long-lived proteins and forms polyubiquitinated protein aggregates. Furthermore, it binds to the autophagy marker LC3 within the autophagosome, thereby leading the aggregated proteins into the autophagosome. After fusion with a lysosome, proteins and organelles, such as mitochondria, are degraded within the autophagosome. By binding to Keap1, p62/SQSTM1 stabilizes Nrf2 and enhances its translocation into the nucleus, where Nrf2 activates its target genes (↑ = upregulation of Nrf2 target genes). One of these genes is p62/SQSTM1
PM2.5 particles intefer with the protective autophagy and ferroptosis pathways, leading to increased NRF2 activity and expression of antioxidant genes which are beneficial processes to rid cells of aberrant particles and kill damaged cells in normal conditions but not on exposure of neuronal cells to PM2.5 particles.
Lysosomal membrane permeabilization (LMP) as well as mitochondrial and ER damage might be a likely mechanism to initiate ultimate neuronal death on long-term exposure to PM2.5 particles. PM2.5 particles inhibit lysosomal activity and increase their permeability and release to degradative enzymes into the cytoplasm. Ultimately increased or decreased activation of Nrf2 lead to disease states.
PMs and Cancer
Long-term exposure can also cause lung cancers. This is associated with a conversion of lung cells from normal epithelial to mesenchymal cells (called the EMT transition). Phenotypically, mesenchymal cells can migrate, invade other tissues and cause enhanced production of the extracellular matrix, all hallmarks of tumor cells. This EMT transition is associated with significant changes in cell signaling and the production of transcription factors. These changes are documented in Figure \(\PageIndex{24}\) below and its caption.

Figure \(\PageIndex{24}\): Brief schema of the putative signaling transduction mechanisms underlying EMT. Xu et al., Front. Physiol., 29 November 2019. Sec. Renal Physiology and Pathophysiology. Volume 10 - 2019 | https://doi.org/10.3389/fphys.2019.01404. Creative Commons Attribution License (CC BY)
Activation of the Wnt/β-catenin, PI3K/Akt, Ras/ERK, TGF-β/SMAD2/3, BMP/SMAD1/5/8, JAK/STAT3, Shh, and Notch pathways is highly correlated with EMT. After ligand-receptor binding, intracellular secondary messengers are activated and initiated downstream transduction, which generally induce the nuclear translocation of signaling-specific TFs and the transcriptional regulation of EMT-related genes, such as CDH1 and CDH2, EMT TFs, and mesenchymal markers, accompanied by a series of alterations on cellular physiological or pathological activities (e.g., dysjunction of adherin junctions, cytoskeleton remodeling, and increase of cellular motility). Arrows represent the molecular interactions in which downstream messengers are activated; T shape arrows represent inhibitive molecular interactions. EMT, epithelial-mesenchymal transition; PI3K, phosphoinositide 3-kinase; ERK, extracellular signal-regulated protein kinase; TGF-β, transforming growth factor β; JAK, Janus kinase; Shh, sonic hedgehog; TFs, transcription factors.
PM2.5 particles and their deleterious contents (heavy metal ions, PAHs, etc), as well as ROS generated by them are associated with the changes seen in the EMT transition. These include activation of transforming growth factor β (TGF-β)/SMADs, NF-κB, growth factor (GF)/extracellular signal-regulated protein kinase (ERK), GF/phosphatidylinositol 3-kinase (PI3K)/Akt, wingless/integrated (Wnt)/β-catenin, Notch, Hedgehog, high mobility group box B1 (HMGB1)-receptor for advanced glycation end-products (RAGE), and aryl hydrocarbon receptor (AHR) signaling cascades and to cytoskeleton rearrangement.