

28.12: mTOR and Nutrient Signaling
- Page ID
- 75922


Introduction: mTOR and AMPK
Imagine when you were in high school, you weighed 135 pounds (61 kg). Let's say it's 50 years later and you still weighed 135 pounds. In the intervening years, think of how much food and liquid you consumed. In 2011, the USA Food and Drug Administration indicated that the average American consumed about 2000 pounds (907 kg) each year, including liquids other than drinking water. (Compare this to 365 kg for someone in Somalia!) So over 50 years you would have consumed 100,000 lbs (45,400 kg) of food or 740 times your body weight. These numbers are essentially unchanged even if you gained one pound a year for a total of 50 pounds.
These figures suggest that we have an elaborate system that regulates how much we eat and how much weight we gain or lose. There are obvious times in our lives when we are growing and actively gaining body mass. Incoming food is not only processed into energy but also into net protein, lipid, carbohydrate, and nucleic acid synthesis. This system has become dysregulated in an ever-increasing number of people with type II diabetes and obesity throughout the world. Obvious candidates for regulators in general of net body weight and in specific of protein and lipid synthesis are the nutrients we consume and store. Many systemic hormones and neurotransmitters are involved in hunger, satiety, and eating behavior. This chapter will not focus on those but rather on mechanisms of nutrient signaling pathways in growth which requires new protein, lipid, and nucleic acid synthesis for cell growth and division. Likewise, it will not focus on nutrient signaling through hexosamines and UDP-GlcNAc.
A key player in these signaling pathways is mTORC (mammalian or mechanistic Target Of Rapamycin Complex). A key protein in this multiprotein complex is mTOR, a Ser/Thr kinase that regulates cell growth, division, protein synthesis, RNA synthesis (transcription), and even autophagy (the major process whereby cells die and their contents are recycled for use). There are two physiologically relevant complexes of mTOR, mTORC1, and mTORC2. These two complexes have been called the master regulators of metabolic and growth processes.
- mTORC1 activates protein, lipid, and nucleotide synthesis, all required for cell growth and division; it is inhibited by rapamycin. For activation, it needs two obvious conditions: energy and growth factors. In addition, it needs amino acids.
- mTORC2 activates many processes through phosphorylation; it is not inhibited by rapamycin.
What is Rapamycin? It sounds like an antibiotic but it is an antifungal agent produced by certain bacteria as a defense against fungal (eukaryotic) pathogens. It blocks cell division in fungi by stopping cell growth. The cell cycle consists of the following general sequential steps: (Go-G1)→S →G2→M→ G1. Gap 0 (Go) is a quiescent phase outside of the cycle. In G1, cells are growing and preparing for DNA synthesis which occurs in the S phase. After DNA replication/synthesis (S phase), cells grow again and prepare for mitotic cell division (M phase). Rapamycin traps fungal cells in the G1 phase. It also traps mammalian cells, and in particular immune lymphocytes in G1 as well, preventing lymphocytes from dividing. Hence rapamycin has been used to prevent rejection of transplanted tissue as it suppresses the immune system. Rapamycin inhibits mTORC1. That it inhibits mTOR is consistent with its immunosuppressive (antigrowth and antiproliferative) effects
Another key player regulated by mTOR is the energy sensor AMP Protein Kinase (AMPK). We will discuss both below.
mTOR Inhibition by Rapamycin
The structure of the mTORC1 complex is complex itself, in part, since some of its components were studied and named before their roles in the mTORC1 complex were elucidated. Investigators were interested in the molecular target(s) of rapamycin. Yeast (a fungus) was an easy organism to study using genetic techniques. Three genes were found that when mutated inhibited the effect of the inhibitor rapamycin (i.e. so that rapamycin did not inhibit mTOR). Two of these were the Ser/Thr kinases mTOR1 and mTOR2. The other was an analog of a protein found in humans (FK Binding Protein 12 - FKBP12). The family of FK binding proteins act as protein chaperones and have Pro-X peptidyl-prolyl isomerase activity (PPI). FKBP12 specifically binds a drug (FK506 also called Tacrolimus) that is an immunosuppressant (do you see the general link with immune cell division and growth?). The binary complex of FK506 and FKBP12 binds a third protein, a phosphatase called calcineurin, and blocks its phosphatase activity and signal transduction required for T cell activation and proliferation. This activity of FKBP12 strangely does not require its PPI activity.
Now back to mTORC1. Here are the known components of the core complex:
- mTOR, a Ser/Thr kinase;
- Raptor, a Regulatory-associated protein of mTOR; modulates the specificity of the kinase;
- mLST8, the mammalian lethal with SEC13 protein 8 (also called Mammalian Lethal With SEC13 Protein 8 e
In addition, other proteins associate with the core complex
- PRAS40, a proline-rich Akt substrate of Akt
- DEPTOR, DEP Domain Containing MTOR-Interacting Protein (where DEP is Disheveled, Egl-10 and Pleckstrin domain found in these 3 proteins and others involved in G-protein signaling)
- FKBP, which binds rapamycin.
mTORC2 is not sensitive to rapamycin. Instead of RAPTOR, it has a protein called RICTOR (rapamycin-insensitive companion of TOR).
Figure \(\PageIndex{1}\) shows an interactive iCn3D model of the human mTORC1 containing mTOR, Raptor and mLST8 bound to FK506 binding protein (FKBP)-rapamycin complex (5FLC)
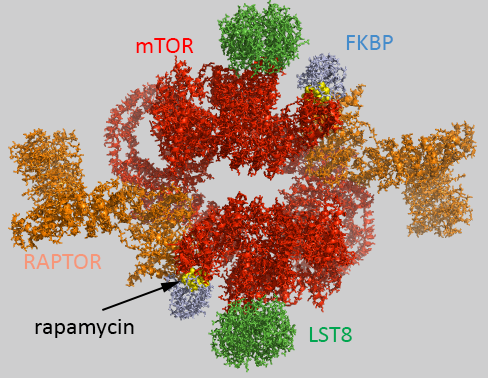
Figure \(\PageIndex{1}\): Human mTORC1 containing mTOR, Raptor and mLST8 bound to FK506 binding protein (FKBP)-rapamycin complex (5FLC). Click the image for a popup or use this external link https://structure.ncbi.nlm.nih.gov/i...iSuYwaymutw867
The complex acts physiologically as a dimer with rotational C2 symmetry. The static image in Figure \(\PageIndex{1}\) is color coded as below. The iCn3D image is similarly.
- chains B ,F ,1-4: pieces of mTOR (mol ID 1-3) as a homodimer - Red;
- chains A and E: Raptor (mol id 4) orange;
- chains D and H: LST8 (mol id 5) green;
- chains C and G: FKBP (mol id 6) light blue;
- rapamycin in C and G, yellow spacefill.
Raptor has been likened to tape as it interacts with the two mTOR subunits, holding them together into a larger, donut-like structure, and stabilizing the dimer.
How does rapamycin inhibit mTOR? You have studied many kinds of inhibitors (competitive, uncompetitive, mixed, or noncompetitive inhibition) in which the inhibitor binds to either free E or the ES complex. The figure above suggests that rapamycin binds at the interface of the mTOR kinase (red) and FKBP. Presumably the RAP:FKBP complex binds to mTOR.
Figure \(\PageIndex{2}\) shows how rapamycin (shown in sticks) is sandwiched between mTOR (red) and FKBP (light blue). This offers clues as to how it inhibits mTOR. The rapamycin:FKBP complex is an allosteric inhibitor with its effect dependent on both substrate and post-translational phosphorylation.
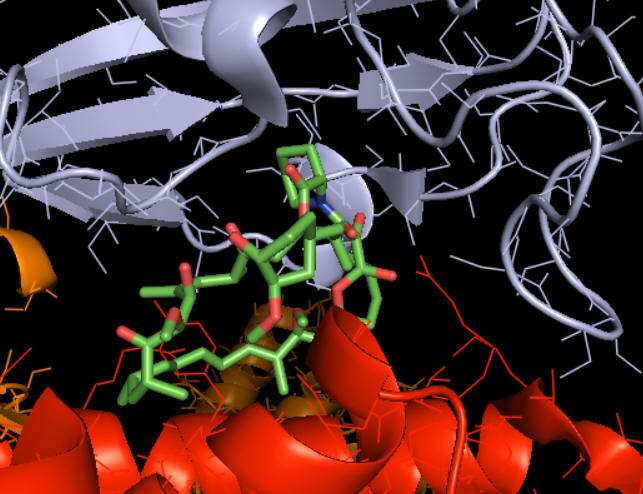
Right across from the light blue FKBP protein is the green LST8 protein (see above). In between these is a cleft which is the active site. One could imagine that RAP:FKBP binding to mTOR might interfere with substrate binding in mTORC1 but not in mTORC2. RAPTOR in mTORC1 probably helps recruit substrates and hence is involved in the determination of substrate specificity. RAPTOR interacts with a short section called the TOR signaling (TOS) motif in mTORC1 substrates. The part of RAPTOR that binds TOS in substrates is at the base of the mTORC1 active site, probably narrowing it further as it provides exquisite substrate selectivity.
mTOR Protein Kinase Structure and Activity
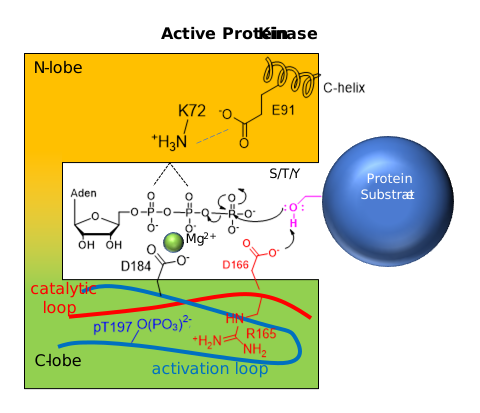
How does the structure of such an important kinase (mTOR) differ from other kinases? Remember that there are 388 S/T Kinases, 90 Y Kinases, and 40 atypical protein kinases in the human genome. The generic structure is shown below with ATP and substrate binding between N- and C-terminal lobes. The C lobe has a catalytic lobe which contains an Asp side chain acting as a general base in nucleophilic attack on the gamma P of ATP. A disordered activation loop in the C lobe often prevents substrate binding to the enzyme and keeps the kinase in an inactive state. On phosphorylation of the activation loop or elsewhere, or substrate binding, conformational changes lead to movement of the activation loop away from the active site, activating the kinase activity. The structure of generic kinases is shown in Figure \(\PageIndex{3}\).
Compared to generic protein kinases, mTOR has several insertions (about 200 amino acids) into the protein sequence and these must be involved in the determination of its specificity toward protein substrates. The C-terminal domain structure of the mTOR kinase is shown in Figure \(\PageIndex{4}\).
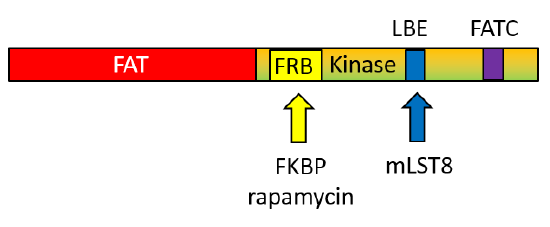
The FAT domain precedes the mTOR kinase domain. The FRB is inserted into the N lobe of the kinase domain whereas the LBE and FATC are inserted into the C lobe of the kinase domain.
Figure \(\PageIndex{5}\) shows an interactive iCn3D model of the mTOR with the LST8 protein bound through the kinase LBE domain and with bound AGS, a nonhydrolyzable ATP analog (4JSP).
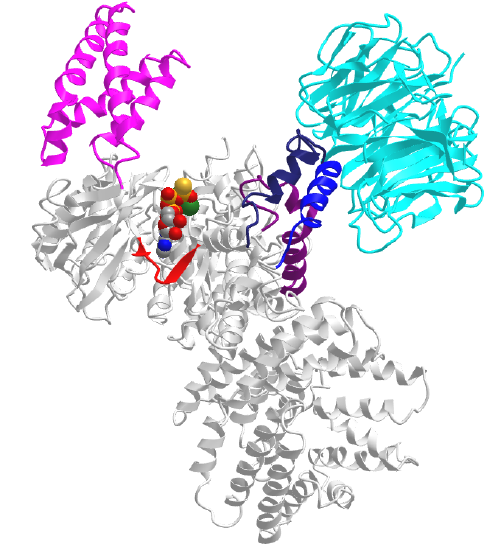
Key regions are:
- FAT domain: 1385-2000
- N Lobe: 2003-2240
- C Lobe: 2241-2549
- FRB domain (magenta) inserted into N lobe: 2021-2118
- LBE domain (medium blue) inserted into C lobe: 2259 (ILL) to 2296 (TAG)
- Catalytic Loop (red): 2337 (GDR) to 2344 (SNL)
- Activation loop (dark blue): 2357 (DFG) to 2379 (FRL)
- FATC domain (purple) inserted in C lobe: 2519 (LDV) to 2549 (PFW)
Now imagine the FKBP:RAMP complex binding to the FRB domain in the figure above and you can easily imagine how RAMP could inhibit a large protein substrate from binding.
A close-up of the active site of the kinase showing bound AGS, the catalytic loop (red) containing the general base Asp 2388, and the activation loop is shown in Figure \(\PageIndex{6}\).
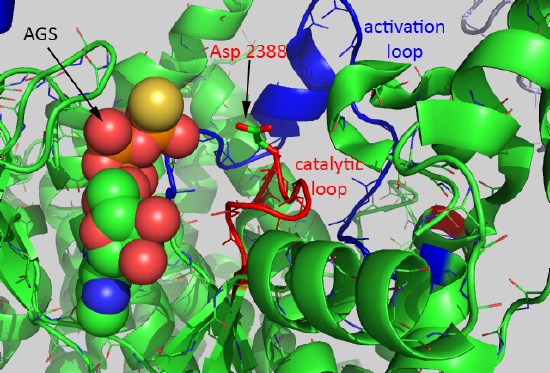
The mTOR kinase seems to be always primed for catalysis since the Asp 2388 is in a position to act as a general base. The FRB domain seems to be involved in directing substrate access (such as S6K1) and hence in controlling substrate specificity. Binding of FKBP:RAMP to the FRB domain would prevent substrate binding. Important substrates for each complex are shown below.
mTORC1:
Eukaryotic Translation Initiation Factor 4E Binding Protein 1 (EIF4EBP1): This protein inhibits translation by binding eukaryotic translation initiation factor 4EIF (eIF4E). In the absence of active IF4EBP1, eIF4E is part of a complex that recruits 40S ribosomal subunits to the 5' end of mRNAs, which allows the initiation of translation. The binding protein inhibits complex assembly and represses translation. Active mTORC1 phosphorylates the binding protein in a variety of conditions (UV irradiation and insulin) which leads to dissociation of the binding protein which allows eIF4E to initiate translation.
Ribosomal S6 kinase 1 (RPS6KB1 aka S6K1): This is a Ser/Thr kinase involved in proliferation, protein synthesis, cell growth, and cell proliferation. It phosphorylates eIF4B. In nutrient depletion (non-growth conditions), it forms a complex with the EIF3 translation initiation complex which inhibits translation. Under growth conditions, it is phosphorylated by mTORC1, causing its dissociation from the EIF3 complex and activation of translation. The active form then phosphorylates and activates several substrates in the pre-initiation complex, including the EIF2B complex and the cap-binding complex component EIF4B. In the presence of amino acids, both EIF4EBP1 and S6K1 are phosphorylated. If amino acids are depleted, they are dephosphorylated.
Lipin 1 (LPIN1): This is a phosphatase that converts phosphatidic acid to diacylglycerol in triglyceride synthesis. Interestingly, it is also a transcriptional coactivator with PPARs (peroxisome proliferator-activated receptors) to modulate genes involved in lipid synthesis.
A summary figure of mTORC1 signaling is shown in Figure \(\PageIndex{7}\).

mTORC2:
Akt (also known as Protein Kinase B): This is a Ser/Thr kinase that is involved in the regulation of metabolism, proliferation, cell survival, growth, and angiogenesis. It has a notable role in the movement of the glucose GLUT4 transporter to the cell membrane in response to insulin signaling. Akt also interacts with mTORC1.
Serum/Glucocorticoid Regulated Kinase 1 (SGK1): This serine/threonine protein kinase is involved in cellular stress response. It activates certain potassium, sodium, and chloride channels. It also activates membrane transporters, enzymes, and transcription factors. Its effects regulate neuronal activity, cell growth, proliferation, survival, migration, and apoptosis.
Protein Kinase C alpha (PRKCA): This is a Ser/Thr kinase involved in cell adhesion, proliferation, differentiation, and migration.
Rho and Rac: These are small G-protein involved in cytoskeletal structure and cell cycle.
Figure \(\PageIndex{8}\) shows a more complete pathway of activation, regulation, and activity of both mTORC1 and mTORC2. Figure \(\PageIndex{x}\) below is used with courtesy of Cell Signaling Technologies (www.cellsignal.com). This chapter section will mostly focus on mTORC1.

Regulation of mTORC1 by Leucine
mTORC1 is a key regulator of protein synthesis but that begs the question as to how it determines that protein synthesis is required. How does it sense that? Rregulators of mTORC1 might be amino acids in cells, but who would have thought that the master regulator would be leucine, a simple branched chain hydrophobic amino acid.
It would be nice if free leucine bound directly to mTORC1, but it's not that simple. Rather, it binds to a "leucine" receptor, sestrin 2 (SESN2). Figure \(\PageIndex{9}\) shows the binding interactions between Leu (spacefill) and key side chains in sestrin 2 (5dj4).
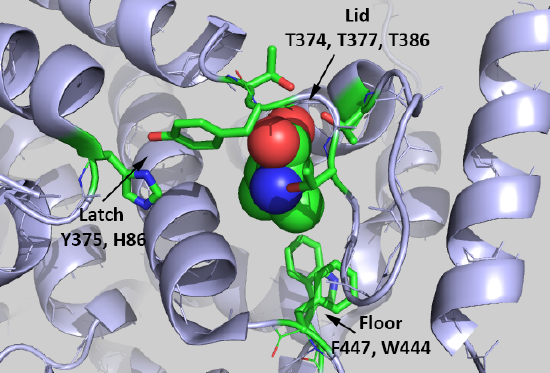
The Leu is rather buried, which suggests a conformational change ensues on binding to the protein. Saxton et al (2016) describe three types of sestrin2 side chains involved in the interaction:
Lid: Thr374, Thr377, and Thr386 form H bonds with the Leu amine and carboxyl group. Leucine is represented as a stick model (orange).
Latch: Tyr375 and His86 form hydrogen bonds to the Leu. Note that these residues are distal in the chain and are probably pulled together during the conformational changes which occur after binding to form a latch to sequester the bound Leu.
Floor: F447 and W444 which interact with the nonpolar side chain of Leu.
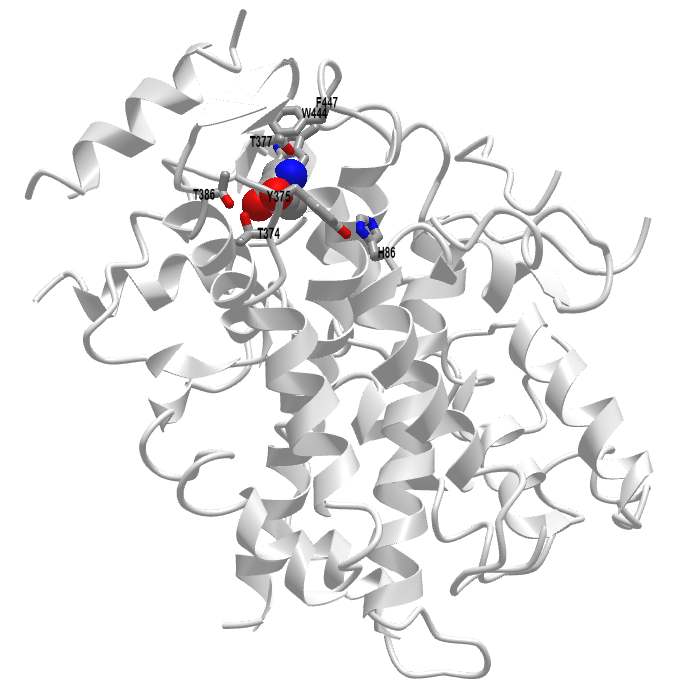
Figure \(\PageIndex{10}\) shows an interactive iCn3D model of Leucine-bound Sestrin2 (5DJ4).
.png?revision=1&size=bestfit&width=322&height=323)
What happens after leucine binds? It's a complicated but understandable process described below in words and images. But first a quick review. Kinases must be regulated to be turned on and off at the right time. They are often regulated by phosphorylation, as mTOR is. In addition, they can be regulated by binding proteins as mTOR is (by Raptor, FKBP, etc). They can also be regulated by small G proteins (like Ras) which are active when bound to GTP and inactive when bound to GDP. Of course, whether small G proteins have GTP bound depends in part if they interact with GAPs (GTPase activating protein which inactivates small G proteins) or GEFs (which facilitate the exchange of GDP for GTP and activate them). Such a master regulator of growth as mTORC1 is regulated by all of these, in addition to the presence of abundant leucine.
In the absence of leucine, sestrin 2 is bound to a protein called GATOR2 (GTPase-activating protein - GAP - activity toward Rags 2). The binding of leucine to sestrin 2 causes the dissociation of GATOR2. This is shown in Figure \(\PageIndex{11}\).

Free GATOR2 is a GAP that regulated mTORC1. Specifically, it regulates the activity of a heterodimer of small GTP binding proteins, RagA/B:RagC/D (see pathway above) which are associated with the outer leaflet of the lysosome. There they interact with a membrane protein, SLC38A9, and a protein that regulates the Rag proteins, which of course is named Ragulator. Active RagA/B:RagC/D recruits mTORC1, presumably through the Raptor subunit) from the cytoplasm to the lysosome membrane. Small G proteins like Ras, when activated by exchanging bound GDP for GTP, can interact with and activate kinases (like the Raf kinase for Ras). When mTORC1 binds to active RagA/B:RagC/D, it becomes activated.
We often think of activating a protein by ligand binding, which promotes a conformational change, or by post-translational modification, which can provide a binding interaction or conformational change to activate the protein. Another way is to inhibit an inhibitor of a protein, as shown in Figure \(\PageIndex{12}\).: Y inhibits Z as denoted by the blunt blunt-ended. If X inhibits Y, then Y can't inhibit Z, which is now active. This is analogous to the quote that "the enemy of my enemy is my friend", which has been attributed to Kautilya (from India) in the 4th century BCE.

Leucine binding to sestrin 2 leads to free GATOR, which activates mTORC1 by blocking downstream inhibitors. Figure \(\PageIndex{13}\) (after Buel and Blenis, 2016) shows the interactions from an activation (arrow) or inhibition (blunt arrow) perspective.
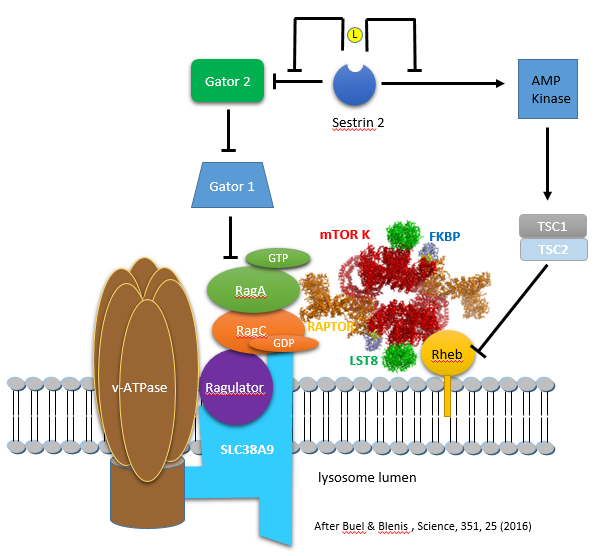
The figure above shows the involvement of multiple proteins in the lysosome membrane that are involved in mTORC1 activation. There is yet another way that the RagA/B and RagC/D proteins are regulated (other than by the GATOR GAP activity. The main one appears to be Ragulator, which is a GEF for the Rag proteins. Here is a summary of the components of this lysosomal membrane recruitment center for mTORC1.
- Ragulator (what a great name) binds and recruits the small G proteins Rag to the lysosome membrane where Ragulator acts as a GEF for RagA/B
- SLC38A9 is a weak amino acid transporter in the lysosome membrane, with a preference towards polar amino acids. More likely it is yet another sensor of amino acids, particularly of arginine, which has a high concentration in the lysosome. The protein has a high Km for the transport of Arg. It has a Ragulator binding domain and is hence part of the complex that recruits mTORC1 to the lysosome
- vacuolar adenosine triphosphatase (v-ATPase): function unclear
These interactions, which involve multiple activations and inhibitions, are difficult to follow even with a diagram. The actions of small G proteins can be especially difficult to understand since the G protein is biologically INACTIVE in its GDP-bound form towards its target binding protein. This occurs when the GTPase activity of the G protein is ACTIVE. The arrows and blunt end arrows in the figure above represent the activity of the protein toward its target protein.
Here are two alternative ways to make sense of the interactions:
- Stepping backward from Rag A/B, Gator 1 (a GAP) inhibits the ACTIVITY of the protein Rag A/B as it acts as a GAP to leave Rag A/B in the inactive GDP-bound state. Paradoxically this occurs as the inherent GTPase activity of the protein is activated as described above). Free Gator 2 (also a GAP) appears to inhibit the GAP activity of Gator 1 (through an unknown mechanism), thereby increasing the amount of GTP-bound Rag A/B, which then can activate mTORC1. Free Gator 2 does this only if Sestrin 2 is bound to Leu which allows the Gator 2 to dissociate from the inactive sestrin 2:Gator 2 complex.
- The diagram above shows that in the absence of leucine, three blunt end (inhibition) arrows occur between Sestrin 2 and Rag A/B. One blunt arrow denotes inhibition, two activation (inhibition of inhibition), and hence three net inhibition Hence in the absence of Leu (when Sestrin is bound to Gator 2, Rag A/B is inhibited in its ability to activate mTORC1 as Rag A/B is in the GDP-bound state. However, free leucine unblocks the inhibitor action of sestrin 2 as Gator 2 is now free and active on its own.
Amino acids (especially arginine, which is abundant) in the lumen of the lysosome activate, through the v-ATPase and SLC38A9, the GEF activity of Ragulator. When Rag A/B has sufficient GTP, some conformational changes must ensue to allow mTORC1 recruitment to the lysosomal membrane.
Regulation of mTORC1 by Energy Availability - AMP Kinase
Believe it or not, another small G protein with GTPase activity, Rheb (Ras homolog enriched in the brain), is involved in both mTORC1 recruitment to the lysosomal membrane and activation of mTOR. This interaction is also shown in the figure above. Mostly, Rheb is involved in the activation of the kinase activity of the mTORC1 complex and specifically the phosphorylation by mTOR of the substrates S6K1 and EIF4EBP1. In the presence of growth factors, Rheb is localized to the membrane by a lipid anchor (a farnesyl group). The mTORC1 kinase-activating activity of Rheb stands in contrast to the role of the Rag G proteins which appears to be chiefly recruitment.
How is the small G protein Rheb regulated? Of course, by its interaction with yet another GAP, named the tuberous sclerosis complex (TSC). In the absence of growth factors, TSC binds to Rheb and, acting as a GAP, promotes GTP hydrolysis. This inactivates Rheb, inhibiting mTOR kinase activity.
How then is Rheb regulated? One way is through phosphorylation by AMP Kinase (AMPK), an enzyme that is itself regulated by the energy level of the cells. AMPK phosphorylates and activates the TSC, which, acting as a GAP, inactivates the small G protein Rheb complex (TSC complex). Sestrins 1 and 2 may also regulate AMPK. Let's look at the energy sensor of the cell in more detail.
AMP Kinase is one of the cell's major fuel sensors and also in mammals responds systemically to hormone and nutrient levels. The enzyme is a heterotrimeric protein consisting of an alpha (catalytic), beta (regulatory), and gamma (regulatory) subunit that binds AMP, ADP, and ATP. Cellular ATP levels are determined in part by the enzyme adenylate kinase which helps interconvert adenine nucleotide (AXPs) as shown in the following equilibrium:
Adenylate Kinase: ADP + ADP ↔ ATP + AMP, Keq = 0.44
In red blood cells, the concentrations of ATP, ADP, and AMP are approximately 1850 uM, 145 uM, and 5 uM. Even in cells that use lots of ATP (muscle for example), ATP never falls by much. Using the values above and simple general chemistry, an 8% drop in ATP would lead, through the action of adenylate kinase, to an ATP concentration of about 1710 uM and an AMP concentration of 20 uM. This value for AMP is still much lower than ADP and ATP. However, this change represents a 4 fold increase in AMP which, even with the low actual concentration of AMP, leads to the activation of AMPK.
Another "normalized" indicator of cell energy status (or "charge") is the Energy Charge, EC. It is defined by an equation that gives a value from 0-1 where 0 indicates that all AXPs are in the AMP form and 1 where only ATP is present. The numerator of the equation of EC below represents the number of moles of phosphoanhydride linkages in the AXP pool (two for each ATP and one for ADP) and the denominator is the number of moles of AXPs (mass balance). The 1/2 term allows the bracketed term to equal 1 when only ATP exists and 0 when only AMP exists. The EC values of cells are regulated to remain around 0.85.
\begin{equation}
\mathrm{EC}=\frac{1}{2}\left[\frac{2 \mathrm{ATP}+\mathrm{ADP}}{\mathrm{ATP}+\mathrm{ADP}+\mathrm{AMP}}\right]
\end{equation}
Before we explore the mechanism of energy sensing by AMPK, let's look at the domain structure of the three subunits of AMPK. They are shown in Figure \(\PageIndex{14}\).
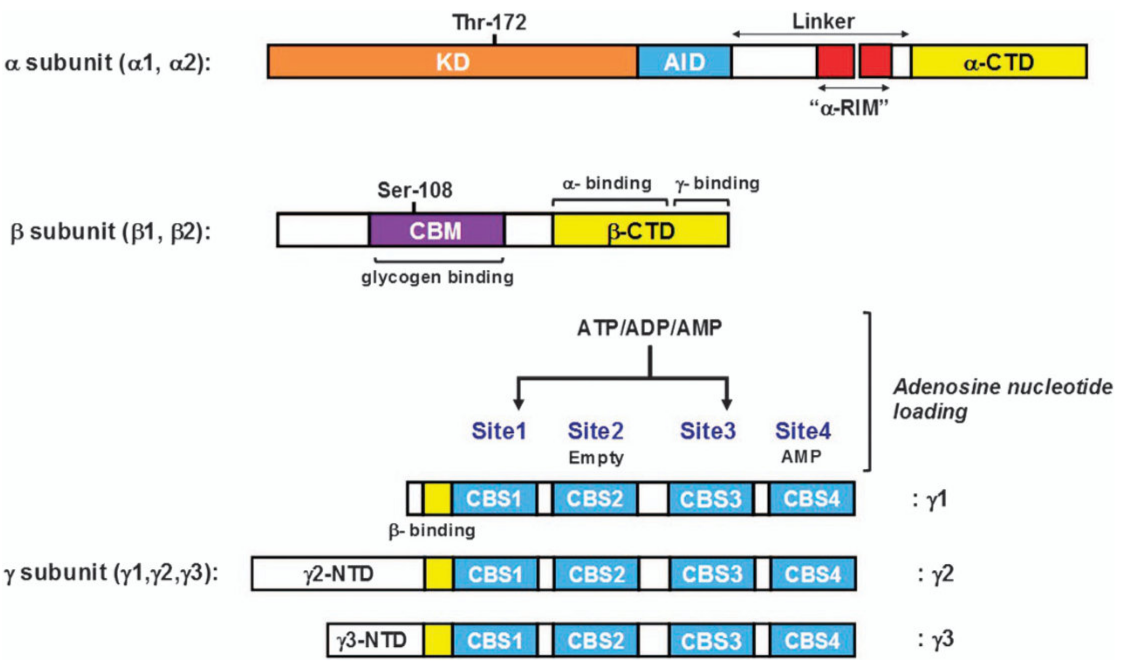
Figure \(\PageIndex{14}\): Domain structure of the alpha, beta, and gamma subunits of AMPK. Kim et al. Experimental & Molecular Medicine (2016) 48, e224. https://www.nature.com/articles/emm201616.pdf. a Creative Commons Attribution-NonCommercial-ShareAlike 4.0 International License. http:// creativecommons.org/licenses/by-nc-sa/4.0/
The mammalian α1/α2 and β1/β2 isoforms are very similar, and their characteristic features are shown. AMPKα subunits: KD, kinase domain containing Thr-172 for the activation by upstream kinases; AID, autoinhibitory domain; two α-RIM, regulatory subunit interacting motifs triggering the conformational changes in response to AMP binding to the AMPKγ subunit; α-CTD, C-terminal domain binding to the β-subunit. AMPKβ subunit: CBM, carbohydrate-binding module, in which Ser108 is important for the action of some direct AMPK activators, such as thienopyridone (A-769662) and salicylate; β-CTD, C-terminal domain containing α-subunit-binding site and immediately followed by the domain for γ-subunit interaction. AMPKγ subunit: three γ-subunit isoforms have variable N-terminal domains (NTDs); four CBS, cystathione-β-synthase domain, which forms two Bateman domains that create four adenosine nucleotide-binding sites (Sites 1–4). Site 2 appears to be always empty and Site 4 has a tightly bound AMP, whereas Sites 1 and 3 represent the regulatory sites that bind AMP, ADP, or ATP in competition.
How AMPK detects this exponential but still small molar increase in AMP is interesting, especially given the much higher concentrations of ADP and ATP. AMPK contains four binding sites that can bind AMP, ADP, and ATP (AXPs) in the regulatory subunit (gamma). This is in addition to the binding of ATP and ADP at the active site in the catalytic subunit (alpha). What binds depends on the Kd for binding of different AXPs as well as their concentrations. Bound AMP seems to have three effects on AMPK. When bound to the gamma subunit, AMP
- increases phosphorylation of Thr 172 in an "activation" loop in the catalytic alpha subunit by an upstream kinase which increases the kinase activity of AMPK by 100-200 fold. Phosphorylation is essential for the activity of the enzyme;
- inhibits dephosphorylation of Thr 172 which is perhaps the major way that AMP enhances the kinase activity of the catalytic subunit. ADP binding also inhibits dephosphorylation as shown by studies that show that the binding of ADP and the dephosphorylation of the phospho-AMPK have the same ADP concentration dependency;
- allosterically activates ten-fold the kinase activity of the catalytic alpha subunit (a secondary effect). ADP has no such effect.
These effects are altered by the markedly higher concentrations of ATP which counteracts all these effects, enhancing the Energy Charge sensor activity of this enzyme.
The gamma regulatory subunit has 4 binding sites for AXP. Crystal structures show site 2 is empty, site 4 is always bound to AMP, and sites 1 and 3 can bind AMP, ADP, or ATP. Site 1, which mediates the allosteric effects on AMPK binds all AXPs with similar affinity. This appears paradoxical since given the high energy charge, one would expect ATP and ADP to out-compete AMP for binding. However, it was found that the Mg2+ -ATP complex has marked lower affinity for the site, allowing both AMP and ADP, which under cellular conditions are mostly not bound to Mg2+ while ATP is, to out-compete Mg2+ -ATP for binding. Site 3 binds AMP and ADP with a 30-fold lower affinity but on binding protects p-AMPK from dephosphorylation of Thr 172.
Figure \(\PageIndex{15}\) shows an interactive iCn3D model of human AMPK (a2b2g1) in complex with a small molecule activator SC4 (6B2E)
_in_complex_with_a_small_molecule_activator_SC4%25C2%25A0(6B2E).png?revision=1&size=bestfit&width=472&height=268)
SC4 or similar molecules may be important drugs to target AMPK and be useful in the treatment of insulin resistance and Type II diabetes. SC4 activates α2 complexes and glucose uptake into muscle cells. Some would call this type of drug an importagog, as it increases the uptake of important metabolites into cells.
The alpha catalytic kinase subunit is shown in gray with key catalytic residues and phosphorylated Thr and Ser shown in sticks, CPK coloring, and labeled. The beta subunit is shown in cyan. It appears to be two chains since the connecting section is not ordered in the crystal structure. The gamma subunit with bound AMP (spacefill, CPK colors, labeled) is shown in magenta.
What effect does activated AMPK have on the cell? Active AMPK has an amazing number of effects (see figure below). It activates liver glycolysis (by phosphorylating phosphofructokinase 2 which forms F2,6-BP, an activator of PFK) and inhibits by phosphorylation enzymes involved in fatty acid synthesis (acetyl-CoA carboxylase), glycogen synthesis (glycogen synthase) and cholesterol synthesis (HMG-CoA reductase). Yeast AMPK has recently been shown to be also controlled by acetylation of the equivalent beta subunit (Sip2). Acetylation increases its interaction with the alpha catalytic subunit (Snf1) which decreases its kinase activity. This decreases the phosphorylation of downstream kinases (including an analog of Akt1 called Sch9) which slows the growth and increases longevity. Normal aging is associated with decreased acetylation of Sip2.
Figure \(\PageIndex{16}\) shows how the many signaling pathways we have studied interact with AMPK
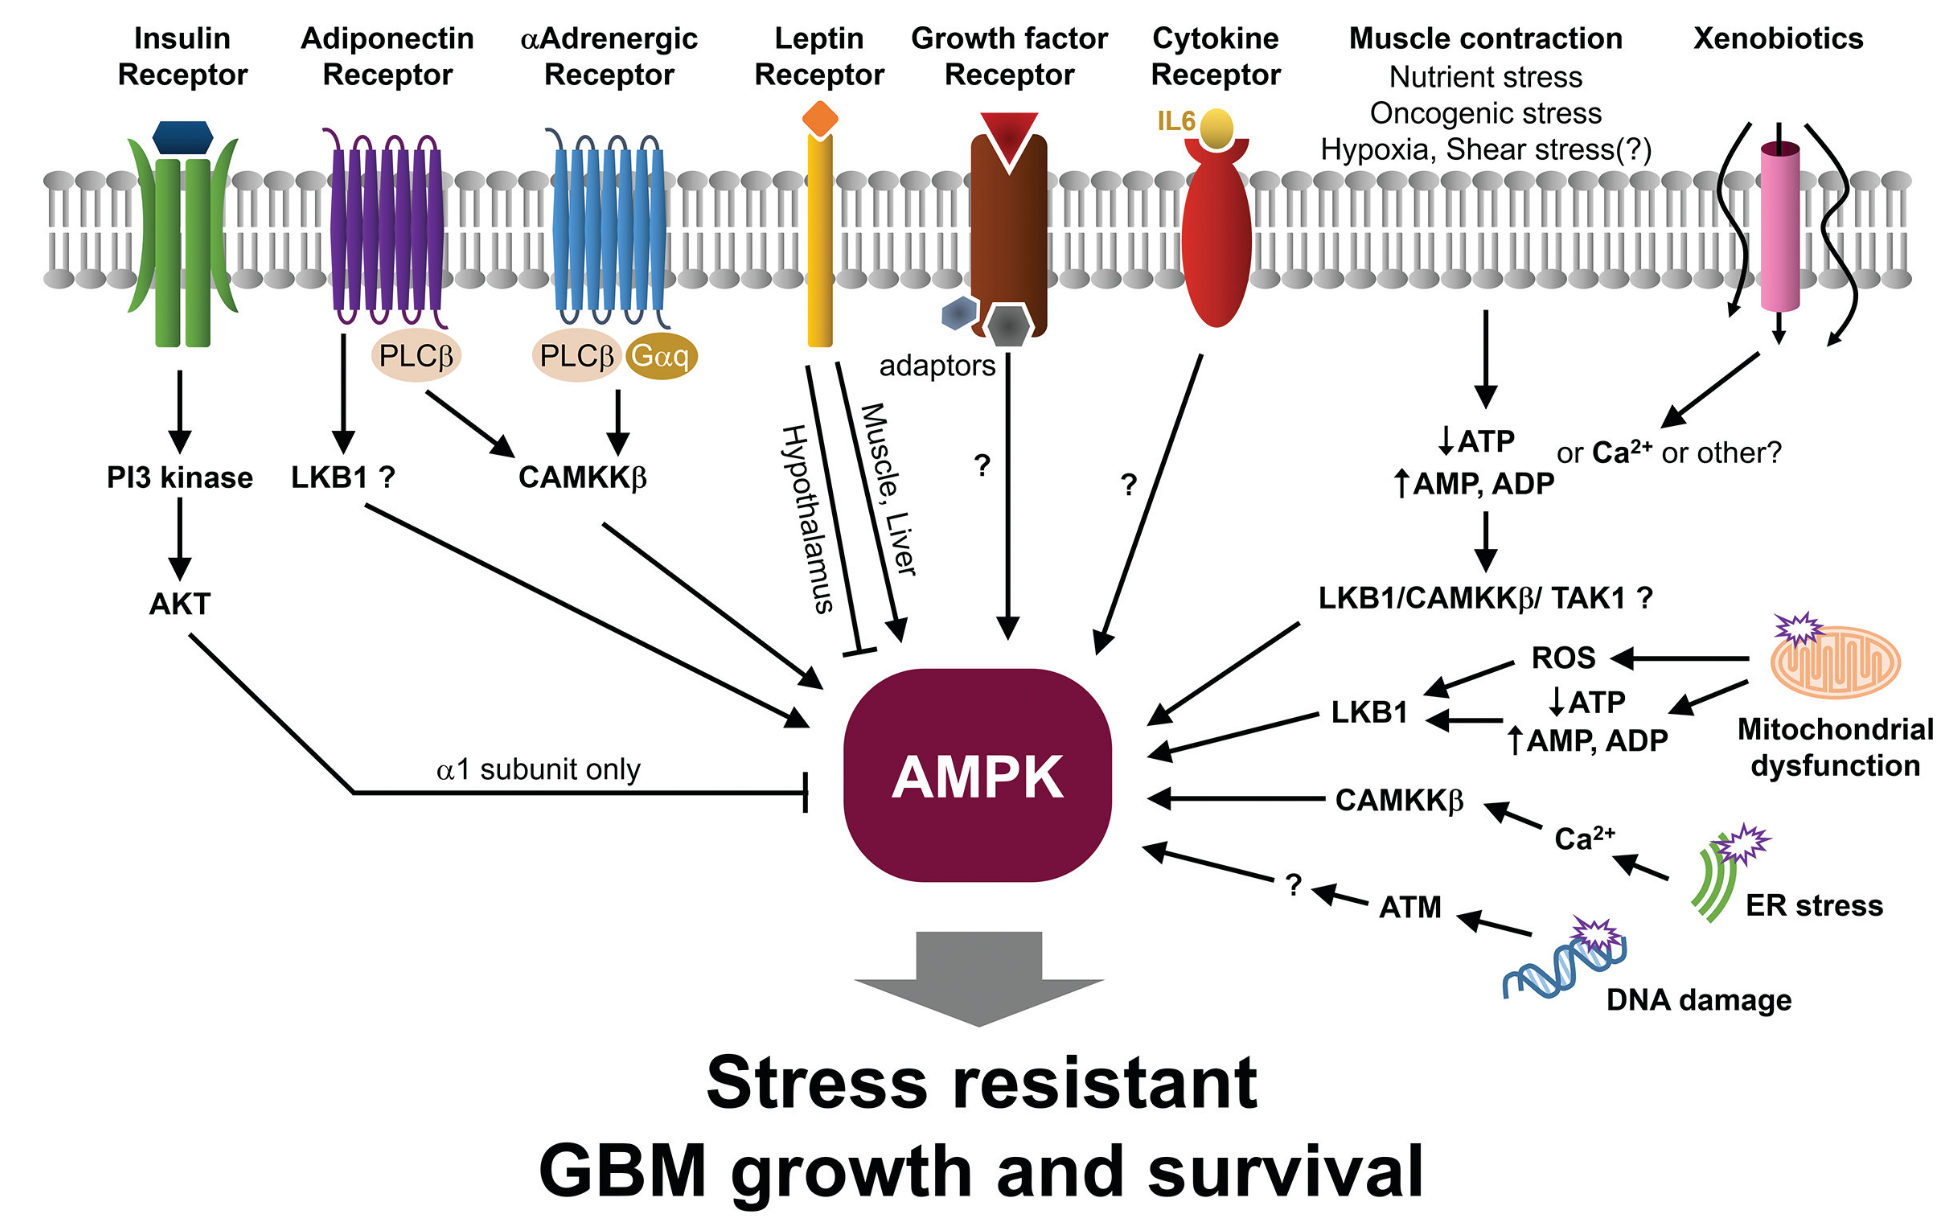
Figure \(\PageIndex{17}\) shows a more complete pathway of activation, regulation, and activity of AMPK. The illustration is used with courtesy of Cell Signaling Technologies (www.cellsignal.com).
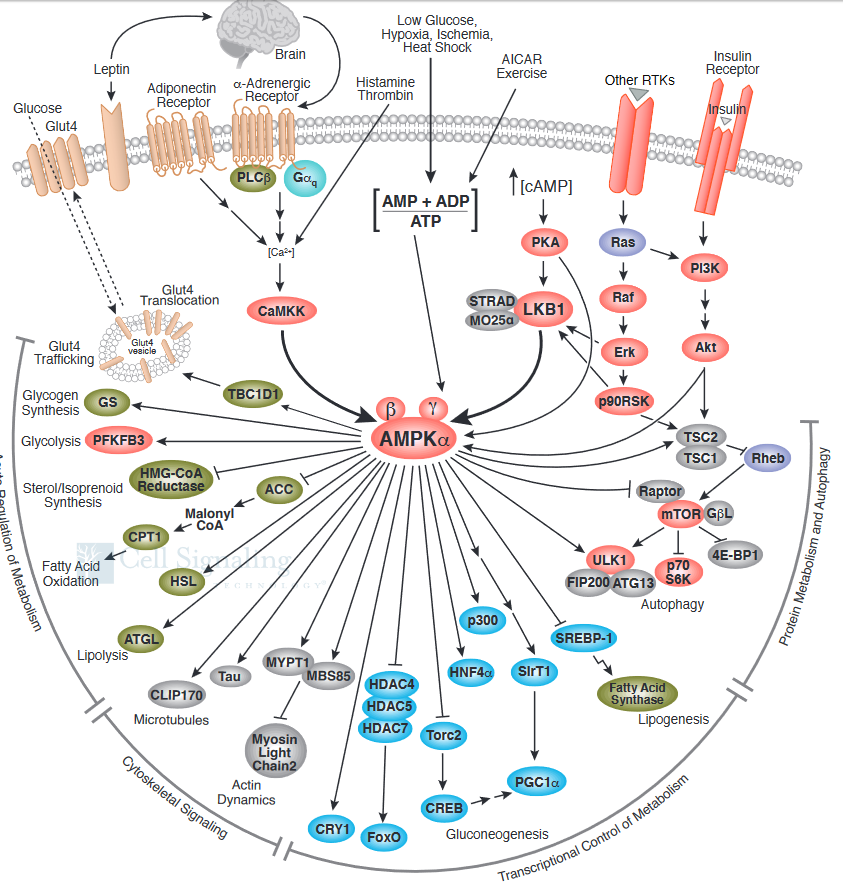
It also shows the effect of AMPK on the master regulator of protein, lipid, and nucleic acids synthesis, mTOR. Synthesis of these molecules is necessary for cell growth and proliferation, two activities that cells do not engage in when AMP levels are high, which signifies an energy-depleted state.
Regulation of mTORC1 by Insulin and Growth Factors
mTORC1 is regulated by local factors (amino acids, energy state) and systems factors (growth factors). This list is growing daily. The following have been shown to lead to mTORC1 activation including small molecules such as amino acids, ATP (through AMP kinase), oxygen, and glucose, and larger ones such as insulin, other growth factors, cytokines (immune growth factors and regulators), oncogenes (which promote cell proliferation) and some infectious agents. Other molecules or processes inhibit mTORC1, including tumor suppressors and stress.
mTORC1 promotes mRNA and protein synthesis as described above but also nucleotide and lipid synthesis, which is not described in detail above. In addition, it promotes aerobic glycolysis (Warburg effect), to supply not energy but intermediates for biosynthesis, as well as the pentose pathway, which forms NADPH for reductive biosynthesis and ribose for nucleic acid synthesis.
Let's look at 2 specific external hormones, insulin and epidermal growth factor (EGF), and how they affect mTORC1 activity;
Insulin:
Insulin binding to its receptor leads to the activation through phosphorylation of the kinase Akt (aka Protein Kinase B) after upstream phosphorylation of membrane phosphoinositides in the membrane and activation of phosphoinositide-dependent kinase 1, PDK1. Atk, as shown in the signaling figure for AMPK, phosphorylates TSC2, the GAP for Rheb. The arrows on the AMPK kinase figure above are not consistent with our previous use of arrows. In the figure from CST, arrows show that both AMPK and Akt phosphorylate TSC2. The phosphorylated TSC is shown to inhibit Rheb, the small G protein. This would not make physiological sense. Phosphorylation of TSC2 by AMPK (signaling energy depletion) activates the TSC2 GAP protein which would inhibit RheB (the G protein) and hence inhibit mTORC1. In contrast, phosphorylation of TSC2 by Akt (signaling the abundance of glucose) leads to the inhibition of the GAP activity of TSC2. That would keep Rheb in the active, GTP-bound form, which leads to the activation of the bound mTORC1. A more complete description of the pathway where insulin binds to its receptor (an insulin-gated receptor tyrosine kinase) and leads to activation of mTORC1 through Akt is shown in Figure \(\PageIndex{18}\).

MAPK Cascade:
EGF binds its receptor, activating it as a receptor tyrosine kinase. Typical of other receptor kinases, it activates the mitogen activate protein kinase system. This process is mediated by Ras (a small G protein) activator of Raf (a mitogen-activated protein kinase kinase kinase or MAP3K). Active Raf phosphorylates and activates MEK (a MAPK2) which activates ERK (a MAPK). Erk phosphorylates mTORC1 directly, which activates it. It also phosphorylates TSC2/TSC1, which inhibits this GAP protein, leading indirectly to the activation of the small G protein Rheb, which also activates mTORC1. These steps are shown in Figure \(\PageIndex{19}\).

A summary showing the kinases that activate or inhibit TSC2/1 is shown in Figure \(\PageIndex{20}\). We tend to concentrate on our favorite protein and confer it with special status as critically important in a pathway. One could pick the GAP protein TSC2 as especially important in regulating the activity of mTORC1.
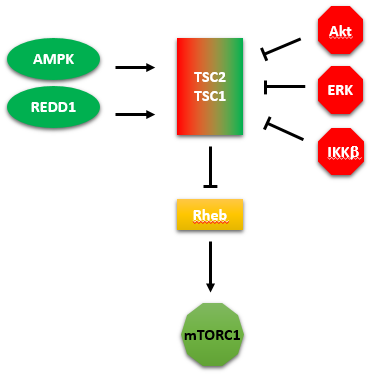
Figure \(\PageIndex{20}\): kinases that activate or inhibit TSC2/1
The figure above shows two additional proteins. One is REDD1 (not a kinase), which activates the GAP protein TSC2, leading to the inhibition of the small G protein Rheb, and hence the inhibition of mTORC1.
REDD1 (regulated in development and DNA damage responses 1) is also called DDIT4 (DNA-Damage-Inducible Transcript 4). It is a gene whose expression is activated during hypoxia by hypoxia-inducible factor-1 and also during DNA damage. Hypoxia alters metabolism very quickly. The protein is degraded by the proteasome after it is targeted for degradation by the post-translational addition of ubiquitin. This suggests yet another way to regulate the activity of mTORC1.
The other is IKK beta, also known as IKBKB ( Inhibitor Of Kappa Light Polypeptide Gene Enhancer In B-Cells, Kinase Beta). It is a kinase that phosphorylates and inhibits TSC2 which inhibits Rheb, leading to the activation of mTORC1.
This kinase is activated by many stimuli including inflammation (mediated by cytokines), bacterial or viral infections, and DNA damage. It phosphorylates a bound inhibitor of NF-kappa beta. This allows ubiquitinylation of the inhibitor, targeting it for proteasomal degradation. The free NFKB can then enter the nuclease and alter the transcription of genes involved in the immune response and hence promote proliferation. Under these conditions, one would expect the activation of mTORC1.
A final note: Less is known about how lipids regulate mTORC1. Two possible lipid signaling molecules, phosphatidic acid, and phosphatidyl inositol -3-phosphate are probably involved. The enzyme that makes them, phospholipase D and phosphoinositide 3-kinase (from the PIK3C3 gene), also known as VPS34 (for vacuolar protein sorting from yeast), are found in phagosomal and lysosomal vesicles and are involved in their processing, seem to be involved in mTOR signaling. Obesity and people with high-fat diets have elevated mTOR activity.