
16.3: Regulation of the Citric Acid Cycle
- Page ID
- 15020


Overview
Entry of pyruvate into the citric acid cycle leading to the aerobic production of energy and intermediates for biosynthesis is a key metabolic step. Hence both the pyruvate dehydrogenase complex and key enzymes in the cycle are targets for regulation. This occurs through substrate availability, product inhibition, allosteric effectors, and post-translational modifications of key enzymes in the pathway. A summary figure showing key regulators is shown in Figure \(\PageIndex{1}\).

Figure \(\PageIndex{1}\): Regulation of the citric acid cycle
https://www.nature.com/articles/s41598-021-98314-z
Note that the key steps are regulated mainly by the ratio of mitochondrial NAD+/NADH which is highly influenced by the ratio of ATP/ADP. High NADH inhibits the regulatory enzymes. High levels of acetyl CoA, derived from pyruvate dehydrogenase and also through fatty acids catabolism increases flux through the cycle in part by allosterically activating the first enzyme in the pathway, citrate synthase.
The material below is derived from Renée LeClair, Ph.D., Cell Biology, Genetics, and Biochemistry for Pre-Clinical Students. https://med.libretexts.org/@go/page/37584. openly licensed (CC BY-NC-SA 4.0
Regulation of the pyruvate dehydrogenase complex (PDC)
Under aerobic conditions, the pyruvate produced by glycolysis will be oxidized to acetyl CoA using the pyruvate dehydrogenase complex (PDC) in the mitochondria (note: its genes are encoded in the nucleus). As this enzyme is a key transition point (the gatekeeper) between cytosolic and mitochondrial metabolism and is highly exergonic (ΔG0' = -7.9 kcal/mol, -38 kJ/mol), it is highly regulated by both covalent and allosteric regulation. Deficiencies of the PDC are X-linked and present with symptoms of lactic acidosis after consuming a meal high in carbohydrates. This metabolic deficiency can be overcome by delivering a ketogenic diet and bypassing glycolysis altogether.
The PDC is regulated by allosteric and covalent regulations. The complex itself can be allosterically activated by pyruvate and NAD+. Elevation of the substrate (pyruvate) will enhance flux through this enzyme as will the indication of low energy states as triggered by high NAD+ levels. The PDC is also inhibited by acetyl CoA and NADH directly. Product inhibition is a very common regulatory mechanism and high NADH would signal sufficient energy levels, therefore decreasing the activity of the PDC. Figure \(\PageIndex{2}\) summarizes the regulation. (Adapted from Marks’ Medical Biochemistry)
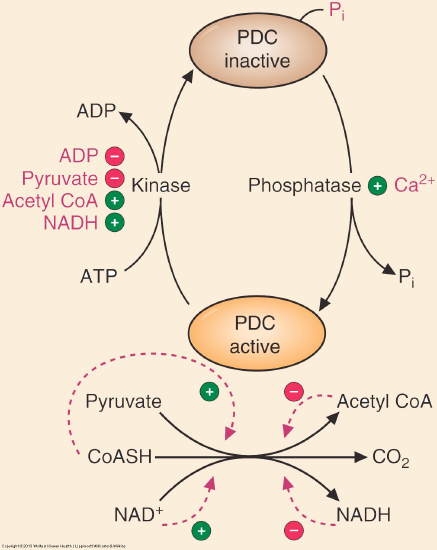
Figure \(\PageIndex{2}\): Regulation of pyruvate dehydrogenase.
The PDC is also regulated through covalent modification. Phosphorylation of the E1 subunits of the complex will decrease the activity of the enzyme.
The enzyme responsible for the phosphorylation of the PDC is pyruvate dehydrogenase kinase. The kinase is regulated inversely to the PDC, as shown in Figure 1 above. The kinase is most active when acetyl-CoA, NADH, and ATP are high. These compounds will stimulate the kinase to phosphorylate and inactivate the PDC. PDK is inhibited by dichloroacetate, TPP, Ca2+, and pyruvate. The PDC can be dephosphorylated by a calcium-mediated phosphatase, PDP. Starvation and diabetes result in increased phosphorylation and inhibition of the complex, which impairs glucose oxidation.
Phosphorylation occurs on Serine 264 of the α subunit (site 1), Ser271 (site 2), and Ser203 (site 3) are located on a conserved phosphorylation loop. Sites 1 and 2 (in loop A) are involved in the stabilization of TPP in the active site, while Ser 203 in the adjacent loop B binds Mg2+ which stabilizes PP on bound TPP. All it takes for inhibition is the phosphorylation of just one of the Ser side chains. Phosphorylation prevents the ordering of the loop which occurs on TPP binding which hinders the binding of the lipoyl domains of the PDC core to E1p, which inhibits the flow of metabolites in the PDC.
Prevention of PDC phosphorylation by the specific PDK inhibitor dichloroacetate increases levels of reactive oxygen species in mitochondria, which promotes the expression of a mitochondria-K+ channel axis, leading to cellular apoptosis and the inhibition of tumor growth
A summary of pathway regulation is shown in Figure \(\PageIndex{3}\).
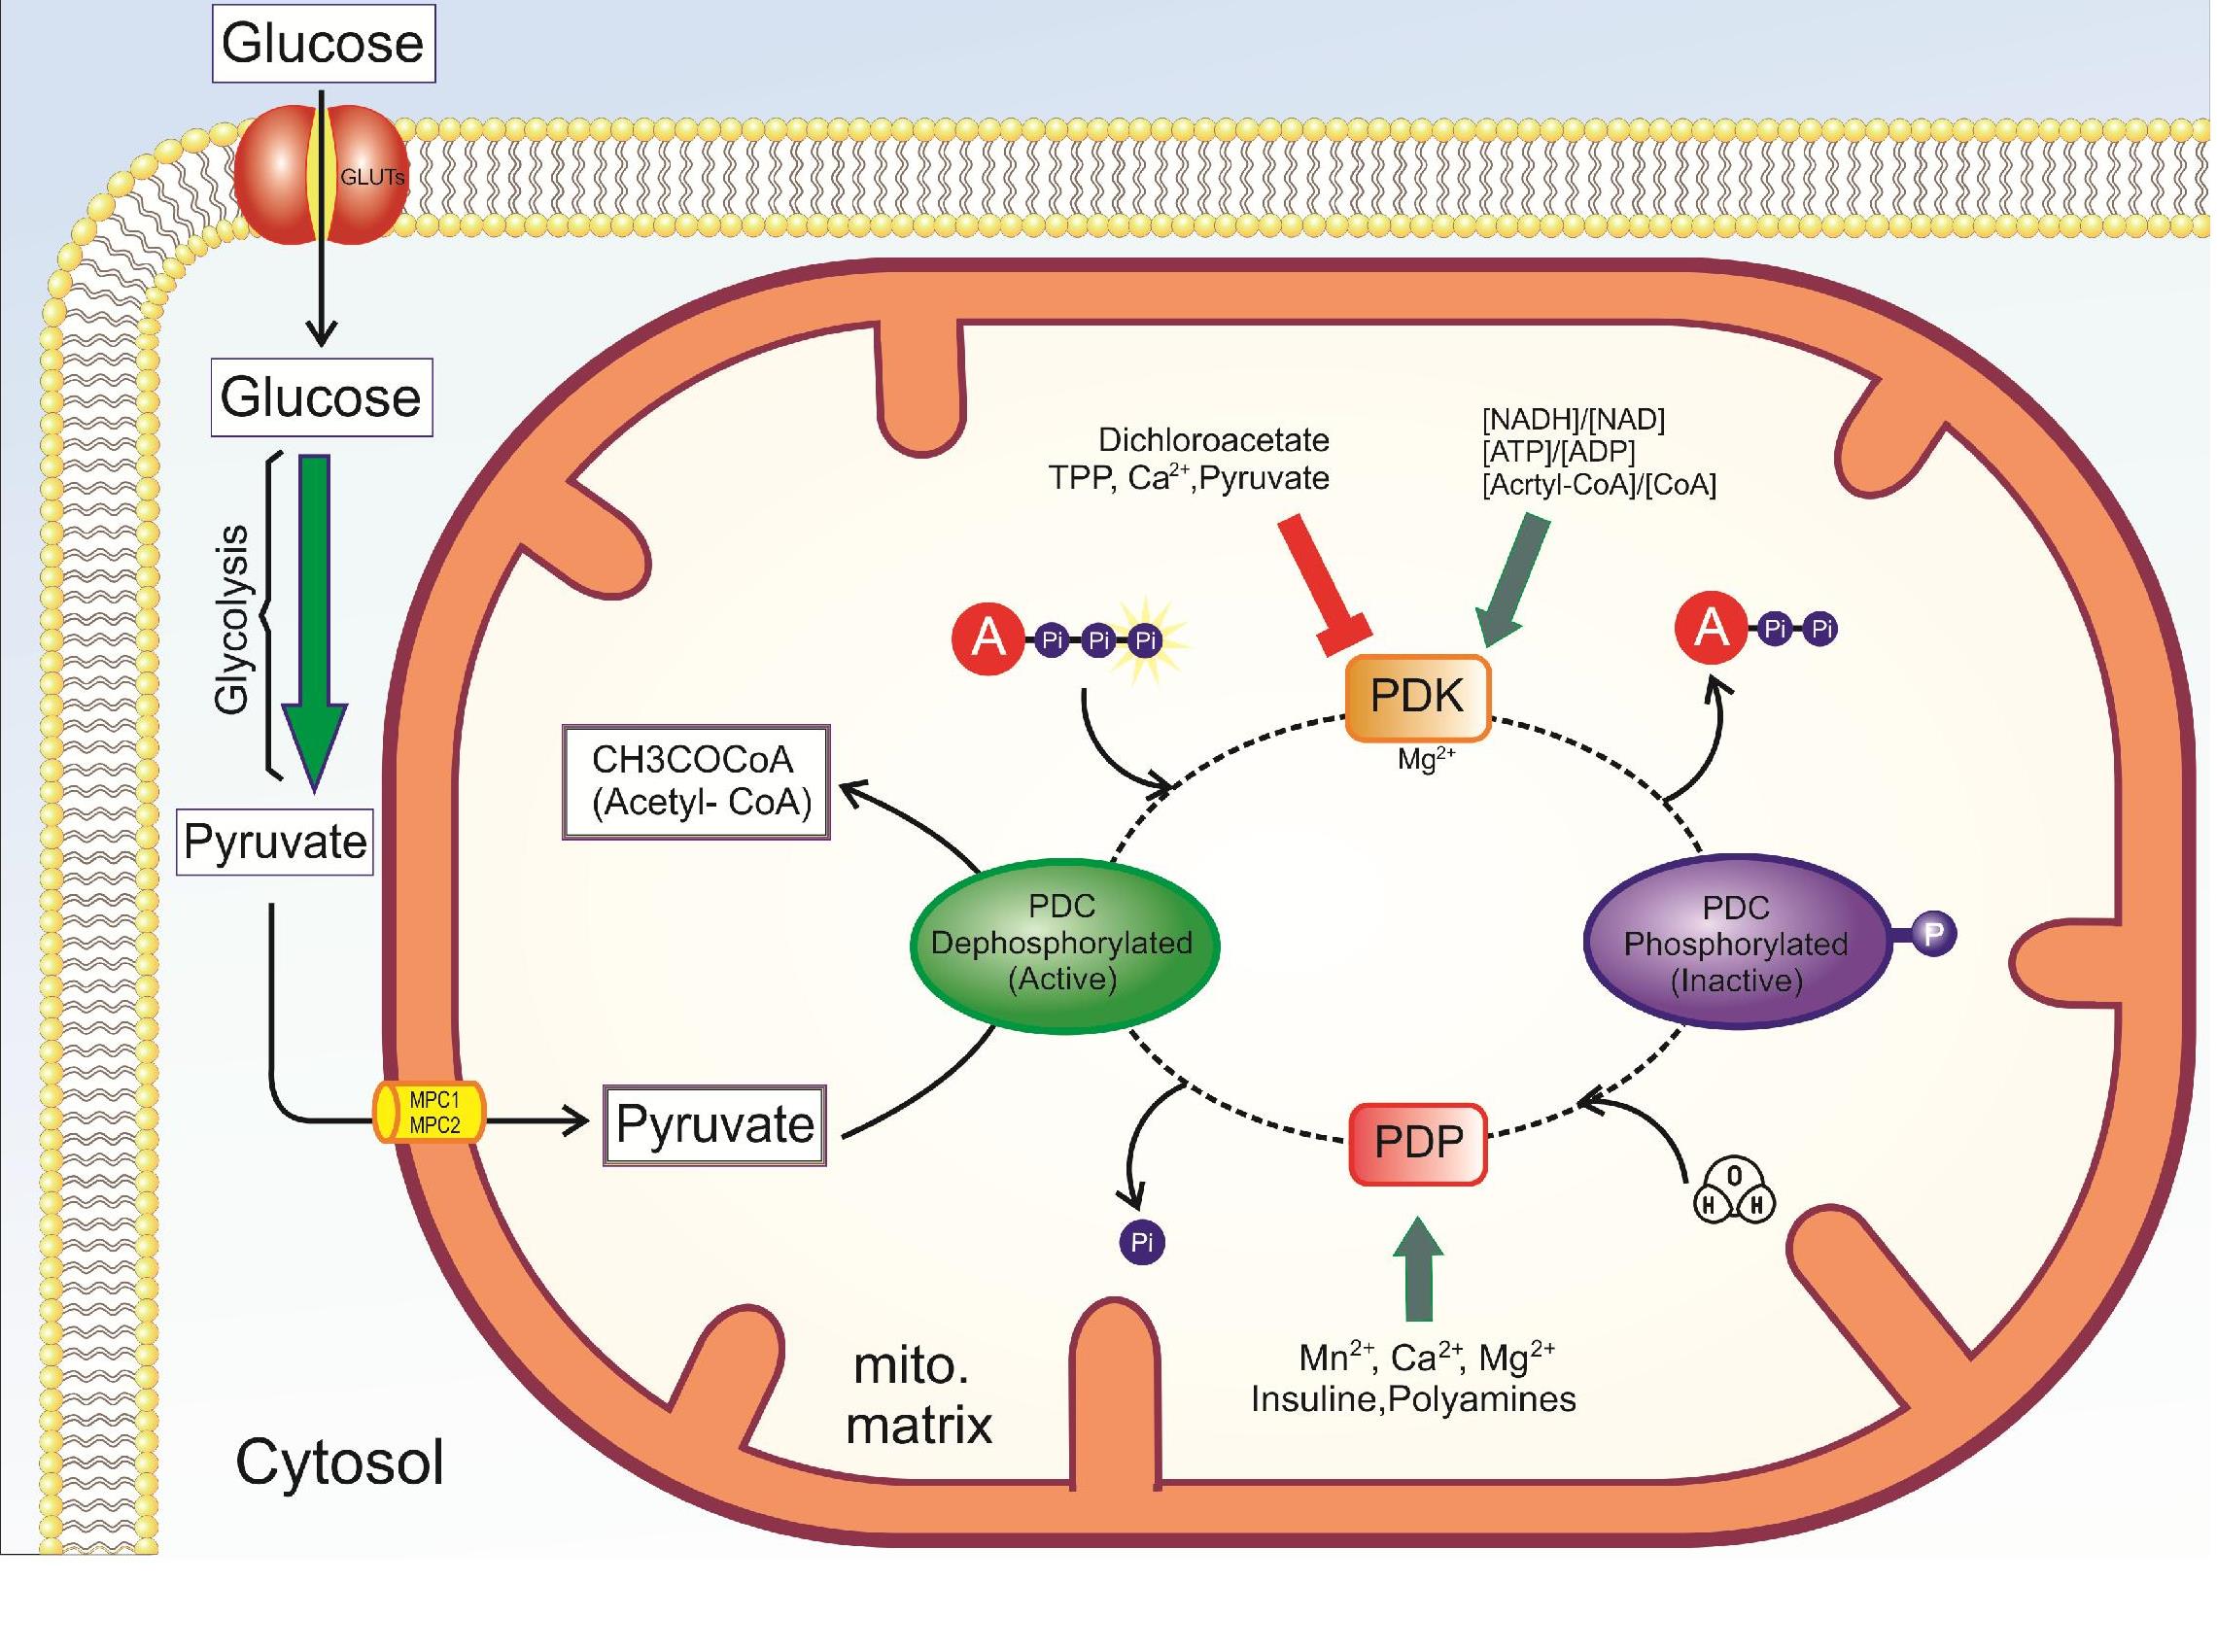
Figure \(\PageIndex{3}\): Summary of the regulation of pyruvate dehydrogenase
In general, PDC is activated through its substrates CoASH and NAD+, and kinase inhibition or phosphatase activation (PDP) (dichloroacetate, TPP, Ca2+, and pyruvate), is inhibited by its products acetyl CoA and NADH and activation of kinase (PDK). Abbreviations : PDC: pyruvate dehydrogenase complex, PDK: pyruvate dehydrogenase kinase, PDP: pyruvate dehydrogenase phosphatase TPP: thiamine pyrophosphate.
The complex is also acetylated and succinylated.
Table \(\PageIndex{1}\) below shows a summary of the regulation of pyruvate through glycolytic enzymes and pyruvate dehydrogenase
| Metabolic Pathway | Major Regulatory Enzyme(s) | Allosteric Effectors | Post-translational modifications | Hormonal Effects |
|---|---|---|---|---|
| Glycolysis | hexokinase; glucokinase (liver) | Glucose 6P (-) | ||
| PFK-1 |
Fructose 2,6BP, AMP (+) Citrate (-) |
↑ Insulin/Glucagon leads to dephosphorylation of PFK2 and increases producthe tion of F2,6BP | ||
| Pyruvate Kinase |
Fructose 1,6BP (+) ATP, Alanine (-) |
↑ Insulin/Glucagon leads to dephosporylation | ||
| Pyruvate Dehydrogenase | PDC |
Pyruvate, NAD+ (+) Acetyl CoA, NADH, ATP (-) |
dephosphorylation by PDP (+) phosphorylation by PDK (-) |
↑ Insulin/Glucagon leads to dephosphorylation |
Table \(\PageIndex{1}\): Summary of the regulation of pyruvate through glycolytic enzymes and pyruvate dehydrogenase
Regulation of Citrate Synthase
Citrate synthase (ΔGo = -7.5 kcal/mol, -31 kJ/mo), Isocitrate dehydrogenase (ΔGo = -2.0 kcal/mol, -8.4 kJ/mol) and alpha-ketoglutarate dehydrogenase (ΔGo = -7.2 kcal/mol, -30 kJ/mol) are all exergonic and likely candidates for regulation. Indeed they are. Let's start with citrate synthase.
Citrate synthase is regulated in part by the availability of substrate acetyl-CoA and oxaloacetate. It is inhibited by NADH and also citrate, a competitive inhibitor of oxaloacetate binding. Succinyl-CoA, a downstream product of the citric acid cycle, is a competitive inhibitor of acetyl-CoA binding.
Figure \(\PageIndex{4}\) shows an interactive iCn3D model of a structural comparison of pig citrate synthase with bound citrate (1CTS) and with bound citrate and CoASH (2CTS)
_and_with_bound_citrate_and_CoASH_(2CTS).png?revision=1&size=bestfit&width=450&height=345)
 Figure \(\PageIndex{4}\): Structural comparison of pig citrate synthase with bound citrate (1CTS) and with bound citrate and CoASH (2CTS). (Copyright; author via source). Click the image for a popup or use this external link: https://structure.ncbi.nlm.nih.gov/i...94UeRDsFyGTcdA
Toggle the "a" key back and forth to change from the open structure (gray) with bound citrate (1CTS) to the closed structure (cyan) after CoASH binds (2CTS).
Citrate and CoASH are the products of citrate synthase reaction, but seeing how they interact with the protein gives clues into catalysis. When both are bound, the enzyme is in closed conformation which would prevent spurious hydrolysis of the actual acetyl-CoA when the reaction proceeds to citrate formation. In just the presence of citrate, the enzyme is in open form, allowing the release of citrate as a product. The binding of the reactant oxaloacetate triggers the conversion to the closed form. NADH is reported to be an allosteric inhibitor of bacterial citrate synthases but no entries are available for the binding of NADH to mammalian enzymes.
The effects of binding acetyl-CoA on the structure of citrate synthase are shown in Figure \(\PageIndex{5}\):

Figure \(\PageIndex{5}\): Effect of acetyl-CoA binding on CS structure. Omini, J., Wojciechowska, I., Skirycz, A. et al. The association of the malate dehydrogenase-citrate synthase metabolon is modulated by intermediates of the Krebs tricarboxylic acid cycle. Sci Rep 11, 18770 (2021). https://doi.org/10.1038/s41598-021-98314-z. Creative Commons Attribution 4.0 International License. http://creativecommons.org/licenses/by/4.0/.
Panel (A) shows the open format of CS (PDB ID, 1cts) in a cartoon model, with cylindrical α-helices containing a citrate molecule in a stick model. Subunits A and B are colored white and cyan, respectively. Key residues, A266Lys, A46Arg, and B164Arg, are shown in the sticks’ side chains. The residues are shown in the order of the chain name, residue number, and amino acid. the dimer structure was generated using crystallographic symmetry. One active site domain composed mainly of the A-chain is shown.
Panel (B) shows the superimposed model between the open (1cts; white) and close (2cts; wheat) formats. The citrate molecule is at the same location with a slight rotation. The CoA molecule is present only in the closed format. The molecular domain shown can be divided into the movable upper half and the rigid bottom half. In the bottom domain, A45Arg and B146Arg are shown in the stick model. The locations of those two Cα in Arg are almost consistent between the open and closed formats. The top half domain is movable. The motion is visible as the rotation of α-helices represented by A312Gly and A365Gly, indicated by arrows. The A366Lys moves inward and forms a hydrogen bond network A366Lys (NZ):: A438COA(O8A):: B164Arg(NH1).
Panel (C) shows the closed format of CS (PDB ID, 2cts) with citrate and CoA molecules in stick models.
Panel (D) shows the surface electrostatic potential of the open format CS excluding ligands. Calculations were performed in the vacuum environment and ranged between − 71 and + 71. Red and blue represent the negative and positive potentials. The domain shown corresponds to panel A. Patches of negative charge (NC) and hydrophobic area (HF) are observed.
Panel (E) shows the surface electrostatic potential of the closed format CS excluding ligands. The domain shown corresponds to panel D. Patches of positive charge (PC1, PC2) are observed.
We will see how the electrostatic surface potential of citrate synthase allows it to interact with other citric cycle enzymes to form a metabolon at the end of this chapter section.
Regulation of Isocitrate Dehydrogenase
In the previous section, structures of the αγ and αβ heterodimer building blocks of the protein were described. The α subunits contain the catalytic site while the β and γ subunits were the regulatory subunits that bind allosteric effectors. Citrate and ADP allosterically activate both the α2βγ heterotetramer and αγ heterodimer. They bind next to each other in the allosteric site, along with Mg2+. Conformational changes in binding citrate lead to a change in and activation of the catalytic subunit α. The binding of ADP just enhances this effect.
The domain and cartoon structure of the αγ heterodimer of human NAD-IDH are shown in Figure \(\PageIndex{6}\).

Figure \(\PageIndex{6}\): Domain and cartoon structure of the αγ heterodimer of human NAD-IDH. Ma, T., Peng, Y., Huang, W. et al. Molecular mechanism of the allosteric regulation of the αγ heterodimer of human NAD-dependent isocitrate dehydrogenase. Sci Rep 7, 40921 (2017). https://doi.org/10.1038/srep40921. Creative Commons Attribution 4.0 International License. http://creativecommons.org/licenses/by/4.0/
The top panel shows the domain structure of the two monomers. The bottom panel shows two views of the dimer. The color coding is the same as in the top panel.
Figure \(\PageIndex{7}\) shows bound citrate and ADP in the allosteric binding site in the γ subunit of IDH.

Figure \(\PageIndex{7}\): Bound citrate and ADP in the allosteric binding site in the γ subunit of IDH. Ma et al, ibid.
The color represents the electrostatic surface potential of the site with blue indicating more positive and red more negative. Note that both allosteric activators bind adjacent to each other. The binding of ADP does not change the conformation after the citrate is bound.
The proposed molecular mechanism for allosteric regulation of IDH is shown in Figure \(\PageIndex{8}\).
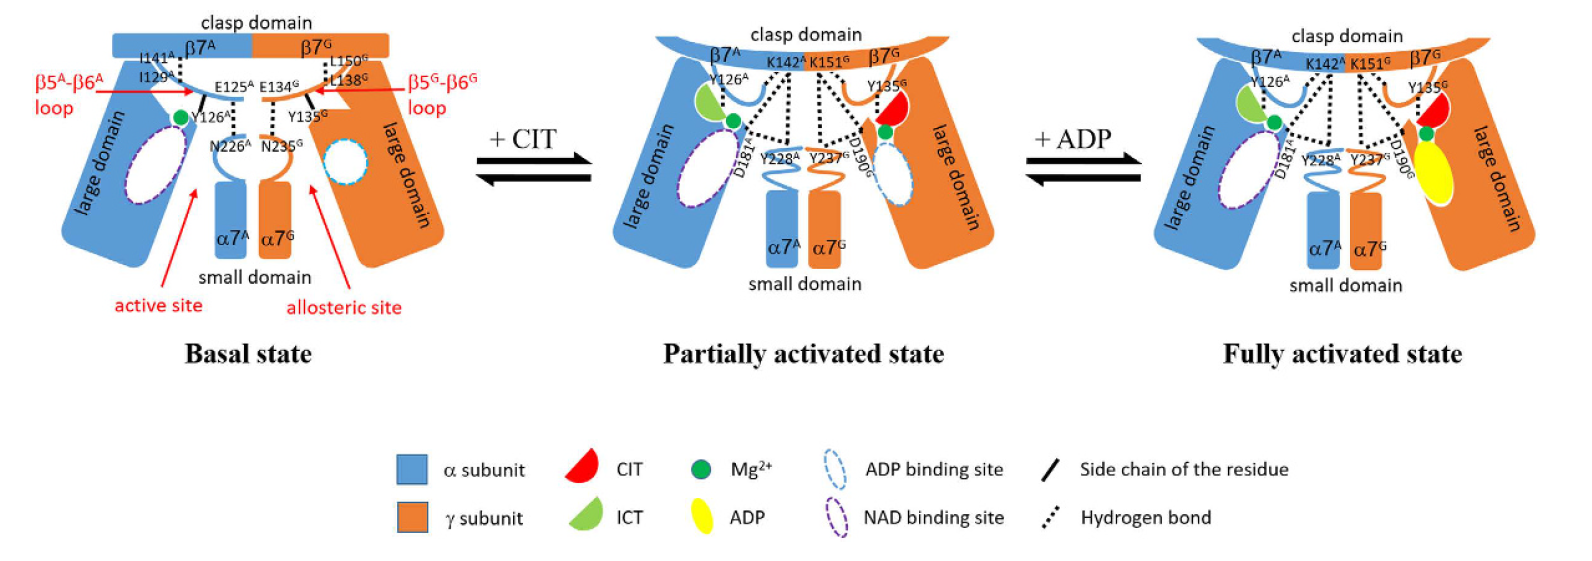
Figure \(\PageIndex{8}\): Mechanism mechanism of allosteric regulation of the αγ heterodimer of IDH. Ma et al, ibid.
Legend: In the absence of any activators, the active site adopts an inactive conformation unfavorable for the ICT binding, and the enzyme is in the basal state which has a high S0.5,ICT with a low catalytic efficiency. The binding of CIT induces conformational changes at the allosteric site, which are transmitted to the active site through conformational changes of the structural elements at the heterodimer interface, including the β5–β6 loop, the α7 helix, and the β7-strand in both the α and γ subunits, leading to the conversion of the active site from the inactive conformation to the active conformation favorable for the ICT binding. Hence, the enzyme assumes the partially activated state which has a moderately decreased S0.5,ICT (lower substrate concentration for half-maximal activity) with a moderately increased catalytic efficiency. The binding of ADP in the presence of CIT does not induce further conformational changes at the allosteric site and the active site but establishes a more extensive hydrogen-bonding network among CIT, ADP, and the surrounding residues through the metal ion, which conversely enhances or stabilizes the CIT binding. Hence, the binding of CIT and ADP together has a synergistic activation effect, and the enzyme assumes the fully activated state which has a substantially decreased S0.5,ICT with a significantly increased catalytic efficiency.
Regulation of α-ketoglutarate dehydrogenase
α-ketoglutarate dehydrogenase and pyruvate dehydrogenase complex both catalyzed the oxidative decarboxylation of α-ketoacids. They use a common mechanism involving three enzymes, E1-E3, in a large complex. The regulation of α-ketoglutarate dehydrogenase activity is shown in Figure \(\PageIndex{9}\).

Figure \(\PageIndex{9}\): Regulation mechanisms of α-ketoglutarate dehydrogenase complex (α-KGDC). Vatrinet, R., Leone, G., De Luise, M. et al. The α-ketoglutarate dehydrogenase complex in cancer metabolic plasticity. LS and DHLA are lipoamide and dihydrolipoamide, respectively. TPP is thiamine pyrophosphate. Cancer Metab 5, 3 (2017). https://doi.org/10.1186/s40170-017-0165-0. Creative Commons Attribution 4.0 International License (http://creativecommons.org/licenses/by/4.0/),
As with the other key regulatory enzymes, α-KGDC is regulated by ATP/ADP and NADH/NAD+ ratios. The product, succinyl-CoA inhibits the reaction at E2. The mitochondria are reservoirs for Ca2+ ions. These ions increase the activity of pyruvate, isocitrate, and α-ketoglutarate dehydrogenases with α-ketoglutarate dehydrogenases most affected. Calcium effects also depend on ATP/ADP and NADH/NAD+ ratios.
Regulation by Metabolon Formation
Several citric acid cycle enzymes interact to form a metabolon, which allows enhance flux through pathways as substrate and products are channeled directly from one enzyme to another in the complex. This "facilitated" diffusion minimizes the dissociation of substrates/products and enhances catalysis. Three enzymes in the citric acid cycle, citrate synthase, malate dehydrogenase, and aconitase form a metabolon, as shown by chemical cross-linking and docking studies. The linkages between malate dehydrogenase, which produces oxaloacetate, and citrate synthase, which uses it, are important since concentrations of oxaloacetate are low and would produce reduced flux in the citric acid cycle if it were not channeled directly into citrate synthase. Malate dehydrogenase is also not favored to produce oxaloacetate based on standard free energy and Keq values so pulling the reaction towards citrate synthase in the metabolon also helps the flux.
L-malate+ NAD+ ↔ oxaloacetate + NADH + H+ ΔGo = +7.1 kcal/mol (+30 kJ/mol)
Figure \(\PageIndex{10}\) shows models of malate dehydrogenase (MDH) and the open and closed forms of citrate synthase (CS). Electrostatic interactions are key.

Figure \(\PageIndex{10}\): Models of malate dehydrogenase (MDH) and the open and closed forms of citrate synthase (CS). Omini, J., Wojciechowska, I., Skirycz, A. et al. Association of the malate dehydrogenase-citrate synthase metabolon is modulated by intermediates of the Krebs tricarboxylic acid cycle. Sci Rep 11, 18770 (2021). https://doi.org/10.1038/s41598-021-98314-z. http://creativecommons.org/licenses/by/4.0/.Creative Commons Attribution 4.0 International License.
Panels (F) and (G) show simulated interactions between MDH (green) and CS in its open (white) form (panel F) and between MDH (green) and CS in its closed (wheat) format (panel G). The 65Arg and 67Arg residues that are involved in the MDH-CS interaction are highlighted in blue. Active site residues, His 274, His320 (blue), and Asp375 (red) were shown.
Panel (H) Predicted acetyl-CoA binding sites in CS apoenzyme. The white surface model of the CS apoenzyme in the open format is shown. The 274His, 320His, 65Arg, and 67Arg residues are highlighted in blue. The orange mesh indicates the positions of acetyl-CoA at the predicted binding sites. White and orange stick models indicate the citrate and CoA in the reported crystal structure, respectively.
Does the activity of citrate synthase change when it is complexed to malate dehydrogenase in a metabolon? The results of studies probing that question show that it is affected. The results of such studies are shows that it does as illustrated in Figure \(\PageIndex{11}\).
 |
 |
 |
Figure \(\PageIndex{11}\): Effects of metabolites involved in the MDH and CS reactions on the affinity of the MDH-CS multi-enzyme complex. Omini et al, ibid.
Curves represent the response (fraction bound) against CS concentration (M). The interaction was assessed in the MST buffer (control, green) or those with 10 mM of metabolites. Error bars represent the standard deviations of three measurements. Asterisks indicate the conditions that showed significant Kd differences with no Kd confidence overlap with the control.
Panel (A) shows the effects of the reaction substrates of MDH and CS. The MDH-CS interaction was assessed in the presence of acetyl-CoA (red), NAD+ (blue), or malate (brown).
Panel (B) shows the effects of the reaction on products of CS and MDH. The MDH-CS interaction was assessed in the presence of CoA (grey), NADH (orange), or citrate (green).
Panel (C) shows the effects of oxaloacetate (OAA) in combination with other CS substrates. The effects of sole substrates, acetyl-CoA (red), OAA (blue), and NADH (orange), as well as their combinations, OAA/acetyl-CoA (purple) and OAA/NADH (gray), were analyzed.
These curves clearly show how the ratio of NADH/NAD+ affects the activity of citrate synthase when it is part of a metabolon. NAD+ increases activity (Panel A) while NADH decreases it (Panel B).