
Investigation: Osmosis and Water Potential
- Page ID
- 26485
This page is a draft and is under active development.
Objectives
- Investigate the processes of osmosis in a model of a membrane system
- Investigate the effect of solute concentration on water potential
Materials
- 8 beakers or cups
- dialysis tubing
- sucrose solutions
- string or dental floss
- baby carrots or potatoes
Exercise 1 - Osmosis Across a Membrane
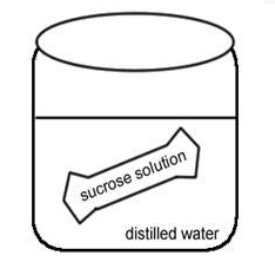
1. Obtain 6 strips of dialysis tubing and tie a knot in one end of each.
2. Pour approximately 15-20 ml of each of the following solutions into separate bags.
- Distilled Water
- 0.2 M sucrose
- 0.4 M sucrose
- 0.6 M sucrose
- 0.8 M sucrose
- 1.0 M sucrose
3. Remove most of the air from the bag (but leave a little bit of space) and tie the baggie.
4. Blot the bags to remove any sugar that may have spilled, check the bags for leaks.
5. Record the mass of each baggie in the data table.
6. Fill six beakers with enough distilled water to cover your bags. Place a bag in each one (keep track of which bag is in which beaker)
7. Let the bag sit for 20-30 minutes. -------- While this is running, set up potatoes for exercise 2.
8. After 20-30 minutes, remove the baggies from the water, and carefully blot dry and record the final weight.
9. To calculate: percent change in mass= (final mass-initial mass)/ initial mass. Then multiply answer by 100.
|
Contents in Bag |
Initial Mass |
Final Mass |
Mass Difference |
Time in Beaker |
% Change in Mass |
|
Distilled Water |
|
|
|
|
|
|
0.2 M |
|
|
|
|
|
|
0.4 M |
|
|
|
|
|
|
0.6 M |
|
|
|
|
|
|
0.8 M |
|
|
|
|
|
|
1.0 M |
|
|
|
|
|
11. Graph the results of your data to show the relationship between molarity and % change in mass. The independent variable is on the X axis, and the dependent variable is on the Y axis. Draw a line of BEST FIT.
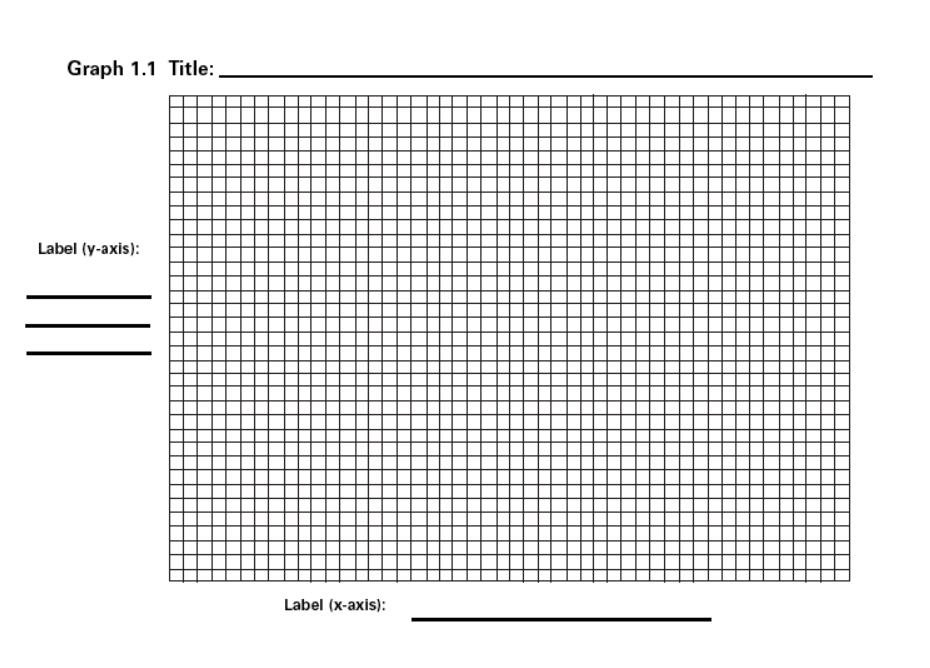
ANALYSIS
1. Describe the relationship shown by graph. Summarize what happened in the experiment as shown by data.
2. Why did you calculate the percent change in mass rather than simply using the change in mass?
3. Predict what would happen to the mass of each bag in this experiment if all the bags wee placed in 0.4 M sucrose solution instead of distilled water. Explain your response.
EXERCISE 2 - Determining the Water Potential of Plant Cells
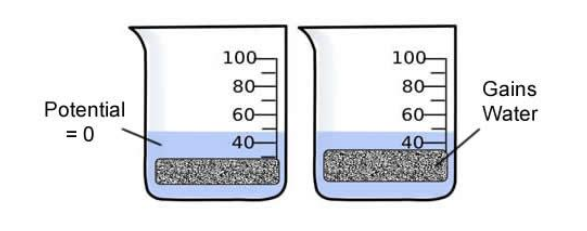
In animal cells, the movement of water into and out of the cell is influenced by the relative concentration of solute on either side of the cell membrane. If water moves out of the cell, the cell will shrink. If water moves into the cell, the cell may swell or even burst. In plant cells, the presence of a cell wall prevents the cells from bursting, but pressure does eventually build up inside the cell and affects the process of osmosis. When the pressure inside the cell becomes large enough, no additional water will accumulate in the cell. So movement of water through the plant tissue cannot be predicted simply by knowing the relative solute concentrations on either side of the plant cell wall. Instead, the concept of water potential is used to predict the direction in which water will diffuse through living plant tissues.
In a general sense, the water potential is the tendency of water to diffuse from one area to another. Water potential is expressed in bars, a metric unit of pressure equal to about 1 atmosphere and measured with a barometer.
Consider a potato cell is placed in pure water. Initially the water potential outside the cell is 0 and is higher than the water potential inside the cell. Under these conditions there will be a net movement of water into the cell. The pressure potential inside the cell will increase until the cell reaches a state of equilibrium.
Directions:
1. Pour 100ml of your assigned solution (it will be one of the six solutions listed above in Exercise 2) into a beaker.
2. Determine the mass of either a potato slice or a baby carrot. Your teacher will assign you to a potato or carrot group.
3. Place the potato or carrot into the beaker with your solution and cover with plastic wrap. Leave overnight.
4. Remove the plants from the beakers and record the mass.
5. Complete the table and graph your results.
|
Plant Investigated: (Potato or Carrot?) |
Temperature: | |||
|
Contents in Bag |
Initial Mass |
Final Mass |
Mass Difference |
%Change in Mass |
|
Distilled Water |
|
|
|
|
|
0.2 M |
|
|
|
|
|
0.4 M |
|
|
|
|
|
0.6 M |
|
|
|
|
|
0.8 M |
|
|
|
|
|
1.0 M |
|
|
|
|
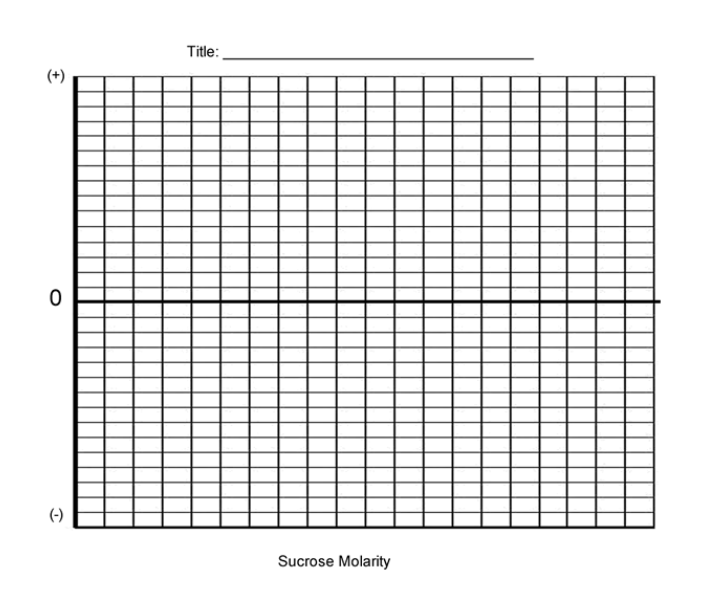
6. Determine the molar concentration of the potato cores. This would be the sucrose molarity in which the mass of the potato core does not change.
To find this, draw a straight line on your graph that best fits your data. The point at which this line crosses the x axis represents the molar concentration of sucrose with a water potential that is equal to the potato tissue water potential.
What is the Molar concentration of the cores? ___________
7. Calculate the solute potential ( Ψ ) for the sucrose solution using the formula below. Solute potential: _____
Solute Potential Formula → Ψ = -iCRT
i = ionization constant (for sucrose, this is 1 because sucrose does not ionize in water)
C = molar sucrose concentration at equilibrium (determined from graph)
R = pressure constant (0.0831 liter bar/mole °K )
T = temperature °K (273 + °C )
8. Explain water potential and describe how it affects osmosis. Refer to the text at the beginning of this section of the investigation.
9. Explain how to determine the molarity of a potato or carrot.
10. Examine the groups that did the other plant sample. Do carrots and potatoes have similar water potentials? Suggest a reason for why there might be differences between the two types of plant cells.
11. Design an Experiment: If you are given a solution of sucrose that has an unknown molarity (.2, .4, .6, .8, 1.0), how could you use potatoes, distilled water, or other known solutions to determine the molarity of your unknown? - Be clear in your design, you may even want to include sketches to show how you would perform this test. If there is time, you may be given the opportunity to test an unknown.
Extension: Design an Experiment to Test an Unknown
You are given a solution of sucrose that has an unknown molarity (.2, .4, .6, .8, 1.0), how could you use potatoes, distilled water, or other known solutions to determine the molarity of your unknown? - Be clear in your design, use another page and staple to this one. Conduct your experiment and include the results with your determination of which solution you had. Solutions will be color-coded by the instructor.
Which solution did you investigate (color)? ____________
1) Describe or sketch your experimental design:
2) Make a CLAIM about the molarity of your solution and provide EVIDENCE from your experiment.
3) Suggest ways to improve your experimental design or to obtain greater confidence in your claim. If you were given another day to work on this, what would you do?