
8.11: Next Gen Sequencing
- Page ID
- 24788

Expansion of Sequencing Technology
Credit: Jeremy Seto (CC-BY-NC-SA 3.0)
Traditional sequencing of genomes was a long and tedious process that cloned fragments of genomic DNA into plasmids to generate a genomic DNA library (gDNA). These plasmids were individually sequenced using Sanger sequencing methodology and computational was performed to identify overlapping pieces, like a jigsaw puzzle. This assembly would result in a draft scaffold.
As technology improved, the cost of sequencing genomes became less expensive. This technology outpaced Moore’s Law, a semiconductor projection about the speed of computers as time progressed. A dramatic price decrease in the cost of genome sequencing occurred around 2008 due to technical advances.

As the cost of genome sequencing decreased, a dramatic increase in genome deposition into Genbank was observed. These deposits reflected small genomes of bacteria and archaea.

Credit: Estevezj (CC-BY-SA 3.0)
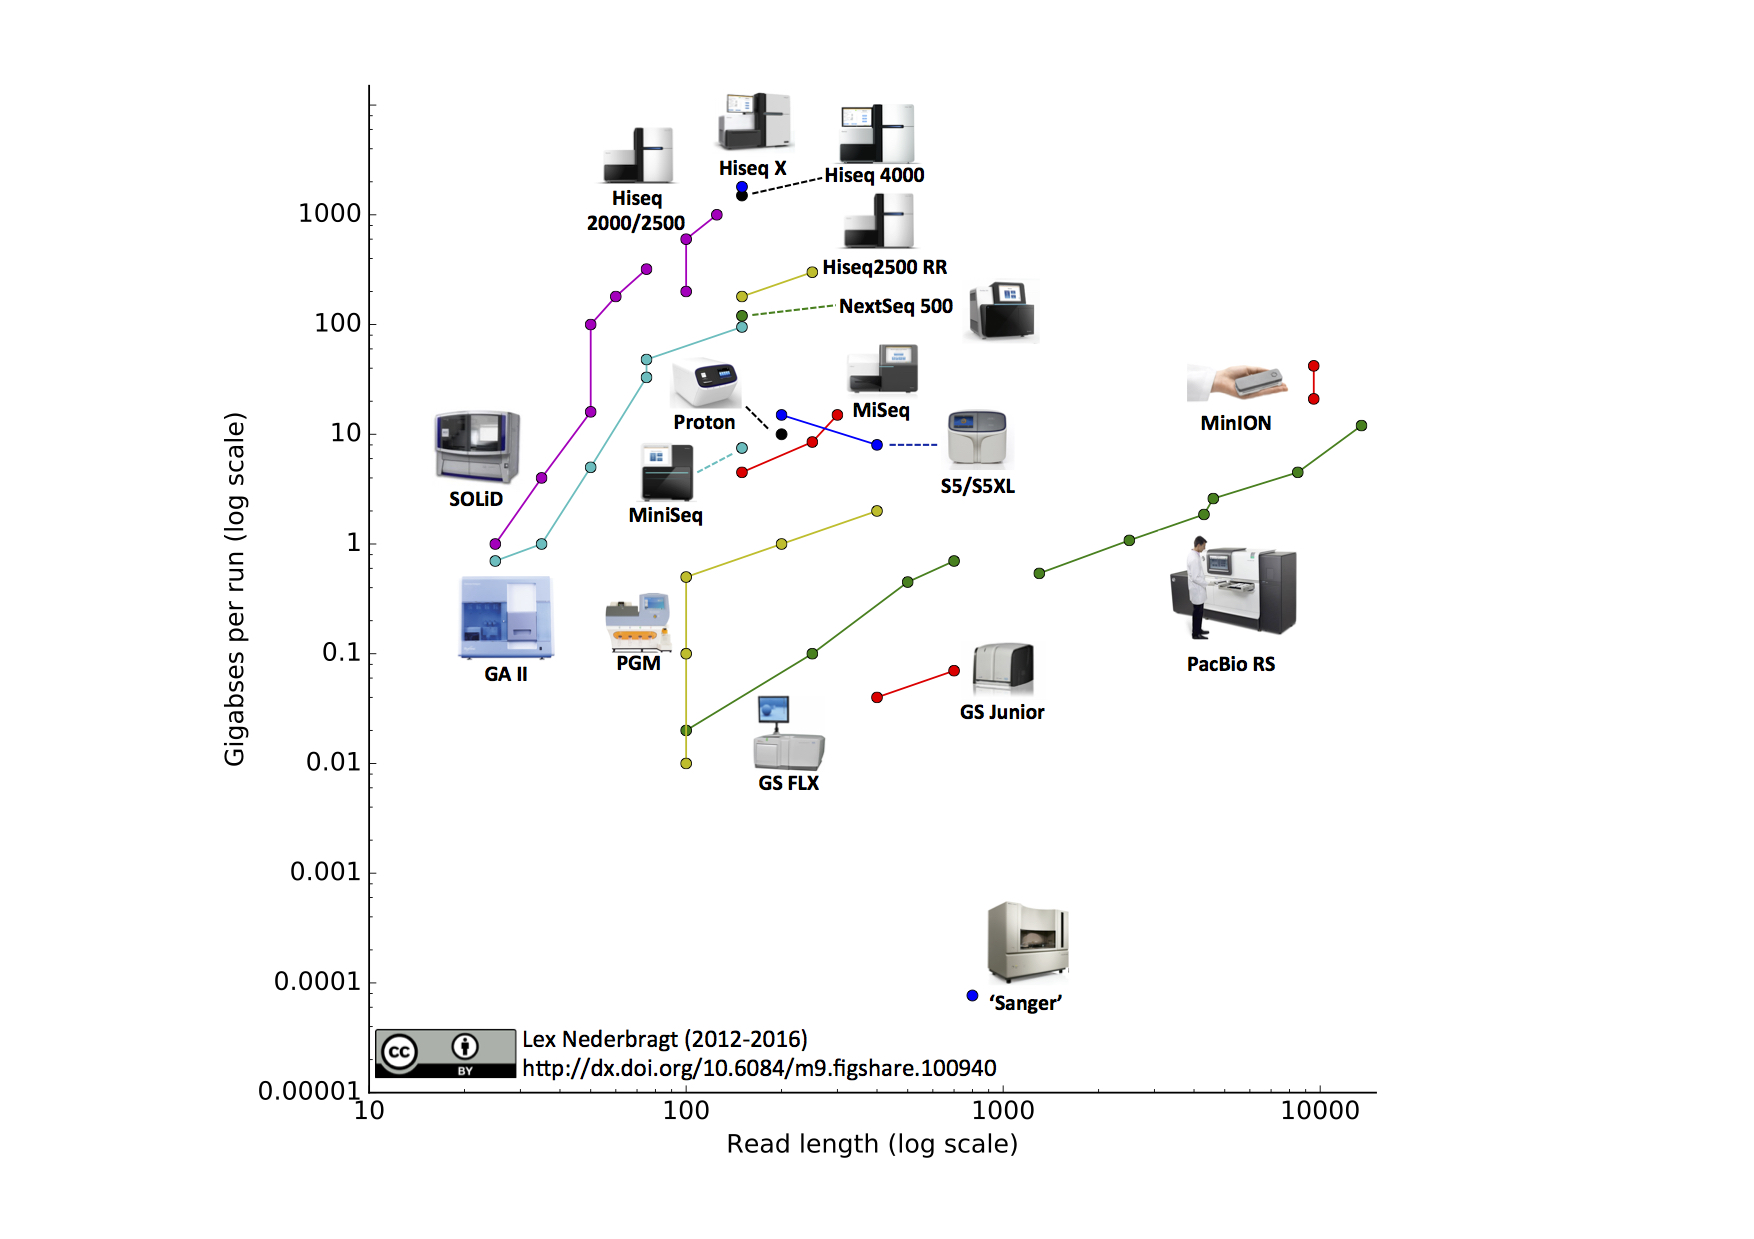
The decrease in per nucleotide sequencing cost came from the parallelization of sequencing. Whereas Sanger Sequencing is capable of sequencing one stretch at a time, a parallel assembly of sequencing reactions has led to the high throughput sequencing often dubbed Next Generation Sequencing (NGS).
High Throughput Sequencing Applied to Genome Sequencing (TEDed CC BY-NC-ND 4.0)
Short Read Sequencing by Synthesis
Illumina
Illumina short-read sequencing uses flow cell technology where oligonucleotides complementary to adapter primers are physically seeded.

Flow cell surface with the adapter oligonucleotides. Credit: DMLapato (CC-BY-SA 4.0)
Fragmented DNA sequences are adapted with primers through ligation and hybridized to the flow cell. To increase the signal from sequencing, the short DNA sequences are amplified through a process called bridge amplification or cluster generation.

Cluster generation through bridge amplification. A low numb er of PCR cycles is used. Cluster generation aids in subsequent signal/noise determination.
Credit: DMLapato (CC-BY-SA 4.0)
The flow cell undergoes successive rounds of flooding with a fluorescent nucleotide, permitted to incorporate with a DNA polymerase and washed away. After each flood/wash cycle, fluorescent signals are measured to indicate the incorporation. Specific locations of fluorescence are tracked and consolidated to indicate the sequence at each registered point.

Each flow cycle introduces a fluorescent nucleotide for incorporation. Credit: Abizar Lakdawalla (CC-BY 3.0)
Ion Torrent
Fragmented DNA is ligated to adapter sequences and adhered onto microbeads. The beads are embedded into microwells on a semiconductor. Ion Torrent performs the sequencing reactions in an unbuffered solution since the semiconductor acts as a pH meter to identify nucleotide incorporation. Standard nucleotides are flooded onto the chip and incorporated. Because nucleotide incorporation creates a proton (H+), a microenvironment of low pH is detected in the unbuffered solution.
Single-Molecule Real-Time Sequencing
Pac Bio
Pac Bio uses nano wells with covalent-bonded DNA polymerase to sequence individual molecules of DNA. Fluorescent nucleotides are incorporated during synthesis reactions and real-time incorporation can be measured. Pac Bio sequencing has the advantage of sequencing fragments of 10-20kb, in stark contrast to the short-read methods.
Oxford Nanopore

Credit: George Church (CC-BY 3.0)
Oxford Nanopore utilizes the protein alpha-hemolysin integrated onto a semiconductor chip. The pore size of the protein is the correct ssize for a single DNA molecule to fit through. A DNA Polymerase molecule is linked to the opening of the pore where the replicated DNA is fed through. As the DNA traverses the pore, the voltage changes are measured and mapped to the qualities of specific bases.
Link: youtu.be/BNz880V52rQ
Sequence Output
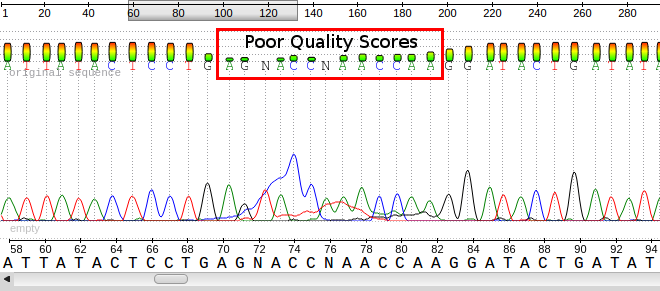
A sample ab1 file displaying the base calls, the chromatograms and the quality scores for each base. Notice the poor quality in the red box and the corresponding peaks/bases.
The output file of the next-generation sequencing methods utilizes the fastq format. Like a fasta file, there is a header that describes the sequence. The first line is the header or title line which begins with ‘@‘ (remember that fasta begins with ‘>‘). The second line is the actual raw sequence (once again similar to fasta). The third line has no meaning while the fourth line is filled with symbols as long as the sequence line. This last line is the quality score of the base call. As with the Sanger sequencing, there may be ambiguity with the base call of the sequence and the certainty is maintained in the quality score.
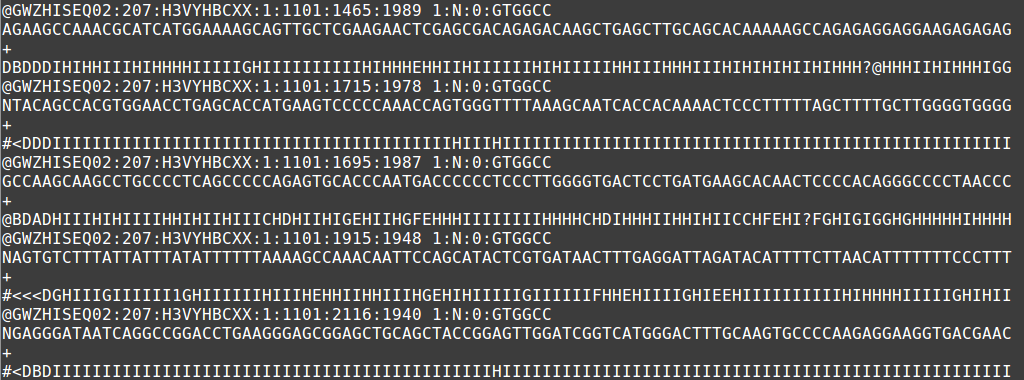
Sample fastq file displaying 5 short-read sequences.
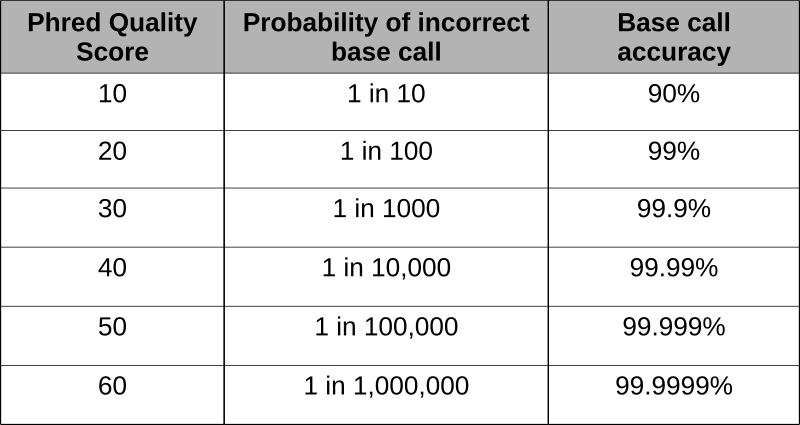
Phred scores were developed to assess the quality of the base calls arising from fluorescent Sanger sequencing during the Human Genome Project. The phred program scans the peaks of the chromatogram and scores based on the certainty or accuracy of the call. The scores are logarithmically based and scores greater than 20 represent greater than 99% accuracy of the base call.
Using the phred scores embedded in the last line of fastq files, poor quality reads can be removed. Using a program like FastQC permits the assessment of the reads and produces the graphical representation of quality.
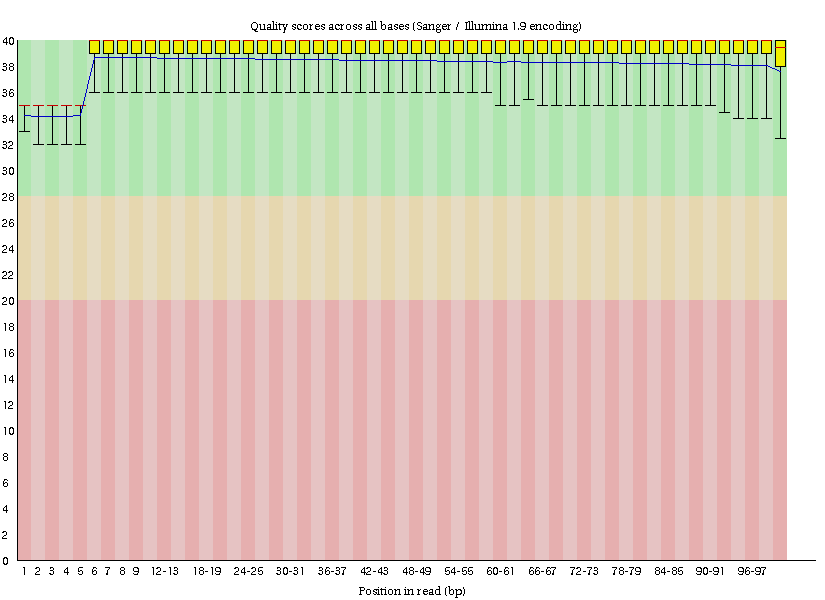
FastQC quality output illustrating the Phred score for each base call.
This short read sequence of about 100 nucleotides has all bases made at greater than 30, or > 99.9% accuracy.
Assembly and Alignment
Sequences from short reads must be assembled into a usable sequence. To do so, a reference genome may aid in the assembly after adapter sequences are trimmed using automated methods. In the case that there is no reference genome, a related species may be used or a more computationally intensive process of de novo assembly must take place. With de novo assembly, it may be useful to have some long reads performed with PacBio to create scaffolds for generating the assembly into contiguous sequences, or contigs.

RNA-Seq

Credit: Malachi Griffith, Jason R. Walker, Nicholas C. Spies, Benjamin J. Ainscough, Obi L. Griffith (CC-BY 4.0) https://doi.org/10.1371/journal.pcbi.1004393

Credit: Rgocs (CC-BY)
RT-PCR and RT-qPCR can be used to measure the abundance of specific transcripts in a fairly low throughput way. Leveraging the concept of Reverse Transcription and coupling that to high-throughput sequencing technologies, transcripts can be sequenced and mapped to a genome to depict the quantity of transcripts as represented by the number of reads.
Given sufficient read coverage, novel splice isoforms can also be identified as different exon-exon junctions are identified.
The general workflow of RNA-Seq analysis follows:

Credit: Salubrious Toxin (CC-BY-SA 4.0)